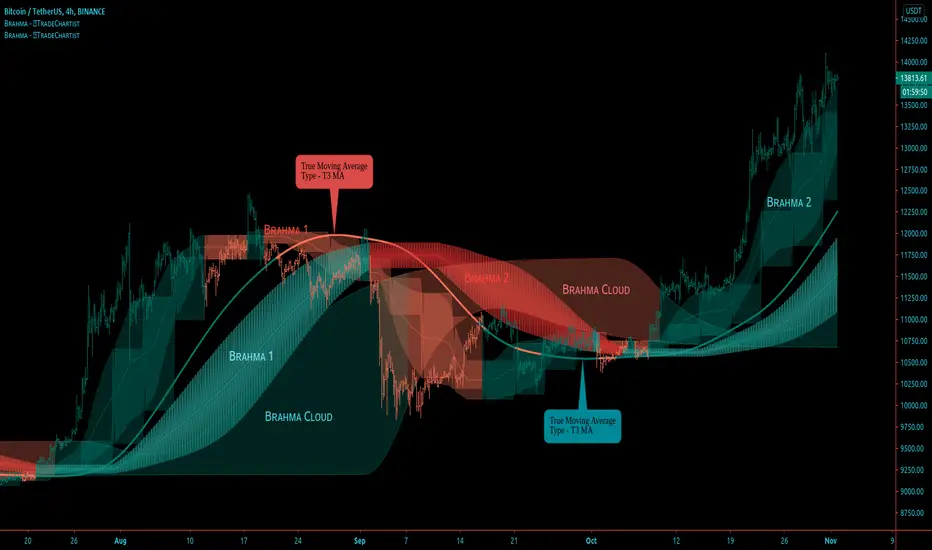
BRAHMA - Better Remodelled Adaptive Holistic Moving Average™𝗧𝗿𝗮𝗱𝗲𝗖𝗵𝗮𝗿𝘁𝗶𝘀𝘁 𝗕𝗥𝗔𝗛𝗠𝗔 (Better Remodelled Adaptive Holistic Moving Average) is an exceptionally versatile Moving Average, that can adapt, expand and transform into a better Moving Average system that consists of BRAHMA bands and BRAHMA steps, both emanating from a singular plot based on the source price and the lookback length. The system also consists of BRAHMA cloud which is based on the source price, the lookback length, the step length and the cloud factor. In addition to using the source price directly, the indicator offers 15 different Moving Average types that can be used on the source price for BRAHMA system to adapt to, offering several possibilities to visualize and trade the price action.
===================================================================================================================
™𝗧𝗿𝗮𝗱𝗲𝗖𝗵𝗮𝗿𝘁𝗶𝘀𝘁 𝗕𝗥𝗔𝗛𝗠𝗔 𝗨𝘀𝗲𝗿 𝗠𝗮𝗻𝘂𝗮𝗹
=====================================
Like any other moving average system, the source price and the lookback length determines the dynamic of BRAHMA . Source price can be selected from Sᴏᴜʀᴄᴇ dropdown and the lookback length can be enetered in the Bʀᴀʜᴍᴀ Lᴇɴɢᴛʜ input box. MA ᴛʏᴘᴇ dropdown is used to choose the type of moving average for BRAHMA to adapt to. To use the source price directly, Use Source must be selected from the dropdown.
In addition to this usual requirement, Bʀᴀʜᴍᴀ Wɪᴅᴛʜ and Bʀᴀʜᴍᴀ Sᴛᴇᴘ Lᴇɴɢᴛʜ are required to make BRAHMA moving average system complete, based on risk and reward expectations of the user.
===================================================================================================================
BRAHMA Bands and Steps
The Bands and the Steps are integral part of the BRAHMA system. When the Bʀᴀʜᴍᴀ Wɪᴅᴛʜ and Bʀᴀʜᴍᴀ Sᴛᴇᴘ Lᴇɴɢᴛʜ values are 1, the bands and steps lie dormant inside BRAHMA and they emanate from the main plot as the values are increased.
Bʀᴀʜᴍᴀ Wɪᴅᴛʜ impacts the Bands Mean line + expands or contracts the bands and Bʀᴀʜᴍᴀ Sᴛᴇᴘ Lᴇɴɢᴛʜ transforms the dormant step system (on minimum value of 1) from inside the BRAHMA bands into a powerful step/block like structure that helps find support/resistance levels and displays Bull and Bear zones based on price action in relation to the BRAHMA bands and BRAHMA steps .
Dɪsᴘʟᴀʏ Bʀᴀʜᴍᴀ Sᴛᴇᴘs plots the steps
Dɪsᴘʟᴀʏ Bʀᴀʜᴍᴀ Bᴀɴᴅs plots the bands
Enabling Cᴏʟᴏᴜʀ Bᴀʀs with Bands and Steps displayed will plot the Bull and Bear Zones on price bars and this dynamic is very different from the colouring of the bars based on the cloud as a standalone plot.
===================================================================================================================
BRAHMA Cloud
The cloud is a very useful part of this system and helps see the price action with the help of volatility of Bulls/Bears based on the lookback length, step length and the cloud factor. Price above or below the cloud helps visualize the strength of the trend along with the height/thickness of the cloud. Thinning of the cloud can signal reversals and can be used with another confirmator.
Cʟᴏᴜᴅ Fᴀᴄᴛᴏʀ (1 - 10) affects the cloud dynamic and can be changed to suit personal risk strategy and trade frequency. Cloud sensitivity is also affected by the Bʀᴀʜᴍᴀ Lᴇɴɢᴛʜ . Cloud can be used on its own with really low lookback length (even length of 1 works well).
Dɪsᴘʟᴀʏ Bʀᴀʜᴍᴀ Cʟᴏᴜᴅ plots the cloud
Enabling Bʀᴀʜᴍᴀ Cᴏʟᴏᴜʀ Bᴀʀs with Cloud displayed as the only standalone component of the indicator will plot the Bull and Bear Zones and this dynamic is very different from the colouring of the bars based on the Bands and Steps on chart. When the price enters the cloud from below after or during a period of downtrend will start painting Bull colour and when the price enters the cloud from above after or during a period of uptrend will start painting Bear colour on the price bars.
===================================================================================================================
BRAHMA Colour Scheme
The colours of the plots and fills can be changed based on user preference from the indicator settings.
There are three Themes to choose from Bʀᴀʜᴍᴀ Cᴏʟᴏᴜʀ Bᴀʀs Tʜᴇᴍᴇ (Simple, Chilli and Flame) dropdown to colour the price bars.
Enabling Bʀᴀʜᴍᴀ Cᴏʟᴏᴜʀ Bᴀʀs with Simple Theme colours the price bars based on Bull and Bear zones as explained in the sections above. Chilli and Flame themes colour the price bars with trend intensity for every bar based on the source price and lookback length.
===================================================================================================================
Alerts
Alerts can be created for Long and Short entries by using Once Per Bar Close as Alert Frequency. Entries are generated on Real time bars. It is recommended to wait for bar close before taking a position based on Trade Entries.
The indicator does not repaint and can be confidently used for alerts and trade entries without worrying about signals disappearing.
™TradeChartist BRAHMA can also be connected to ™TradeChartist Plug and Trade using 𝗕𝗥𝗔𝗛𝗠𝗔 𝗧𝗿𝗲𝗻𝗱 𝗜𝗱𝗲𝗻𝘁𝗶𝗳𝗶𝗲𝗿 as Oscillatory Signal to generate entries along with Targets, Stop Loss plots etc. Target and Stop Loss alerts can be created using Plug and Trade's Alerts system.
===================================================================================================================
Example Charts
1. The 15m chart below demonstrates how a Simple Moving Average can be transformed from a noisy pretty much untradeable MA plot to meaningful Moving Average Trade System using BRAHMA by adjusting the Width and the Step Length.
2. GBP-USD 1hr chart using 34 period Zero-Lag EMA with 21 width and 24 step length (24 hrs in a Daily candle - This helps choose length for HTF based levels)
3. NIFTY 1hr chart using 21 period TEMA (Triple Exponential MA) with 21 width and 24 step length.
4. XAU-USD Daily chart using 89 period TEMA with 24 width and 12 step length, enabling Chilli Theme based colour bars.
5. LINK-USDT 1hr chart using 21 period Hull MA with 24 width, 24 step length and cloud factor of 2 visualised using colour bars on cloud as standalone plot.
===================================================================================================================
Best Practice: Test with different settings first using Paper Trades before trading with real money
===================================================================================================================
This is not a free to use indicator. Get in touch with me (PM me directly if you would like trial access to test the indicator)
Premium Scripts - Trial access and Information
Trial access offered on all Premium scripts.
PM me directly to request trial access to the scripts or for more information.
===================================================================================================================
Bands
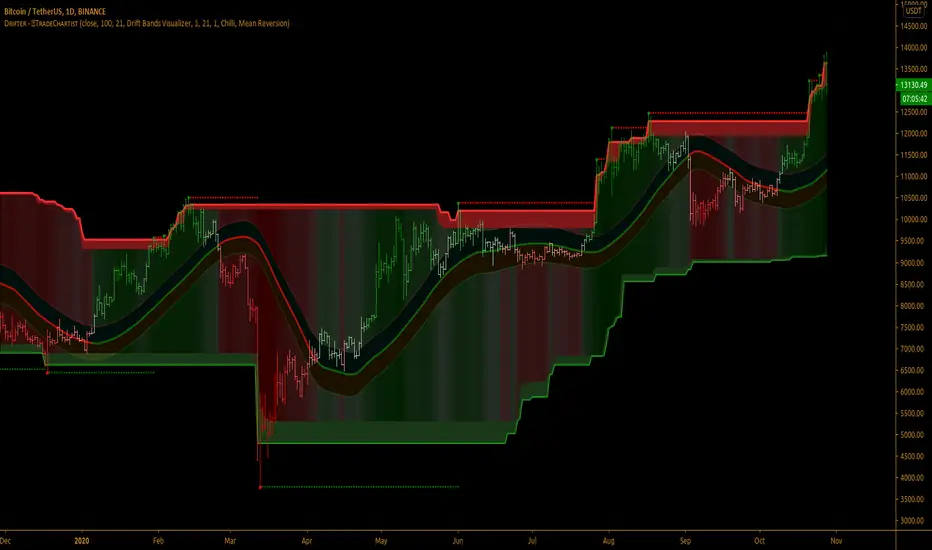
TradeChartist Drifter™𝗧𝗿𝗮𝗱𝗲𝗖𝗵𝗮𝗿𝘁𝗶𝘀𝘁 𝗗𝗿𝗶𝗳𝘁𝗲𝗿 is an adeptly designed, functional and a visual indicator that plots trend-following Support and Resistance walls by employing the concepts of Trend-based Support and Resistance, Momentum and Volatility, based on user defined lookback length, and includes three extremely useful Visualizers - Drift Bands Visualizer , Drift Strength Visualizer and Drifter AutoFibs Visualizer to help visualize the Price action in relation to the Support and Resistance Walls.
===================================================================================================================
™𝗧𝗿𝗮𝗱𝗲𝗖𝗵𝗮𝗿𝘁𝗶𝘀𝘁 𝗗𝗿𝗶𝗳𝘁𝗲𝗿 𝗨𝘀𝗲𝗿 𝗠𝗮𝗻𝘂𝗮𝗹
===================================
Concept of Drift
™TradeChartist Drifter combines concepts of Trend-based Support and Resistance, Momentum and Volatility to plot continuous Drifter Support and Resistance Walls that encloses the price action ( Drift ) within it (If the source price is price candle/bar based price like open,close,high,low,hl2,hl3 or ohlc4). In fact, these walls are generated by the price action ( Drift ) itself and helps the user see the price trend clearly as price makes higher highs/lows and lower highs/lows.
The Drifter walls are based on the user defined lookback length which can be changed in the Lᴇɴɢᴛʜ ғᴏʀ Dʀɪғᴛᴇʀ Wᴀʟʟs input box.
Drifter walls can be viewed or hidden by enabling or disabling 𝐒𝐡𝐨𝐰 𝐃𝐫𝐢𝐟𝐭𝐞𝐫 𝐖𝐚𝐥𝐥𝐬 .
Price Highs and Lows breaching the Drifter Walls can be viewed or hidden by enabling or disabling Sʜᴏᴡ Dʀɪғᴛᴇʀ Hɪɢʜs ᴀɴᴅ Lᴏᴡs .
Understanding and Visualizing ( Drift ) is important as it helps traders see the price action clearly. Price Volatility, Trend and Momentum are dependent on the period they are analysed. In order to visualize the drift, the user must enter the number of bars lookback in the Dʀɪғᴛ Lᴏᴏᴋʙᴀᴄᴋ input box.
===================================================================================================================
Three Types of Visualizers
One of the three types of Visualizers can be selected from Vɪsᴜᴀʟɪᴢᴇʀ Tʏᴘᴇ dropdown.
Drifter AutoFibs Visualizer is dependent on the Lᴇɴɢᴛʜ ғᴏʀ Dʀɪғᴛᴇʀ Wᴀʟʟs only as it fills the Drifter with Automatic Fibonacci Levels based on the distance between the Drifter Walls.
Drift Strength Visualizer is dependent on the Dʀɪғᴛ Lᴏᴏᴋʙᴀᴄᴋ only as it detects the Drift Strength based on Drift length. This Visualizer detects the Bull and the Bear zones based on the lookback. This helps visualize the Trend and Momentum clearly as the zones are filled with user selected theme based Bull and Bear colours.
Drift Bands Visualizer plots Drift Bands based on either Average True Range (ATR) or Standard Deviation along with the Bull or Bear Trend clearly shown using the color of the Mean or Basis line of the Drift Bands.
===================================================================================================================
╔═════════ 𝗗𝗿𝗶𝗳𝘁 𝗕𝗮𝗻𝗱𝘀 ══════════╗
Drift Bands are based on either ATR or Standard Deviation and consists of an Upper Band, a Lower Bands and a Mean or Basis Line. Drift Bands are extremely effective and highly useful in spotting the trend as the breakout from the upper or the lower band signals a change in the Drift based on the Dʀɪғᴛ Lᴏᴏᴋʙᴀᴄᴋ .
Note: The Mean or the Basis line of the Drift Bands depends only on the Dʀɪғᴛ Lᴏᴏᴋʙᴀᴄᴋ and Sᴏᴜʀᴄᴇ price. To plot Drift Bands based on external source, enable Usᴇ Sᴏᴜʀᴄᴇ Pʀɪᴄᴇ . The Width of the Bands is affected by ATR or Standard Deviation, based on the user preference.
ATR based Drift Bands
To plot ATR based Drift bands, enable 𝐀𝐓𝐑 𝐁𝐚𝐧𝐝𝐬 - Uɴᴄʜᴇᴄᴋ ғᴏʀ Sᴛᴀɴᴅᴀʀᴅ Dᴇᴠɪᴀᴛɪᴏɴ . ATR period is automatic. The ATR factor or the ATR multiplier can be changed in ATR Mᴜʟᴛɪᴘʟɪᴇʀ (ғᴏʀ ᴀᴛʀ ʙᴀsᴇᴅ ʙᴀɴᴅs (Default - 1, Min - 0.5, Max - 3). Higher ATR multiplier increases the width of the Drift Bands.
Note: In most cases, higher ATR multiplier of 2 or 3 increases Risk, but also results in increased Gains.
Standard Deviation based Drift Bands
To plot Standard Deviation bases Drift Bands, disable 𝐀𝐓𝐑 𝐁𝐚𝐧𝐝𝐬 - Uɴᴄʜᴇᴄᴋ ғᴏʀ Sᴛᴀɴᴅᴀʀᴅ Dᴇᴠɪᴀᴛɪᴏɴ . Both Sᴛᴀɴᴅᴀʀᴅ Dᴇᴠɪᴀᴛɪᴏɴ Lᴇɴɢᴛʜ (Default - 55, Min - 13) and Sᴛᴀɴᴅᴀʀᴅ Dᴇᴠɪᴀᴛɪᴏɴ Mᴜʟᴛɪᴘʟɪᴇʀ (Default - 1, Min - 0.236, Max - 2) affect the width of the Bands. Higher Standard Deviation Multiplier increases the Volatility of the Drift Bands.
Note: In most cases, higher Standard Deviation multiplier increases Risk, but also results in increased Gains.
Tip : To plot Bull and Bear Drift Zones, enable 𝐃𝐫𝐢𝐟𝐭 𝐙𝐨𝐧𝐞𝐬 𝐁𝐚𝐜𝐤𝐠𝐫𝐨𝐮𝐧𝐝 𝐅𝐢𝐥𝐥 and this can be used as Trade zones as this will be in sync with the trend colour of Mean line of the Drift Bands.
===================================================================================================================
╔═══════ 𝗗𝗿𝗶𝗳𝘁𝗲𝗿 𝗔𝗲𝘀𝘁𝗵𝗲𝘁𝗶𝗰𝘀 ═══════╗
There are two themes (Chilli and Flame) to choose from for the colour schemes of Drifter under 𝗗𝗿𝗶𝗳𝘁𝗲𝗿 𝗧𝗵𝗲𝗺𝗲 dropdown.
Dʀɪғᴛᴇʀ Bᴀᴄᴋɢʀᴏᴜɴᴅ Fɪʟʟ plots Bull and Bear strength based background fill between the Drifter walls. This is disabled for Drifter AutoFibs Visualizer .
There are two types of background fills namely, Mean Reversion and Trend Following and can be selected from Bᴀᴄᴋɢʀᴏᴜɴᴅ Fɪʟʟ Tʏᴘᴇ dropdown.
Enabling Dʀɪғᴛᴇʀ Cᴏʟᴏᴜʀ Bᴀʀs paints the price bars with the Drifter background fill.
Note: Trend Following fill is dependent on Dʀɪғᴛ Lᴏᴏᴋʙᴀᴄᴋ .
===================================================================================================================
Alerts
Alerts can be created for Long and Short entries by using Once Per Bar Close as Alert Frequency. Entries are generated on Real time bars based on Drift Bands Breakout conditions. It is recommended to wait for bar close before taking a position based on Drift Bands Trade Entries.
The indicator does not repaint and can be confidently used for alerts and trade entries without worrying about signals disappearing.
™TradeChartist Drifter can also be connected to ™TradeChartist Plug and Trade using 𝗗𝗿𝗶𝗳𝘁𝗲𝗿 𝗧𝗿𝗲𝗻𝗱 𝗜𝗱𝗲𝗻𝘁𝗶𝗳𝗶𝗲𝗿 as Oscillatory Signal to generate entries along with Targets, Stop Loss plots etc. Target and Stop Loss alerts can be created using Plug and Trade's Alerts system.
===================================================================================================================
There are several combinations of settings that can be tested on the security traded based on timeframe and risk/reward expectations. The indicator can be used for trade entries with various Drift Bands settings. Following are a few examples using the Drifter.
===================================================================================================================
Example Charts
1. SPX 1hr chart using Drifter AutoFibs Visualizer based on 100 period lookback for Drifter Walls.
2. SPX 1hr chart using Drift Strength Visualizer based on 100 period Drift Lookback.
3. SPX 1hr chart using 100 period ATR (Multiplier - 1) based Drift Bands Visualizer with Drift Zones Background Fill.
4. SPX 1hr chart using 50 period ATR (Multiplier - 1) based Drift Bands Visualizer with Drift Zones Background Fill.
5. SPX 1hr chart using 50 period Standard Deviation (Length - 21, Multiplier - 2) based Drift Bands Visualizer with Drift Zones Background Fill.
6. EUR-USD 1hr chart using 34 period ATR (Multiplier - 3) based Drift Bands Visualizer with Drift Zones Background Fill.
7. BTC-USD 5m chart using 34 period ATR (Multiplier - 3) based Drift Bands Visualizer connected to ™TradeChartist Intensity Equilibrium Line.
8. BTC-USD 5m chart using 34 period ATR (Multiplier - 3) based Drift Bands Visualizer connected to ™TradeChartist Intensity Equilibrium Line + Connected to ™TradeChartist Plug and Trade
===================================================================================================================
Best Practice: Test with different settings first using Paper Trades before trading with real money
===================================================================================================================
This is not a free to use indicator. Get in touch with me (PM me directly if you would like trial access to test the indicator)
Premium Scripts - Trial access and Information
Trial access offered on all Premium scripts.
PM me directly to request trial access to the scripts or for more information.
===================================================================================================================
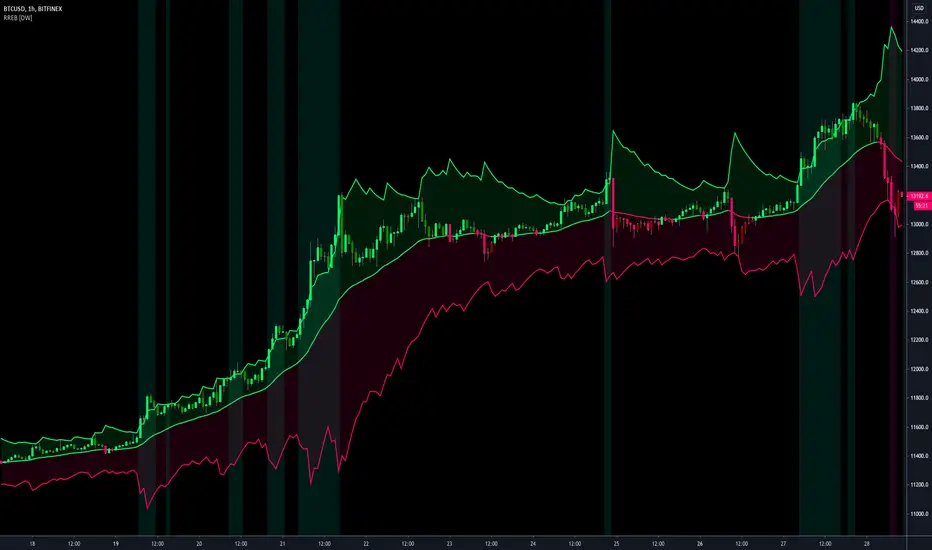
Resampling Reverse Engineering Bands [DW]This is an experimental study designed to reverse engineer price levels from centered oscillators at user defined sample rates.
This study aims to educate users on the process of oscillator reverse engineering, and to give users an alternative perspective on some of the most commonly used oscillators in the trading game.
Reverse engineering price levels from an oscillator is actually a rather simple, straightforward process.
Rather than plugging price values into a function to solve for oscillator values, we rearrange the function using some basic algebraic operations and plug in a specified oscillator value to solve for price values instead.
This process tells us what price value is needed in order for the oscillator to equal a certain value.
For example, if you wanted to know what price value would be considered “overbought” or “oversold” according to your oscillator, you can do that using this process.
In this study, the reverse engineering functions are used to calculate the price values of user defined high and low oscillator thresholds, and the price values for the oscillator center.
This allows you to visualize what prices will trigger thresholds as a sort of confidence interval, which is information that isn't inherently available when simply analyzing the oscillator directly.
This script is equipped with three reverse engineering functions to choose from for calculating the band values:
-> Reverse Relative Strength Index (RRSI)
-> Reverse Stochastic Oscillator (RStoch)
-> Reverse Commodity Channel Index (RCCI)
You can easily select the function you want to utilize from the "Band Calculation Type" dropdown tab.
These functions are specially designed to calculate at any sample rate (up to 1 bar per sample) utilizing the process of downsampling that I introduced in my Resampling Filter Pack.
The sample rate can be determined with any of these three methods:
-> BPS - Resamples based on the number of bars.
-> Interval - Resamples based on time in multiples of current charting timeframe.
-> PA - Resamples based on changes in price action by a specified size. The PA algorithm in this script is derived from my Range Filter algorithm.
The range for PA method can be sized in points, pips, ticks, % of price, ATR, average change, and absolute quantity.
Utilizing downsampled rates allows you to visualize the reverse engineered values of an oscillator calculated at larger sample scales.
This can be rather beneficial for trend analysis since lower sample rates completely remove certain levels of noise.
By default, the sample rate is set to 1 BPS, which is the same as bar-to-bar calculation. Feel free to experiment with the sample rate parameters and configure them how you like.
Custom bar colors are included as well. The color scheme is based on disparity between sources and the reverse engineered center level.
In addition, background highlights are included to indicate when price is outside the bands, thus indicating "overbought" and "oversold" conditions according to the thresholds you set.
I also included four external output variables for easy integration of signals with other scripts:
-> Trend Signals (Current Resolution Prices) - Outputs 1 for bullish and -1 for bearish based on disparity between current resolution source and the central level output.
-> Trend Signals (Resampled Prices) - Outputs 1 for bullish and -1 for bearish based on disparity between resampled source and the central level output.
-> Outside Band Signal (Current Resolution Prices) - Outputs 1 for overbought and -1 for oversold based on current resolution source being outside the bands. Returns 0 otherwise.
-> Outside Band Signal (Resampled Prices) - Outputs 1 for overbought and -1 for oversold based on resampled source being outside the bands. Returns 0 otherwise.
To use these signals with another script, simply select the corresponding external output you want to use from your script's source input dropdown tab.
Reverse engineering oscillators is a simple, yet powerful approach to incorporate into your momentum or trend analysis setup.
By incorporating projected price levels from oscillators into our analysis setups, we are able to gain valuable insights, make (potentially) smarter trading decisions, and visualize the oscillators we know and love in a totally different way.
I hope you all find this script useful and enjoyable!
Volume Bars and Regions of InterestThe bars are colored according to the volume traded. The volume weights were distributed logically for a better analysis.
<0.666 low volume
0.666 to 1.333 median volume
1,333 to 2,666 high volume
> 2,666 'institutional' volume
The moving average bands are the average of the highs and lows. They show a region of interest and not just a 'line'.

Ultimate VWAP Bands- Ultimate VWAP Bands is a script that helps to decide and further clarify areas of oversold and overbought conditions.
- For example, when the price is in the lowest band it is extremely oversold relative to the VWAP . Hence it should be considered a good place to buy with a high risk to reward payoff.
- Each band is set at a fixed offset away from the VWAP . The "VWAP Band Multiplier" adjusts this and is a key part of the script. This allows the indicator to be adjusted based on the assets volatility . For example, with Crypto. A multiplier of 1 would be strongly advised. Whilst a multiplier of 0.1-0.25 would be useful for currency pairs.
- This indicator can be used for all manners of trading. However, it is most effective when used for scalping and swing trading.

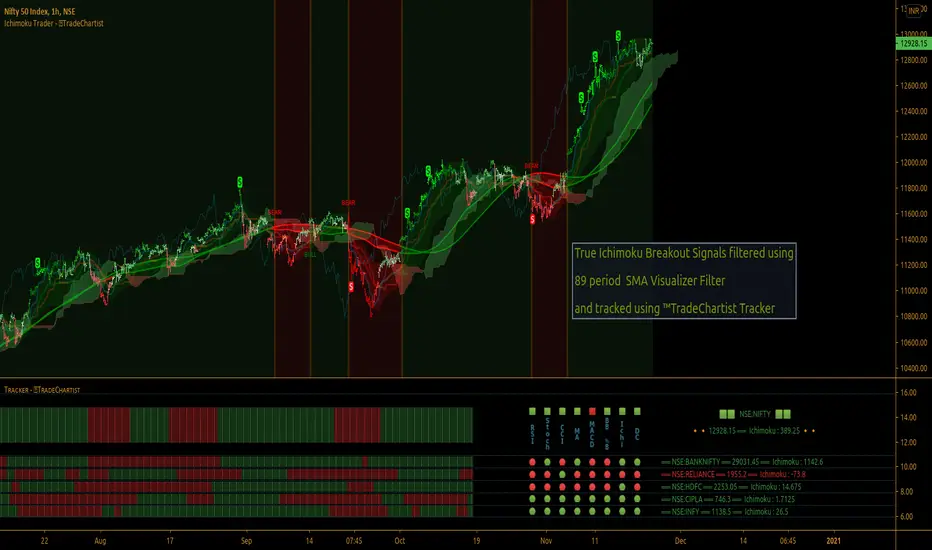
TradeChartist Ichimoku Trader ™TradeChartist Ichimoku Trader is an elegant and functional breakouts trading indicator that generates trade signals based on two types of breakouts - True Ichimoku Kumo Breakouts and Ichimoku Trade Bands Breakouts, which can be further filtered using ™TradeChartist MA Visualizer and/or using an external Filter.
===================================================================================================================
╔════════ 𝗖𝗹𝗼𝘂𝗱 𝗦𝗲𝘁𝘁𝗶𝗻𝗴𝘀 ═════════╗
Cloud Settings form the fundamental factor for this indicator to detect the breakouts. The settings for the Ichimoku Cloud is Automatic by default, but this can be changed based on the user preference from the settings under 𝐂𝐥𝐨𝐮𝐝 𝐓𝐲𝐩𝐞, which also includes a manual input option. Ichimoku traders can experiment different settings combinations under manual settings to suit their trading frequency and timeframe traded.
Ichimoku Cloud with its components can be displayed or hidden by enabling/disabling 𝐃𝐢𝐬𝐩𝐥𝐚𝐲 𝐈𝐜𝐡𝐢𝐦𝐨𝐤𝐮 𝐂𝐥𝐨𝐮𝐝. Also, Sʜᴏᴡ Iᴄʜɪᴍᴏᴋᴜ Cʀᴏssᴇs from the Cloud Settings plots tiny crosses on chart.
===================================================================================================================
╔═════════ 𝗕𝗮𝗻𝗱𝘀 𝗦𝗲𝘁𝘁𝗶𝗻𝗴𝘀 ════════╗
Even though the Ichimoku Trade Bands are derived from the Cloud Parameters, the Bᴀɴᴅ Wɪᴅᴛʜ (0.236 - 1) and Lᴏᴏᴋʙᴀᴄᴋ (5 - 200) influences the sensitivity and the width of the bands, which has an effect on the risk and reward expected from Ichimoku Trade Bands Breakout trade.
Trade Bands can be displayed or hidden by enabling/disabling 𝐃𝐢𝐬𝐩𝐥𝐚𝐲 𝐈𝐜𝐡𝐢𝐦𝐨𝐤𝐮 𝐓𝐫𝐚𝐝𝐞 𝐁𝐚𝐧𝐝𝐬. Also, the Bands mean line can be enabled or disabled using 𝐃𝐢𝐬𝐩𝐥𝐚𝐲 𝐓𝐫𝐚𝐝𝐞 𝐁𝐚𝐧𝐝𝐬 𝐌𝐞𝐚𝐧 𝐋𝐢𝐧𝐞 check box and its line width can be changed using Tʀᴀᴅᴇ Bᴀɴᴅs Mᴇᴀɴ Lɪɴᴇ Wɪᴅᴛʜ dropdown.
===================================================================================================================
╔═════════ 𝗠𝗔 𝗩𝗶𝘀𝘂𝗮𝗹𝗶𝘇𝗲𝗿 ═════════╗
MA Visualizer is a powerful and very useful original ™TradeChartist visual method to plot Moving Averages of the close price of the security for user specified look back period in a visually appealing style in the form of colour coded bands. MA Visualizer not only helps the trader spot the price action of the security relative to the moving average, but also paints a visual picture of the trend strength, which must be seen and used on chart to appreciate its elegance. One of 15 different types of Moving Averages can be used to visualize the price action.
Activate 𝗠𝗔 𝗩𝗶𝘀𝘂𝗮𝗹𝗶𝘇𝗲𝗿 and choose the MA type from MA Vɪsᴜᴀʟɪᴢᴇʀ Tʏᴘᴇ dropdown and entering the lookback period in MA Vɪsᴜᴀʟɪᴢᴇʀ ᴘᴇʀɪᴏᴅ input box. MA Visualizer colour theme can be be changed from MA Vɪsᴜᴀʟɪᴢᴇʀ Cᴏʟᴏʀ Sᴄʜᴇᴍᴇ dropdown.
The faster of the two set of bands that form the MA Visualizer reacts to price action faster and can be clearly seen from its change of colour from Bull Colour to Bear Colour or viceversa earlier than the slower set of bands. The fill colour between the bands also helps the user stay in a trade or exit a trade based on other confirmators.
===================================================================================================================
╔═══════ 𝗦𝗶𝗴𝗻𝗮𝗹𝘀 𝗮𝗻𝗱 𝗙𝗶𝗹𝘁𝗲𝗿𝘀 ═══════╗
Signal Type
True Ichimoku Kumo Breakout
Ichimoku traders mostly use the Kumo breakouts for trading based on several Bullish and Bearish conditions. For the sake of effective trade entries, trade entry plots for specific cloud events like Kumo twists, Tenkan Sen crossing Kijun Sen, price crossing cloud components etc have been intentionally ignored as Ichimoku traders often tend to visually trade them effectively.
Ichimoku Trade Bands Breakout
In addition to the True Kumo Breakouts, users of this script will be able to trade Ichimoku Trade Bands Breakouts. Ichimoku Trade Bands is an original ™TradeChartist model designed to detect early trend changes based on the Ichimoku settings. These bands are comprised of three plots - an upper band, a lower band and a mean line, namely and all are derived from the Ichimoku settings. The bands act as a filter and a breakout from bands' extreme boundaries signals a change in trend. The settings of the bands can be derived automatically or using manual input based on Ichimoku Cloud parameters, accessed from the indicator settings.
The Breakout Trade Entries can be further filtered by use of MA Visualizer or by using an external filter connected to the script.
===================================================================================================================
╔═════════ 𝗙𝗶𝗹𝘁𝗲𝗿 𝗦𝗲𝘁𝘁𝗶𝗻𝗴𝘀 ═════════╗
Filters are normally used to reduce noise in the Trade Entry Signals and they can be quite effective in helping the trader stay in trade and to minimize unproductive trade entries. Ichimoku Trader enables the user to use upto two trade filters - MA Visualizer and /or External Filter respectively.
Moving Averages are very effective trade filters and if the right Moving Average is used with right lookback period based on trade type and timeframe traded, they can be very effective in filtering trades.
Enabling 𝐔𝐬𝐞 𝐌𝐀 𝐕𝐢𝐬𝐮𝐚𝐥𝐢𝐳𝐞𝐫 𝐚𝐬 𝐓𝐫𝐚𝐝𝐞 𝐅𝐢𝐥𝐭𝐞𝐫 filters breakouts only when MA Visualizer agrees with the trend (which can be visualized using the fill colour between the MA Visualizer plots.
Enabling Fɪʟᴛᴇʀ Eᴀʀʟʏ Vɪsᴜᴀʟɪᴢᴇʀ Bʀᴇᴀᴋᴏᴜᴛs in addition filters breakouts even if price closed above the upper MA Visualizer plot without having to agree with fill colour.
In addition to MA Visualizer Filter, and external filter like RSI, MACD etc. can also be used by connecting to Ichimoku Trader under ╔═══ 𝗣𝗹𝘂𝗴 𝗙𝗶𝗹𝘁𝗲𝗿 𝗵𝗲𝗿𝗲 ═══ 🔌 dropdown by enabling 𝐔𝐬𝐞 𝐄𝐱𝐭𝐞𝐫𝐧𝐚𝐥 𝐅𝐢𝐥𝐭𝐞𝐫 𝐚𝐬 𝐓𝐫𝐚𝐝𝐞 𝐅𝐢𝐥𝐭𝐞𝐫. The external filter can be used as the only filter or in addition to MA Visualizer filter.
To get the external filter to work, Sɪɢɴᴀʟ Tʏᴘᴇ must be set right. For plots that are not oscillatory like Moving Averages, Super Trend etc., choose type as Non Oscillatory and for Oscillators like RSI, CCI, MACD etc., choose type as Oscillatory .
For Oscillators, levels must be specified for Fɪʟᴛᴇʀ Lᴇᴠᴇʟ ғᴏʀ ʟᴏɴɢs and Fɪʟᴛᴇʀ Lᴇᴠᴇʟ ғᴏʀ sʜᴏʀᴛs , especially if the Oscillator doesnt have 0 as mid line, like RSI. Even for 0 mid oscillators like CCI, filter levels like 100/-100 work effectively to filter noise.
Use 𝐓𝐫𝐚𝐝𝐞 𝐙𝐨𝐧𝐞𝐬 𝐁𝐚𝐜𝐤𝐠𝐫𝐨𝐮𝐧𝐝 𝐅𝐢𝐥𝐥 under 𝗨𝘀𝗲𝗳𝘂𝗹 𝗘𝘅𝘁𝗿𝗮𝘀 to paint the trade zones background. It helps visually see the effect of filters on the breakout entries and also the trade performance.
===================================================================================================================
╔═════════ 𝗨𝘀𝗲𝗳𝘂𝗹 𝗘𝘅𝘁𝗿𝗮𝘀 ═════════╗
Ichimoku Trader also includes the following useful extras
𝐓𝐫𝐚𝐝𝐞 𝐙𝐨𝐧𝐞𝐬 𝐁𝐚𝐜𝐤𝐠𝐫𝐨𝐮𝐧𝐝 𝐅𝐢𝐥𝐥 paints the trade zones in green and red as mentioned above.
Sʜᴏᴡ Hɪɢʜs ᴀɴᴅ Lᴏᴡs plots the highest highs of the Bull Zone and the lowest lows of the Bear Zone to help spot the wicks, support and resistance.
Tᴀᴋᴇ Pʀᴏғɪᴛ Bᴀʀs helps detect the volatility exhaustion prices and plots $ signs to help the trader take profits or move stop loss levels to secure gains or to reduce losses.
Vɪsᴜᴀʟɪᴢᴇʀ Cᴏʟᴏʀ Bᴀʀs paints the price bars with trend intensity and the user can opt from one of two themes under Bᴀʀ Cᴏʟᴏʀ Sᴄʜᴇᴍᴇ (Chilli and Flame).
The bar colors can be inverted by enabling Iɴᴠᴇʀᴛ Bᴀʀ Cᴏʟᴏʀs to see reverse bias with respect to the current trade direction.
===================================================================================================================
╔═════════ 𝗔𝗹𝗲𝗿𝘁𝘀 ═════════╗
Alerts can be created for Long and Short entries by using Once Per Bar Close as Alert Frequency. Entries are generated on Real time bars based on Breakout and filter conditions. It is recommended to wait for bar close before taking a position based on Ichimoku Trader Trade Entries.
The indicator does not repaint and can be confidently used for alerts and trade entries without worrying about signals disappearing.
™TradeChartist Ichimoku Trader 𝗧𝗿𝗲𝗻𝗱 𝗜𝗱𝗲𝗻𝘁𝗶𝗳𝗶𝗲𝗿 can also be connected to ™TradeChartist Plug and Trade to generate entries along with Targets, Stop Loss plots etc. Target and Stop Loss alerts can be created using Plug and Trade's Alerts system.
===================================================================================================================
There are several combinations of settings that can be tested on the security traded based on timeframe and risk/reward expectations. The indicator can be used for trade entries with filter combinations or can be used as standalone Visualizer for trend confirmations, levels etc. Following are a few examples using the Visualizer.
╔════════ 𝗘𝘅𝗮𝗺𝗽𝗹𝗲 𝗖𝗵𝗮𝗿𝘁𝘀 ════════╗
1. BTC-USDT 1hr True Ichimoku Kumo Breakout with no filters.
2. BTC-USDT 1hr Ichimoku Trade Bands (Default) Breakout with no filters.
3. BTC-USDT 1hr Ichimoku Trade Bands (Default) Breakout using 200 period Hull MA Visualizer filter.
4. AAPL 4hr Ichimoku Trade Bands (Default) Breakout using 200 period VIDYA MA Visualizer filter. Note: VIDYA is normally used for long term trades.
5. GBP-USD 5m True Ichimoku Kumo Breakout using 144 period TEMA MA Visualizer filter and Money Flow Index connected as external filter with 80/20 Filter values.
6. XAU-USD 1hr Ichimoku Trade Bands (Default) Breakout using 144 period TEMA MA Visualizer and Keltner Channels basis line as external non-oscillatory filter, connected to ™TradeChartist Plug and Trade using Ichimoku Trader 𝗧𝗿𝗲𝗻𝗱 𝗜𝗱𝗲𝗻𝘁𝗶𝗳𝗶𝗲𝗿.
7. SHITPERP 1hr Ichimoku Trade Bands (0.618 Band Width and Lookback 89 periods) using 50 period Zero-Lag EMA Visualizer Filter.
===================================================================================================================
Best Practice: Test with different settings first using Paper Trades before trading with real money
===================================================================================================================
This is not a free to use indicator. Get in touch with me (PM me directly if you would like trial access to test the indicator)
Premium Scripts - Trial access and Information
Trial access offered on all Premium scripts.
PM me directly to request trial access to the scripts or for more information.
===================================================================================================================
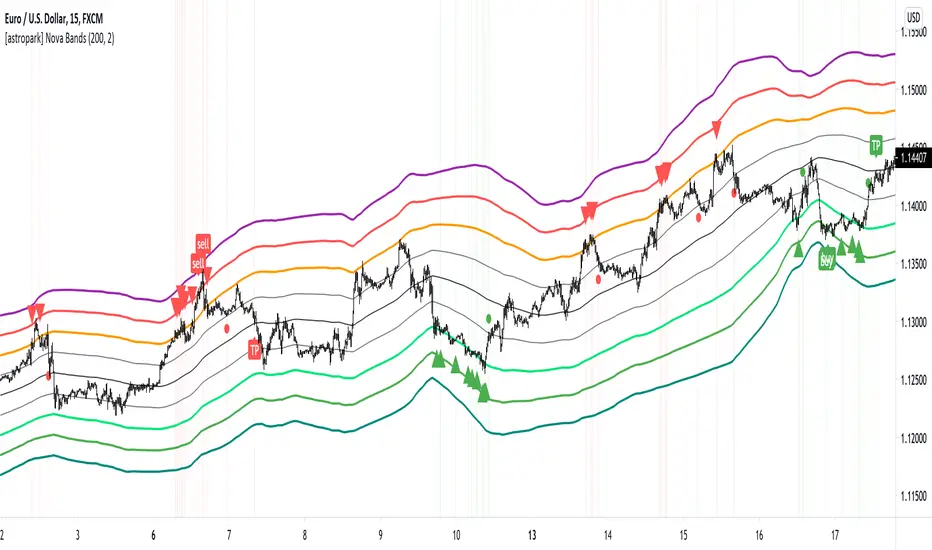
[astropark] Nova BandsDear followers,
today a new analysis and scalping tool for day trading on low timeframes (5-15 minutes) or to plan swing trades on hourly timeframes. It can be used also on high timeframes just for analysis current market trend.
The indicator plots a series of levels which create a nice bands flow.
The slope of levels make you easily understand when price is in consolidation, in uptrend or in downtrend.
The golden rule is always the same: buy low and sell high .
This indicator plots:
3 "price is low here" levels (from dark green to light green)
3 "price is average here" levels
3 "price is high here" levels (from purple to orange)
When bands are flat, price is in consolidation and this is best condition to trade with nova bands.
When price reaches higher bands, you will open a short position with targets below levels, fully closing your position when price hits the average level (black).
Here an example on Bitcoin on 15m using 1h resolution:
The same applies when price reaches lower bands, you will open a long position with targets above levels, fully closing your position when price hits the average level (black).
When bands get nearer and nearer is called "Bands Squeeze": price is next to a main breakout move, volatility is coming!
Here an example of SPX500: after long consolidation and bands getting nearer and neared, we had the breakout, downwards in this case.
In this screenshot you can see what signals algorithm provided:
Our suggestion is to play safe these kind of scenarios, no reason to FOMO buy/sell. Just wait for price consolidation / getting back inside the bands.
For example you would have skip first three buy signals, while you would have longed the last two as price came back inside bands after the big volatility which made price went below bands.
Another example is TSLA stock on 15m with 1h resolution:
Price touched the first bullish level and made a big move upwards, breaking bands with a +90% move.
In this case, you would have skipper first 2 sell signals, while you would have accepted next two with stoploss above recent high.
Acceptable also the other two sell signals, which you may have closed when price retraced to lower levels:
You can of course run trends like this buying on price hitting bullish/lower levels after a long consolidation and sell on price hitting middle and higher levels:
A trader who wants to be a winner must understand that money and risk management are very important, so manage your position size and always have a stop loss in your trades.
Here some examples how the indicator works on different markets:
EURUSD 15m with standard settings and 1h resolution
GOLD (XAUUSD) 15m with standard settings and 1h resolution
Facebook (FB) 15m with standard settings and 1h resolution
This is a premium indicator , so send me a private message in order to get access to this script.
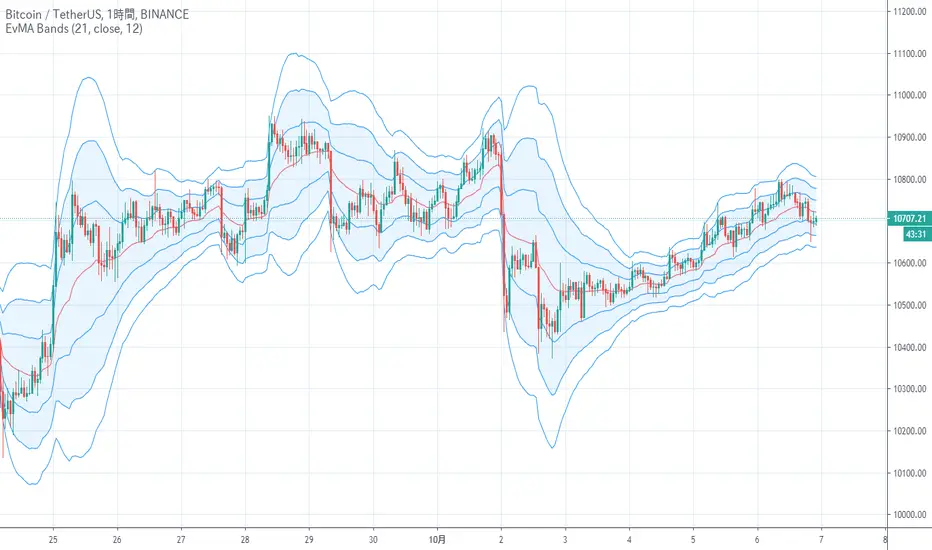
EvMA BandsIt is an index that looks like the final evolution by weighting the Bollinger band with exponential smoothing and volume.
The base Line is my EvMA as volume weighted EMA, so it is quite responsive.
The standard deviation is also exponentially smoothed, and the reaction is too good to handle, so it is further smoothed by EMA.
Charts without volume are not weighted with volume as 1.
It seems that the usage in trading is the same as the Bollinger band
ボリンジャーバンドを指数平滑出来高加重し、最終進化したような指標です
中央線は拙作のEvMAで出来高加重EMAなのでかなり反応が良いです
標準偏差も指数平滑出来高加重して反応が良すぎて扱いにくいのでさらにEMAで平滑化しています
出来高の無いチャートは出来高を1として加重しないようにしています
トレードでの使い方はボリンジャーバンドと同じで良いと思われます
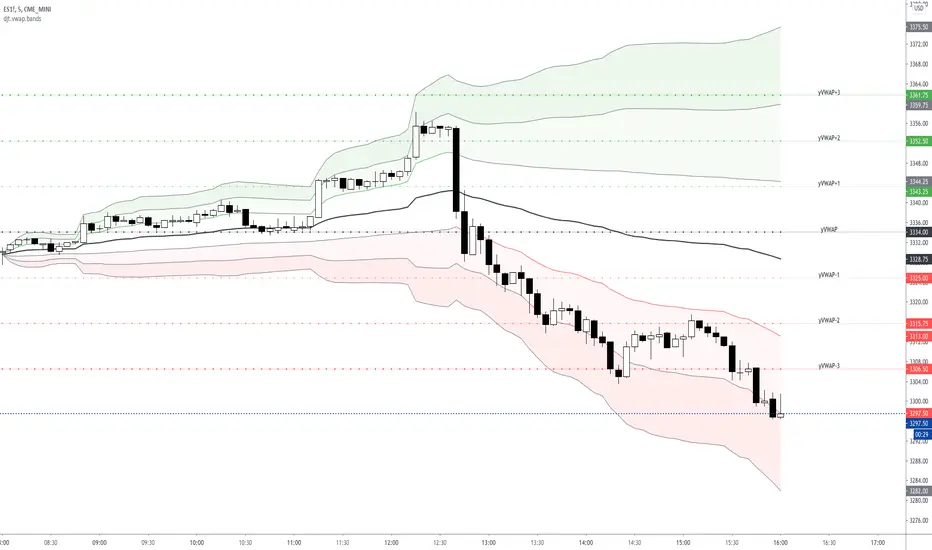
VWAP Standard Deviation Bands w/History & LabelsThis is my bread and butter when trading futures .
- 3 Standard Deviation Bands (Above and Below)
- Yesterday's VWAP and Band Levels
- Labels to help keep track of levels
- Ability to define resolution (I use Daily for my intraday scalping and Weekly/Monthly for context)
EMA Keltner Channel 1D100/200 EMAs, along with Keltner Bands based off them. Colors correspond to actions you should be ready to take in the area. Use to set macro mindset.
Uses the security function to display only the 1D values.
Red= Bad
Orange = Not as Bad, but still Bad.
Yellow = Warning, might also be Bad.
Purple = Dip a toe in.
Blue = Give it a shot but have a little caution.
Green = It's second mortgage time.
Combo Backtest 123 Reversal & Fractal Chaos Bands This is combo strategies for get a cumulative signal.
First strategy
This System was created from the Book "How I Tripled My Money In The
Futures Market" by Ulf Jensen, Page 183. This is reverse type of strategies.
The strategy buys at market, if close price is higher than the previous close
during 2 days and the meaning of 9-days Stochastic Slow Oscillator is lower than 50.
The strategy sells at market, if close price is lower than the previous close price
during 2 days and the meaning of 9-days Stochastic Fast Oscillator is higher than 50.
Second strategy
Stock market moves in a highly chaotic way, but at a larger scale, the movements
follow a certain pattern that can be applied to shorter or longer periods of time
and we can use Fractal Chaos Bands Indicator to identify those patterns. Basically,
the Fractal Chaos Bands Indicator helps us to identify whether the stock market is
trending or not. When a market is trending, the bands will have a slope and if market
is not trending the bands will flatten out. As the slope of the bands decreases, it
signifies that the market is choppy, insecure and variable. As the graph becomes more
and more abrupt, be it going up or down, the significance is that the market becomes
trendy, or stable. Fractal Chaos Bands Indicator is used similarly to other bands-indicator
(Bollinger bands for instance), offering trading opportunities when price moves above or
under the fractal lines.
The FCB indicator looks back in time depending on the number of time periods trader selected
to plot the indicator. The upper fractal line is made by plotting stock price highs and the
lower fractal line is made by plotting stock price lows. Essentially, the Fractal Chaos Bands
show an overall panorama of the price movement, as they filter out the insignificant fluctuations
of the stock price.
WARNING:
- For purpose educate only
- This script to change bars colors.

Combo Strategy 123 Reversal & Fractal Chaos Bands This is combo strategies for get a cumulative signal.
First strategy
This System was created from the Book "How I Tripled My Money In The
Futures Market" by Ulf Jensen, Page 183. This is reverse type of strategies.
The strategy buys at market, if close price is higher than the previous close
during 2 days and the meaning of 9-days Stochastic Slow Oscillator is lower than 50.
The strategy sells at market, if close price is lower than the previous close price
during 2 days and the meaning of 9-days Stochastic Fast Oscillator is higher than 50.
Second strategy
Stock market moves in a highly chaotic way, but at a larger scale, the movements
follow a certain pattern that can be applied to shorter or longer periods of time
and we can use Fractal Chaos Bands Indicator to identify those patterns. Basically,
the Fractal Chaos Bands Indicator helps us to identify whether the stock market is
trending or not. When a market is trending, the bands will have a slope and if market
is not trending the bands will flatten out. As the slope of the bands decreases, it
signifies that the market is choppy, insecure and variable. As the graph becomes more
and more abrupt, be it going up or down, the significance is that the market becomes
trendy, or stable. Fractal Chaos Bands Indicator is used similarly to other bands-indicator
(Bollinger bands for instance), offering trading opportunities when price moves above or
under the fractal lines.
The FCB indicator looks back in time depending on the number of time periods trader selected
to plot the indicator. The upper fractal line is made by plotting stock price highs and the
lower fractal line is made by plotting stock price lows. Essentially, the Fractal Chaos Bands
show an overall panorama of the price movement, as they filter out the insignificant fluctuations
of the stock price.
WARNING:
- For purpose educate only
- This script to change bars colors.

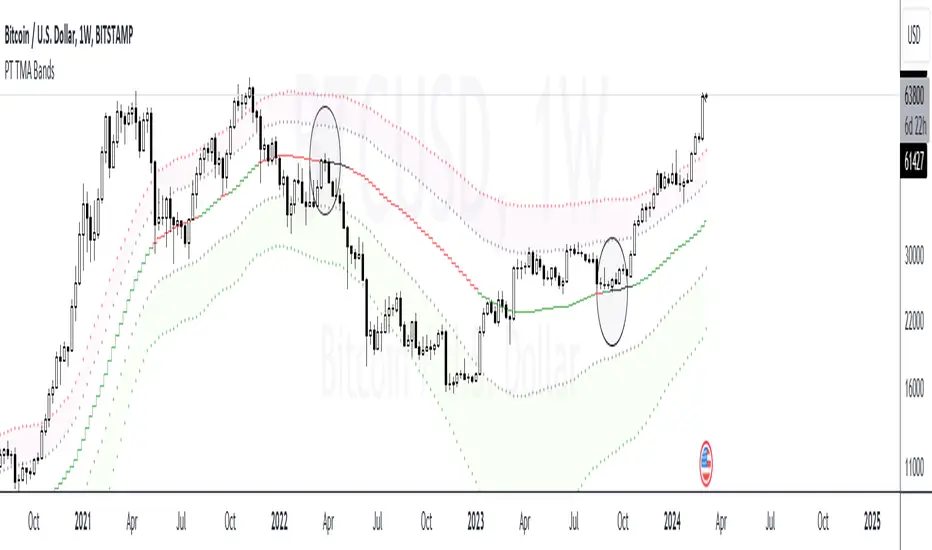
PT TMA BandsVersion 1.0 of our TMA Bands is a visual of areas of interest. The purpose of this indicator is to determine where the price will likely bounce or reject. When an asset is ranging, it very well respects the neutral (middle) zone. The highest RR trade setups are when the price goes from one end of the bands to another.
The bands included are of an ATR multiplier based on multiple moving averages. Each moving average has a unique feature that offers a high probability reaction when price gravitates towards it. We have color-coordinated the bands into three zones. The Main zone being the middle area where the asset tends to play ping pong & range, Top zone, which offers the best RR for shorts & the bottom zone, which provides the best RR for longs.
Strategy:
When scalping or swinging, always look for shorts close to the red zone as possible with a stop loss above the red band. When longing, always look for longs close to the green zone area with a stop loss below the green band. Anything in orange is a neutral zone, which will confirm the asset is more than likely ranging. I don’t advise taking trades in that zone unless you have solid risk management. When playing the macros, H12+ always look for price to find support at the orange (middle) band before deciding on a shift in trend. If the asset breaks down from the orange (middle) band, you usually get a retest of that band before further downside. Also, something to consider, if you punt longs at the green zone, you want to target the orange (middle) band. If you punt shorts at the red zone, you want to target the orange (middle) band. I usually take 70% off at the middle band & let the rest run if ultimately end up in the opposite zone.
This Oscillator is best with the buy/sell signals we provide. It offers extra confluence with stop loss & targets. I enjoy using it on all time frames for swinging & scalping. It is included as part of the library. Just message us for access!

CS PSAR EVWMA ATR Bands This indicator displays a trend line by feeding a Parabolic SAR into an Exponential Volume Weighted Moving Average.
This trend line is then used with the ATR to display 4 bands indicating trend direction and potential reversals in price.

Adaptive Bollinger BandsThis is part 3 of 11 in the system named Ninetales/Volt V2 you can find on Tradingview.
It simply measures all of the combinations of the defined parameters for Bollinger Bands, and returns the most logically accurate values.
Use it however you would use standard Bollinger Bands, just add your preferred values to test against each other, and set the period you would like for it to backtest.

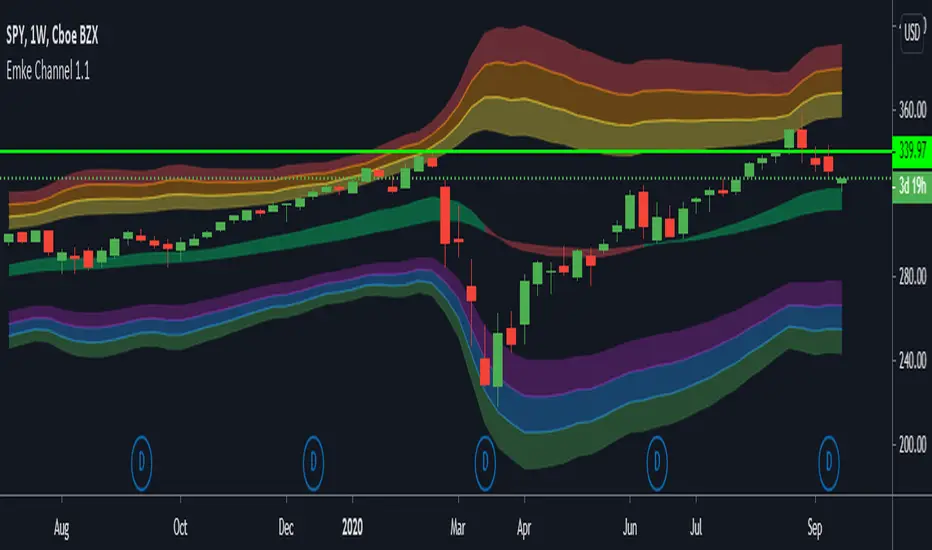
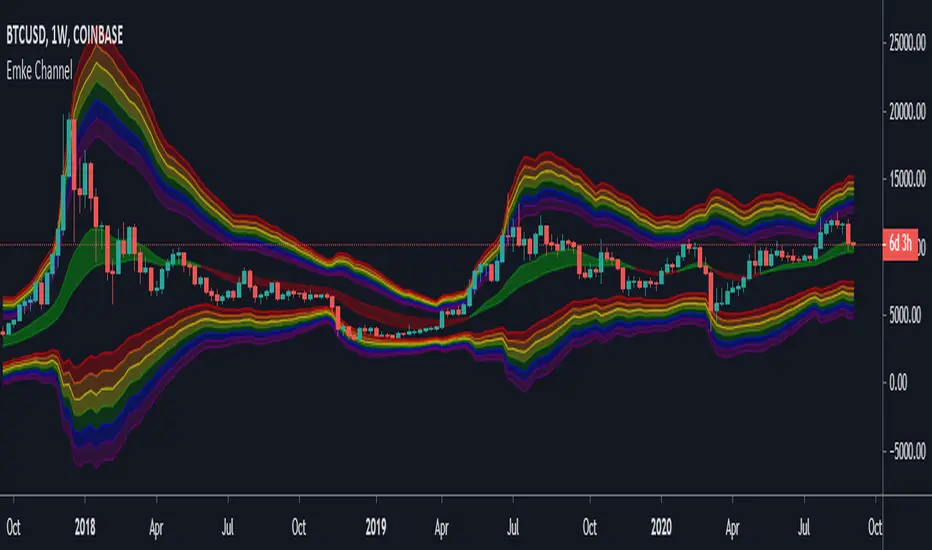
Emke ChannelThis is a slightly modified Keltner Channel with 100/200 EMAs.
Based on mean reversion theory that price will be more and more difficult to maintain it's direction the farther it gets from the EMAs.
It uses the security feature to only show the 1D channel.
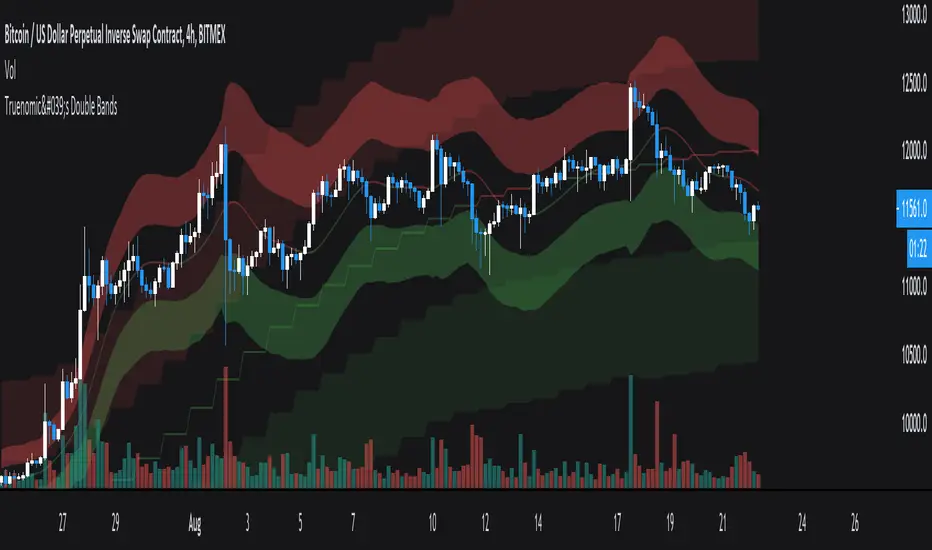
Truenomic's Double BandsThis is a fairly simple indicator based on the modernized moving average and ATR. These bands are relevant not only in the range, but also with a long-term trend.
I have personally used this in my trading system for a long time.
HeatbandsWhat you see is the 100 day moving average (blue line in the middle) with percentage bands attached to it.
Each color has a 5% range.
The brightest green color is 20%-25% below the 100 day moving average.
The brightest red color is 20%-25% above the 100 day moving average.
The behaviour of the stock price between the bands could give you trading ideas.
The moving average length is adjustable.
The range between the bands is not adjustable (maybe in future updates).
Enjoy:)

Awesome Trend BandsHere I propose another band indicator, it is tuned to consider volatility expansion and compression, average possible movement, and RSI position to identify dominant sentiment in the market.
When you should go long that center band line will be colored lime when you are to enter shorts it will be red, this signal is great for trading both trending and contracting markets, so you can even trade mean reversion, it catches good moves.
And the best thing of all, it works on all markets/instruments and timeframes- without any inputs from the user.
Here are some charts>
Past performance is not an assurance of future performance, author is not responsible for your profit or loss.
Enjoy~

Market ExtremitiesHere I'm proposing an indicator to measure market extremities, it is different than usually used STDv function and has a much simpler underlying mechanism. However, what you will compromise by it is that it is not going to work efficiently like STDv and you will need to use some form of trend and momentum indicators along with it. Not efficiently doesn't mean not tradable, in fact, this is what I use over STEDv myself to reduce the noise of Bollinger Bands.
This indicator is only designed to catch the highs and lows of the market during intraday. It works across all markets and it is surprisingly good at it and has certain predictive nature since the price seems to hang around the extreme lines. Having said that, an astute trader can trade this for both breakouts and mean reversion strategies.
For reference here is one chart marked
This is for educational purpose only-
Past performance is no indicator of future success and author takes no responsibility for the trader's actions.
Enjoy~

Setup Trend Following Bollinger Bands - ValenteBuy when the candle closes above upper BB
Sell when the candle closes bellow lower BB
Stop always on base line
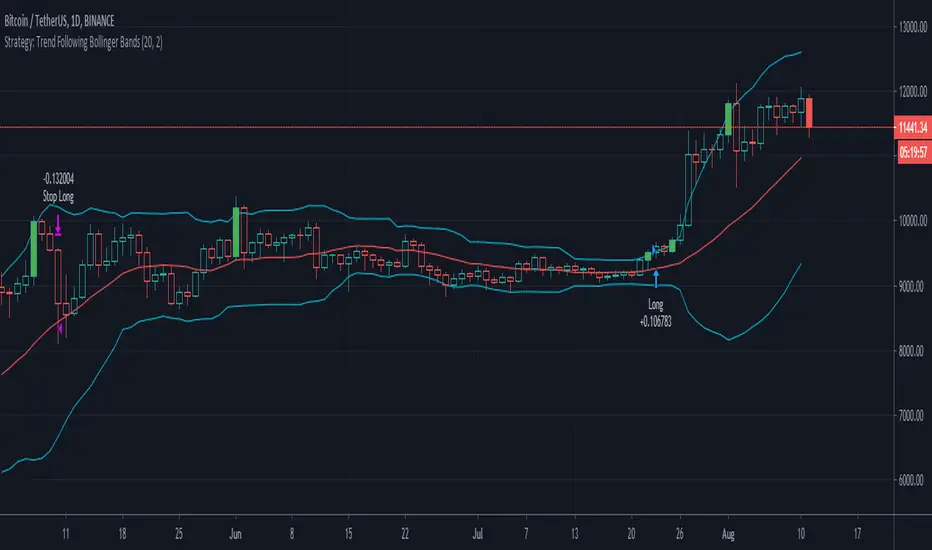
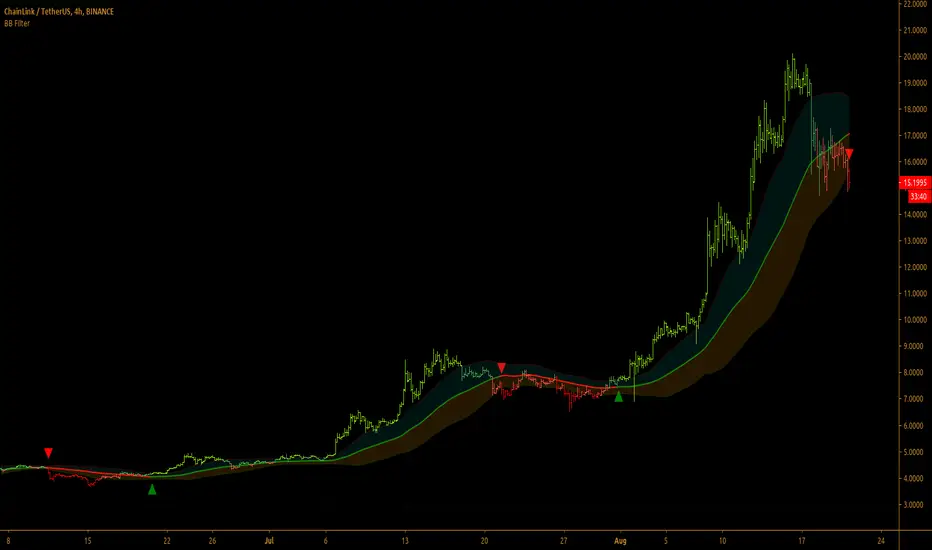
Bollinger Bands Filter
Bollinger Bands is a classic indicator that uses a simple moving average of 20 periods, along with plots of upper and lower bands that are 2 standard deviations away from the basis line. These bands help visualize price volatility and trend based on where the price is, in relation to the bands.
Bollinger Bands filter plots a long signal when price closes above the upper band and plots a short signal when price closes below the lower band. It doesn't take into account any other parameters such as Volume/RSI/ Fundamentals etc, so user must use discretion based on confirmations from another indicator or based on fundamentals.
The filter works great when the price closes above/below upper/lower bands with continuation on next bar. It is definitely useful to have this filter along with other indicators to get early glimpse of breach/fail of bands on candle close during BB squeeze or based on volatility.
This can be used on Heikin Ashi candles for spotting trends, but HA candles are not recommended for trade entries as they don't reflect true price of the asset.
This filter's default is 55 SMA and 1 standard deviation, but these can be changed from settings.
It is definitely worth reading the 22 rules of Bollinger Bands written by John Bollinger.
==================================================================
Note:
1. Alerts can be created for long and short signals using "Once per bar close".
2. The indicator doesn't repaint.
==================================================================