Super Guppy MMA [MFWIC]I compiled the new and improved Guppy Multiple Moving Averages. Hope it has some value. Plan your trade and trade your plan!
Averages

Easy Multiple Moving AveragesFor easy one on/off clicking. Don't waste your time clicking multiple times.

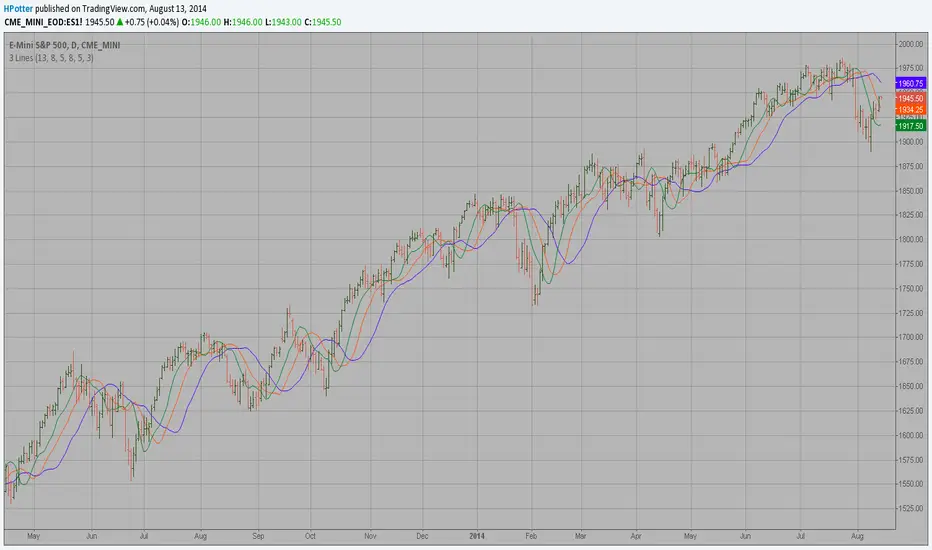
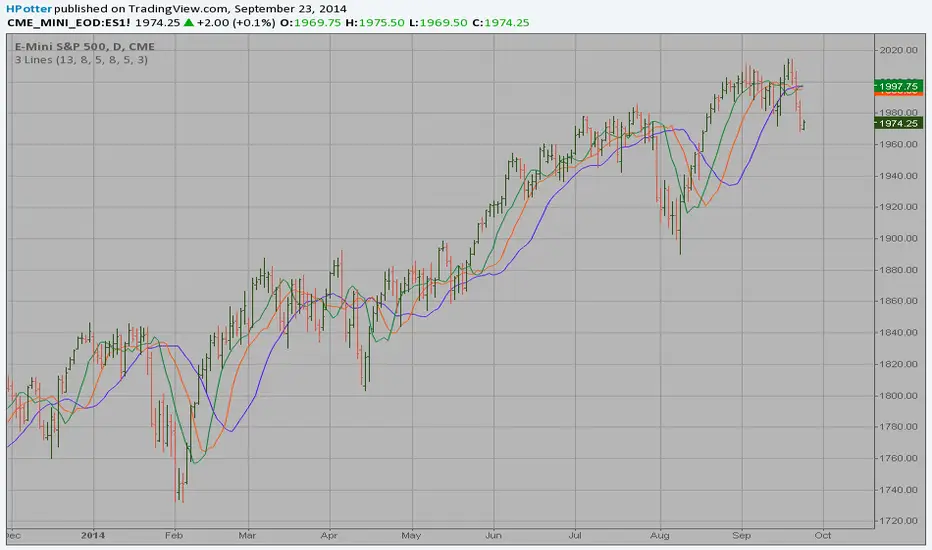
Bill Williams Averages. 3Lines Backtest This indicator calculates 3 Moving Averages for default values of
13, 8 and 5 days, with displacement 8, 5 and 3 days: Median Price (High+Low/2).
The most popular method of interpreting a moving average is to compare
the relationship between a moving average of the security's price with
the security's price itself (or between several moving averages).

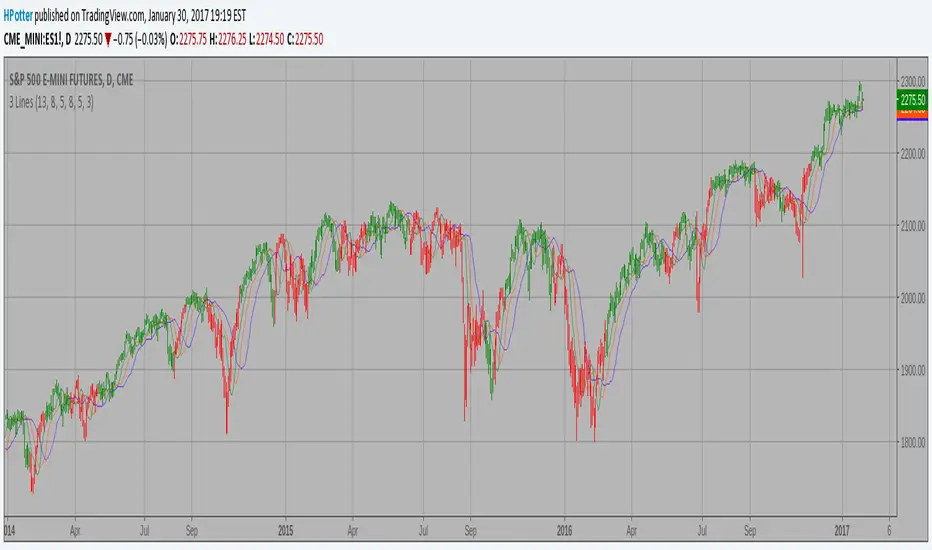
Bill Williams Averages. 3Lines Strategy This indicator calculates 3 Moving Averages for default values of
13, 8 and 5 days, with displacement 8, 5 and 3 days: Median Price (High+Low/2).
The most popular method of interpreting a moving average is to compare
the relationship between a moving average of the security's price with
the security's price itself (or between several moving averages).
B3 Edge TrailB3 Edge Trail is similar to a SuperTrend or ATR stopline system. It is based on the average of the highs and lows, and when back-broken, the binary bias flips. Simple as pie to use, just set your input to whatever suits your chart. The more "bars back" length the less flipping, then if you lower that input number it will result in an increase in sensitivity.
Enjoy, and now that TradingView has made it easy to do, I will be offering access to the strategies I have made based on my indicators. These will be available on the web eventually.
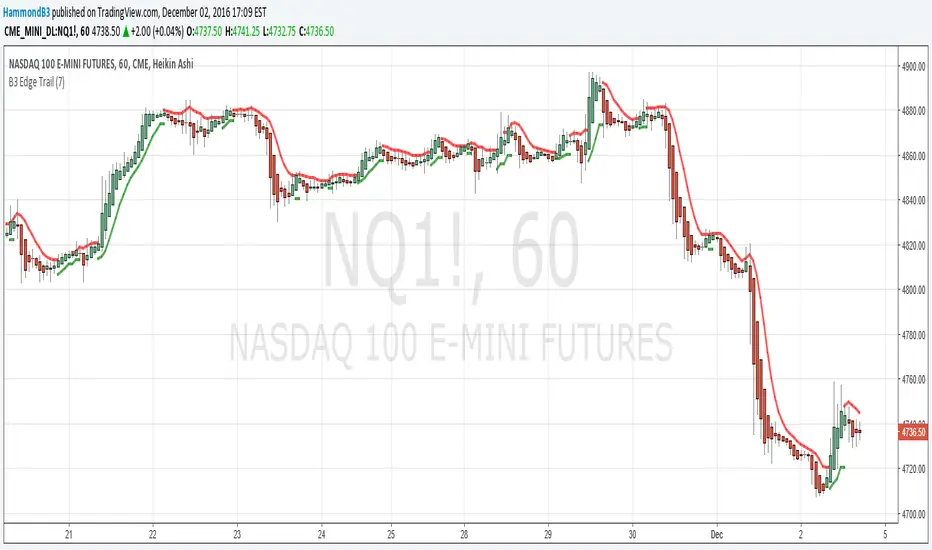
B3 High-Low Trail-TraderSimilar to SuperTrend or the ATR trailing stop lines that are common-place in chart indicator circles, the B3 High-Low Trail-Trader works as a back-break line to flip binary long and short biasing. Here is the strategy set to 7 bars back. You can find this style of trading system in several books, and there are many ways to come to the trailing stop line, so I imagine the bars back length can be slid around to suit certain charts. This happens to be my favorite trailing line.

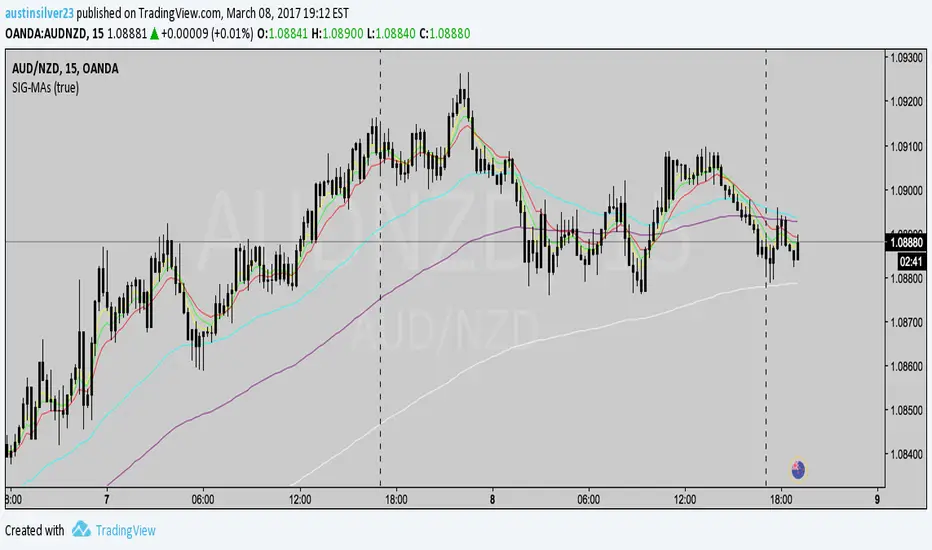
Bill Williams Averages SMMA This indicator calculates 3 Smoothed moving average for default values of
13, 8 and 5 days, with displacement 8, 5 and 3 days.
The most popular method of interpreting a moving average is to compare
the relationship between a moving average of the security's price with
the security's price itself (or between several moving averages).
Bill Williams Averages This indicator calculates 3 Moving Averages for default values of
13, 8 and 5 days, with displacement 8, 5 and 3 days: Median Price (High+Low/2).
The most popular method of interpreting a moving average is to compare
the relationship between a moving average of the security's price with
the security's price itself (or between several moving averages).