Macro Directional IndexCore to this indicator is the rate at which DI+ and DI- are moving away or towards each other. This is called The Rate of Change (ROC). The ROC length dictates how many bars back you want to compare to the current bar to see how much it has changed. It is calculated like this:
(source - source /source ) * 100
This indicator has 4 values in the status line:
DI+
DI-
Distance between DI+ and DI-
DI Rate of Change
DI Rate of Change
The rate of change is smoothed using an EMA. A shorter EMA length will cause the ROC to flip back and forth between positive and negative while a larger EMA length will cause the ROC to change less often. "Since the rate of change is used to indicate periods of 'consolidation', you want to find a setting that doesn't flip back and forth too often.
Directional Index Middle Channel
Between the DI+ and DI- is a black centerline. Offset from this centerline is a channel that is used to filter out false crosses of the DI+ and DI-. Sometimes, the DI+ and DI- lines will come together in this channel and cross momentarily before resuming the direction prior to the cross. When this happens, you don't want to flip your bias too soon. The wider the channel, the later the indicator will signal a DI reversal. A narrower channel will call it sooner but risks being more choppy and indicating a false cross."
Ortalama Yönsel Endeks (ADX)
Alpha ADX DI+/DI- V5 by MUNIF SHAIKHMODIFIED ADX DI+/DI- V5
Usage: To use this indicator for entry: when DMI+ crosses over DMI-, there is a bullish sentiment, however ADX also needs to be above 25 to be significant, otherwise the move is not necessarily sustainable.
Inversely, when DMI+ crosses under DMI- and ADX is above 25, then the sentiment is significantly bearish , but if ADX is below 20, the signal should be disregarded.
The line control represents, if the ADX is greater than the line of 25, the price trend is considered strong

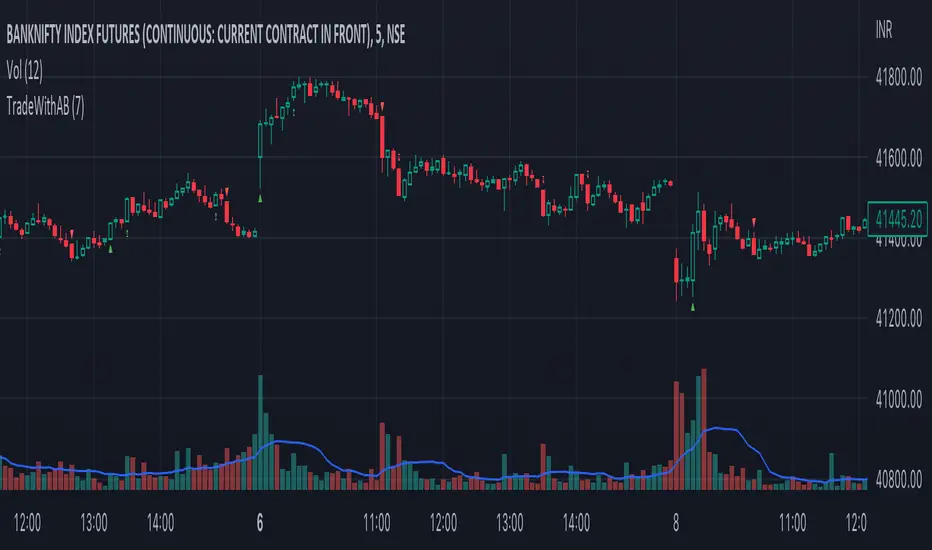
TradeWithAB SignalsThis indicator specifically designed for Momentum trading by an Intraday trader on index( Nifty , BankNifty ) and Equity stocks. This indicator works with DMI and PRICE ACTIONS which gives automated Buy and Sell signals along with Stop loss and Trailing Stop loss when certain criteria are met. It is not a Holy Grail system that gives you continuous profits and it has some limited downfalls also which can be controlled by proper risk Management and position sizing. This is a premium invite only indicator which can be use after given access to you by us. There are some guidelines on how to use this indicator which are given below and you have to follow these guidelines very strictly to get the maximum results.
Guidelines :-
1. Default Timeframe - 5 min
2. You have to take almost all the trade generated by this indicator on a particular stock/index for better results.
3. Signal confirmation is required for enter the trade as it will give you maximum profits.
4. GREEN TRIANGLE is represented as BUY Signal whereas RED TRIANGLE is represented as SELL Signal.
5. GREEN ARROW is considered as BUY TRAILING STOP LOSS as well as BUY RE-ENTRY for some scenarios.
6. RED ARROW is considered as SELL TRAILING STOP LOSS and SELL RE-ENTRY for some scenarios.
7. Ignore the signals(if any) of 1st candle(9:15)and last candle(3:25)of the day for better results.
BUY Trade Management :-
1. Trade should be initiated if and only if there is a buy signal(Green Triangle) is generated.
2. You should only enter the trade at the CLOSE of the signal generated candle.
3. Your Stop loss should be placed at the LOW of the signal generated candle.
4. There is a trailing Stop loss signal (Green Arrow) after the buying signal is generated.
5. You should trail your Stop loss at the LOW of the trailing Stop loss signal generated candle.
6. You should trail your Stop loss repeatedly until your trailing Stop loss got hit and hence Exit your buy trade.
7. After Exiting the trade you always have option to re-enter at the next trailing Stop loss signal(green arrow) generated candle CLOSE and put your Stop loss at LOW of that candle and repeat the same trailing stop loss procedures.
SELL Trade Management :-
1. Trade should be initiated if and only if there is a sell signal(Red Triangle) is generated.
2. You should only enter the trade at the CLOSE of the signal generated candle.
3. Your Stop loss should be placed at the HIGH of the signal generated candle.
4. There is a trailing Stop loss signal (Red Arrow) after the selling signal is generated.
5. You should trail your Stop loss at the HIGH of the trailing Stop loss signal generated candle.
6. You should trail your Stop loss repeatedly until your trailing Stop loss got hit and hence Exit your sell trade.
7. After Exiting the trade you have always option to re-enter at the next trailing Stop loss signal(red arrow) generated candle CLOSE and put your Stop loss at HIGH of that candle and repeat the same trailing stop loss procedures.
Disclaimer :-
*I am not a SEBI Registered Analyst and shall not be liable for any profit, loss or liability resulting, directly or indirectly from the use and results of the indicator. This is not a Holy Grail setup, sometimes the traders hit Stop loss and sometimes it gives amazing results as well.
Instructions to access to this invite-only script:-
*Send us a message if you wish to gain access to this indicator. The subscribers will get benefits of any future development or updates in the current script without any extra charges. Other trading style like swing and positional trading will also available in future updates.

ATR Trend FollowingThe script filters stocks on the basis of ATR. If the stock has moved above 7 times the ATR from the lows, the system generates buy signal and continues till the stock drops by 2 ATR. It is a good system in trending markets however in sideways consolidating markets, the system must be avoided. In trending markets it can generate good returns with significant Risk to Reward Ratio. Use it in confirmation with other trend depicting indicators is expected to generate better results.

Moving Average Directional IndexMADX is ADX-inspired indicator with moving averages that determines strength of a trend, as well as its direction. Indicator works following:
As the value of MADX increases, so does the strength of a trend
If MADX+ ( green line - bullish MADX ) crosses above MADX- ( red line - bearish MADX ) we consider trend as bullish and vice versa..
There will be situations where MADX- and MADX+ cross multiple times in a short period of time -> that will mean that market indecision is happening and big move will most likely happen after it.
For the calculation of MADX+ and MADX- we need Moving Averages or Exponential Moving Averages with three specific sources ( high, close, low ).
Now, the calculation of each MADX will differ
=> for MADX+: Moving Average (high) / Moving Average (close)
=> for MADX-: Moving Average (close) / Moving Average (low)
Length of Moving Average is editable.

Directional Movement RibbonWhat makes this different from directional movement index?
The aim is to reduce the amount of data analysis necessary before taking action; currently using DMI requires reviewing the DM+ and DM- plots, and ADX as well as review the overall trend of each one. Also there is the final analysis to determine whether a strong trend hasn’t been established at all.
This indicator condenses the information found from the standard DMI into an intuitive colored ribbon that reveals direction and strength at a glance.
How to use it?
Review the ribbon for sentiment based on color, green being bullish and red being bearish, (if using default color scheme). The brightness of the color determines the strength of the sentiment, brightest being strongest. If no color is represented at all then it is due to weakness and/or lack of direction.
Features
All colors customizable
Toggle display of indecision areas
Adjust levels considered strong, weak trends
Which markets is this meant for?
This can be used in any market, though it’s recommended to use with liquid markets where direction and strength can be found often.
What conditions?
Recommend to utilize with key levels and most commonly utilized moving average periods such as 20, 50, 100 or 200.

Trend Surfers - Momentum + ADX + EMAThis script mixes the Lazybear Momentum indicator, ADX indicator, and EMA.
Histogram meaning:
Green = The momentum is growing and the ADX is growing or above your set value
Red = The momentum is growing on the downside and the ADX is growing or above your set value
Orange = The market doesn't have enough momentum or the ADX is not growing or above your value (no trend)
Background meaning:
Blue = The price is above the EMA
Purple = The price is under the EMA
Cross color on 0 line:
Dark = The market might be sideway still
Light = The market is in a bigger move

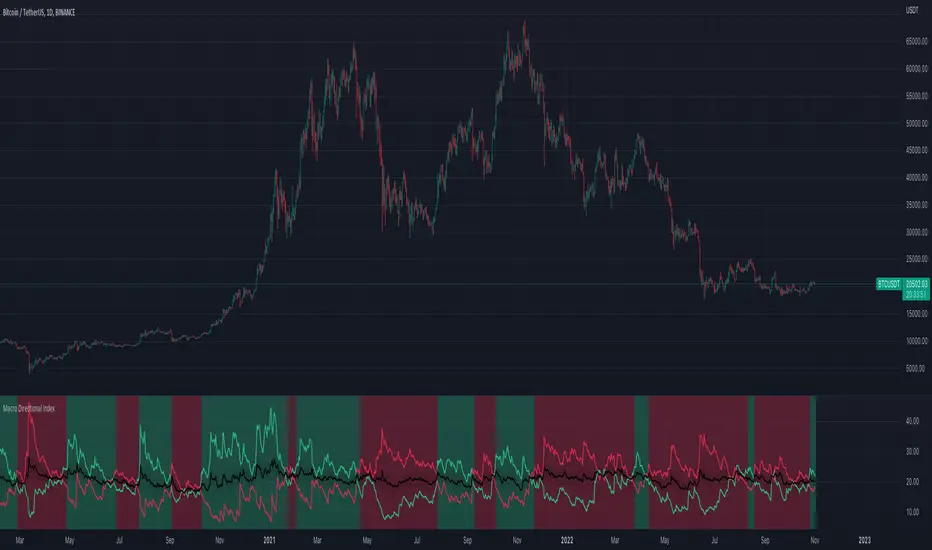
Directional Index Macro IndicatorWhat is This For?
The default settings for this indicator are for BINANCE:BTCUSDT and intended to be used on the 3D timeframe to identify market trends. This indicator does a great job identifying whether the market is bullish, bearish, or consolidating. This can also work well on lower time frames to help identify when a trend is strong or when it's reversing.
Directional Index Rate of Change
Core to this indicator is the rate at which DI+ and DI- are moving away or towards each other. This is called The Rate of Change (ROC). "The ROC length dictates how many bars back you want to compare to the current bar to see how much it has changed. It is calculated like this:
(source - source /source ) * 100"
The rate of change is smoothed using an EMA. A shorter EMA length will cause the ROC to flip back and forth between positive and negative while a larger EMA length will cause the ROC to change less often. Since the rate of change is used to indicate periods of 'consolidation', you want to find a setting that doesn't flip back and forth too often. Between the DI+ and DI- is a blue centerline. Offset from this centerline is a channel that is used to filter out false crosses of the DI+ and DI-. Sometimes, the DI+ and DI- lines will come together in this channel and cross momentarily before resuming the direction prior to the cross. When this happens, you don't want to flip your bias too soon. The wider the channel, the later the indicator will signal a DI reversal. A narrower channel will call it sooner but risks being more choppy and indicating a false cross.
Indicator Status Line
This indicator has 4 values in the status line (in order):
DI+
DI-
Distance between DI+ and DI-
DI Rate of Change ( how quickly are DI+ and DI- moving away or towards center )
Indicator Plots
This indicator plots DI+ (green), DI- (red), and a center channel between DI- and DI+. Across the top of the indicator, red and green triangles indicate the market trend while the background changes to show whether the price is in an impulse wave or consolidating. This makes up 4 possible scenarios:
Bullish impulse wave ( green triangle up + green background )
Bullish consolidation ( green triangle up + yellow background )
Bearish impulse wave ( red triangle down + red background )
Bearish consolidation ( red triangle down + yellow background )
Summary
Combined with support and resistance levels, volume, and your other favorite indicators, this can be a useful tool for validating that your entries are not going against the trend.
Disclaimer
This is not financial advice. Do not take trades only based on the DI+ and DI- crossing. Always use multiple indicators to validate your entries and never take a trade when you aren’t emotionally grounded. Have a plan. Stick to the plan.
The screenshot for this strategy is of a manual historical review of BTC on the 3 day chart. The indicator was built to try and mimic the chart above. You’ll see that it nails it sometimes, is a little late sometimes, and chops around between consolidation and impulse waves when it should stay in consolidation. Share your settings if you are able to improve the choppiness without sacrificing catching the reversals early.

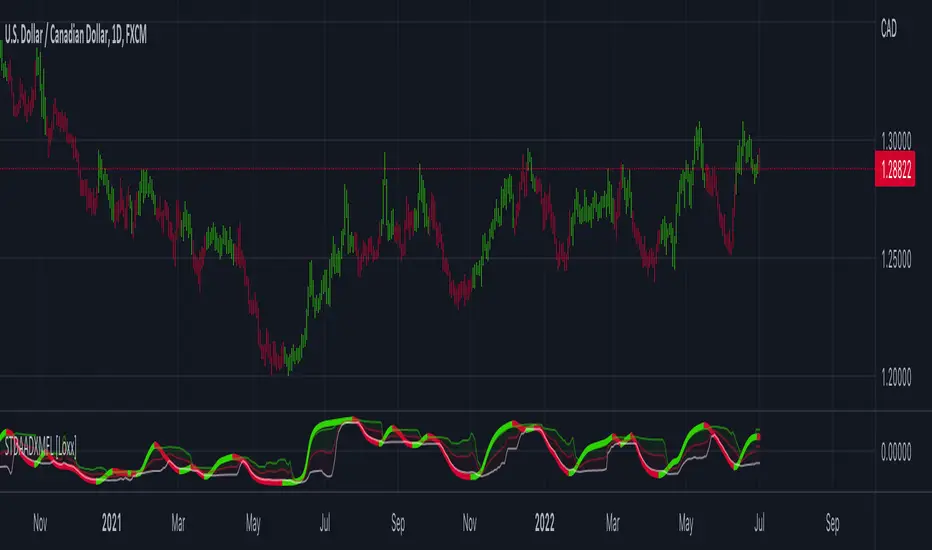
ADXVMA iTrend [Loxx]ADXVMA iTrend is an iTrend indicator with ADXVMA smoothing. Trend is used to determine where the trend starts and ends. Adjust the period inputs accordingly to suit your backtest requirements. This is also useful for scalping lower timeframes.
What is the ADXvma - Average Directional Volatility Moving Average?
Linnsoft's ADXvma formula is a volatility-based moving average, with the volatility being determined by the value of the ADX indicator.The ADXvma has the SMA in Chande's CMO replaced with an EMA , it then uses a few more layers of EMA smoothing before the "Volatility Index" is calculated.
Included
Bar coloring
Alerts
Signals
Loxx's Expanded Source Types

VHF Adaptive ADXm [Loxx]VHF Adaptive ADXm is a variation of the ADX DI indicator with adaptive filtering using a vertical horizontal filter.
What is ADXm?
Unlike the traditional ADX indicator, where the ADX itself is plotted in absolute units and detection of the trend direction is hindered, this indicator clearly displays the positive and negative ADX half-waves (displayed as colored on the chart). And the DI+/- signals are displayed as their difference (gray).
The method of using this indicator is the same as the traditional one.
In addition, it displays the levels (dashed), above which the market is considered to be in a trend state. This level is usually set to approximately 20-25 percents--somewhat depends on the time frame it is used on.
What is VHF Adaptive Cycle?
Vertical Horizontal Filter (VHF) was created by Adam White to identify trending and ranging markets. VHF measures the level of trend activity, similar to ADX DI. Vertical Horizontal Filter does not, itself, generate trading signals, but determines whether signals are taken from trend or momentum indicators. Using this trend information, one is then able to derive an average cycle length.
Included:
Bar coloring
Alerts
Signal types: zero-line crosses, level crosses, or signal crosses

DMI Stochastic Extreme Refurbished█ CONCEPTS
DMI Stochastic Extreme was originally published by Barbara Star, PhD, in TASC magazine of January 2013.
Basically it describes an improved version of the ADX DI+/DI- indicator, created by J. Welles Wilder.
In the setup described by the author, the DMI Oscillator is used together with a stochastic oscillator of DMI.
First, the DMI Oscillator is obtained by subtracting the minus directional movement indicator value (DI-) from the plus directional movement value (DI+).
The final result is the "DMI Stochastic Extreme" indicator, in which the stochastic oscillator is calculated. Only instead of using the price value, the stochastic is obtained through the DMI value.
█ Goals
The final indicator described by Barbara is the Stochastic Oscillator of DMI.
However, to use the DMI oscillator together (as described in the magazine), it is necessary to plot it in a separate indicator, which consumes screen space.
That's why the idea of joining both the DMI oscillator and the DMI Stochastic Oscillator into one thing came up, optimizing the visualization.
Taking advantage of the fact that my hands are already dirty :), I created some fine adjustments.
█ HOW TO USE IT
Here are some examples:
1. With default params:
2. With custom DI Length of 21 (Histogram), DI Length of 13 (for Stoch Oscilator), Stoch Length of 5, and another theme.
3. Another params with less noise:
█ THANKS AND CREDITS
- Barbara Star (original creator)
- ucsgears (arrow logic)

DI-CD with ADXNew method of visualising the directional index values as calculated by BeikabuOyaji . Uses the slightly incorrect version of calculating DI+ and DI- as per the original script, but these seem to work.
Bars are coloured based on the higher DI value, green shades for DI+ being higher and red shades for DI-. The brighter coloured bars indicate that the higher DI value is increasing compared to the last bar while the lower one is decreasing.

STD Adaptive ADXm w/ Floating Levels [Loxx]STD Adaptive ADXm w/ Floating Levels is a standard deviation adaptive ADX indicator with adaptive floating boundary levels
What is the ADX?
Trading in the direction of a strong trend reduces risk and increases profit potential. The average directional index (ADX) is used to determine when the price is trending strongly. In many cases, it is the ultimate trend indicator. After all, the trend may be your friend, but it sure helps to know who your friends are. In this article, we'll examine the value of ADX as a trend strength indicator.
What is the ADXm?
Unlike the traditional ADX indicator, where the ADX itself is plotted in absolute units and detection of the trend direction is hindered, this indicator clearly displays the positive and negative ADX half-waves (displayed as colored on the chart).
Included:
-Toggle on/off bar coloring
-Toggle on/off fill coloring
Parabolic SAR with the ADX overlayThe following indicator and chart pattern is based on a twist from Welles Wilder's parabolic stop and reverse . This is a trend following system which is essentially a dynamic trailing stop loss for longs and shorts. The system is often criticized for it's poor performance in choppy rangebound markets so people often combine it with other signals that attempt to identify a "trend" the ADX is a popular indicator with three indicators, the DI+ "Positive Directional Indicator" the DI- "Negative Directional Indicator" and then a combination of the two, the ADX "Average Directional Indicator". Generally speaking, if the DI+ is above the DI- and the ADX is greater than 25 then we are in a positive trending market. If the DI+ is less than the DI- and the ADX is greater than 25 then we are in a negative trending market. If the ADX is less than 25 then there is no trend in place and we are in a range bound "choppy market".
So, I created this chart to show when the ADX is > 25 (or you can enter your own number) and the DI+ is > DI- then the background will be green. Vice versa, when the ADX is >25 and the DI+ is < DI- then we are in a negative trending market and the background color will be red. If the ADX is < 25 (or whatever you choose) then we are in a choppy 'range-bound" market.
Regarding the ParSAR. Pay attention to the "+" marks. they indicate whether we are bullish or bearish. When we cross through a + then we revert to the opposite. "Stop And Reverse". They are a simple calculation of a starting percentage, an incremental increase in that percentage, and a max percentage increase. If you want your system to trade less, decrease the "maximum" If you want it to trade more, increase the maximum.
Tinker around with these and you might find a healthy strategy you can trade on.
If you add Take Profit Targets and Stop Loss Targets, this is an even more productive strategy. Try it out on BINANCE:ETHUSDT with a 2hr time horizon and 0.02, 0.023, 0.2.

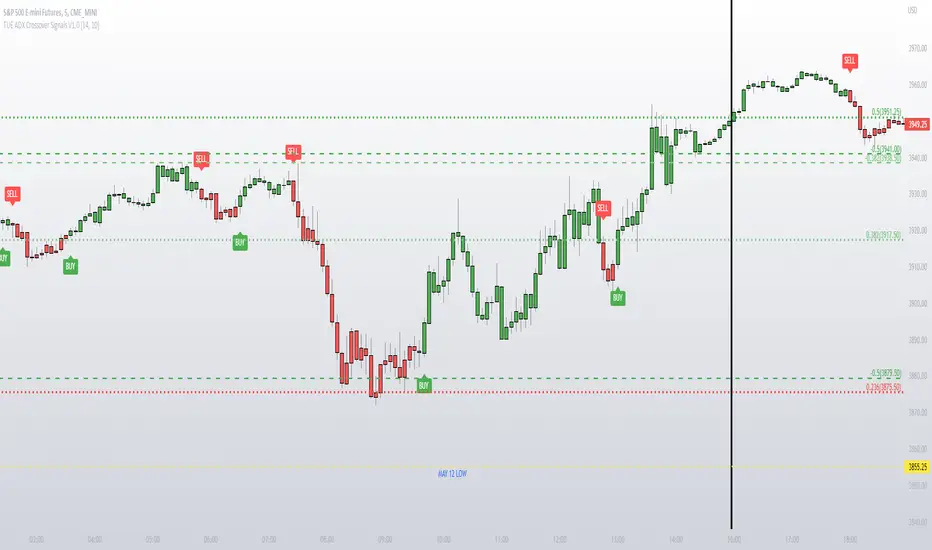
TUE ADX/MACD Confluence V1.0The ADX and MACD confluence can be a powerful predictor in stock movements. This script will help you find those confluences in an easy to understand visual manner.
It includes Buy and Sell signals for detected confluences, and will show colored candles to help you determine when to exit a trade. When the candles turn to white that means the detected confluence is no longer in play and you may want to consider a trailing stop loss.
The Buy and Sell signals will display on the first occurrence of each confluence.
It's important to understand that both of these are lagging indicators, but with a careful attention to your stoploss you can easily generate a positive profit factor.
This code is provided open source and you're free to use it for any purpose other than resale.

TUE ADX Crossover Signals V1.0This simple indicator gives you a way to visualize ADX crossovers on your chart and is a good companion if you like to trade with the ADX.
Green candles have a DI+ over DI- crossover, and vice versa for the red candles.
It gives you the ability to turn on and off BUY and SELL signals generated from the ADX crossovers.
Code is provided open source, feel free to use it for any purpose other than resale.
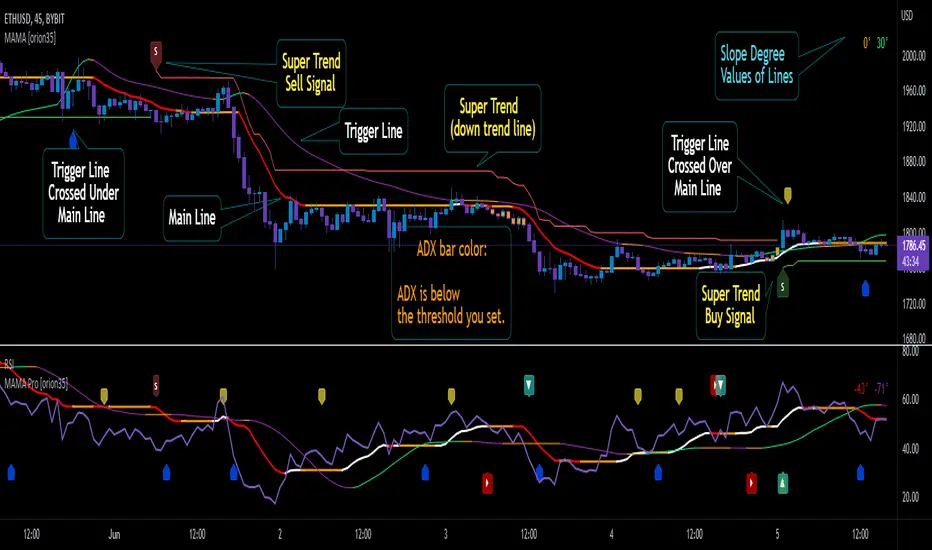
Mother of All Moving Averages, MAMA [orion35]This indicator contains the huge number of 53 MA tools . So, with the Mother of All Moving Averages (MAMA) , you can draw any two of these MA tools (that is, almost all the "Moving Average" tools used in the market) in the length and thickness you want.
These MA tools include traditional averages such as SMA , EMA , DEMA, as well as innovative averaging tools such as LFS (Laguerre Filter Smoother), LSMA (Least Square Moving Average), ZLSMA (Zerolag LSMA ) developed by @veryfid and SSMA (Super Smoothed Moving Average ) by John F. Ehlers .
Another great feature of this indicator is that signals can be filtered according to the instant ADX (Average Directional Movement indeX) value of the market. By using this filter, false signals in horizontal markets can be reduced. Also, with the threshold value setting in the ADX filter, calibration can be made for different assets and time frames when desired. In addition, you can color the price bars according to the ADX threshold value you set.
You can also automatically color these drawings in conditional formats as you wish.
If desired, the intersections of the plotted curves can be showed as signals. You can also set alarms for these intersections.
This indicator contains almost twice as many MA tools as the previous Super Moving Average Tools, SMAT indicator. For this reason, they are gathered in two main groups as " Traditional " and " New Generation " MA tools.
These MA tools are listed as follows:
--------- Mostly Traditional MA Tool s ---------
LFS : Laguerre Filter Smoother
SMA : Simple Moving Average
EMA : Exponential MA
DEMA : Double EMA
TEMA : Triple EMA
QEMA : Quadrupole EMA @everget
ZLEMA : Zerolag EMA
KZLEMA : Kalman ZLEMA
LRSMA : Linear Regression SMA
LREMA : Linear Regression EMA
TMA : Triangular MA (slow)
TMA v2 : Triangular MA (normal)
TMA v3 : Triangular MA (fast) @Daveatt
SMMA : SMoothed MA
SSMA : Super Smoother MA © 2013 John F. Ehlers
SSF : Super Smoother Filter @DonovanWall
SSeMA : Smoothed SEnsitive MA @BakwaasTrading
WMA : Weighted MA
VWMA : Volume Weighted MA
VWAP : Volume Weighted Average Price
AMA : Adaptive MA @everget
KAMA : Kaufman's Adaptive MA
FrAMA : Fractal Adaptive MA @Shizaru
ALMA : Arnaud Legoux MA
--------- New Generation MA Tools ---------
HMA : Hull MA
EHMA : Exponential HMA @DonovanWall
JMA : Jurik MA @everget
RMA : Relative MA aka Rolling MA
LWMA : Linearly Weighted MA @io72signals
LSMA : Least Square MA
ZLSMA : Zerolag LSMA @veryfid
ARSI : Adaptive Relative Strength Index @everget
WWMA : Welles Wilder's MA @KivancOzbilgic
VMA : Variable MA by Tushar S. Chande,
VIDYA : Variable Index Dynamic Average @KivancOzbilgic
VIDYA v2 : @Mohamed3nan
TSF : True Strength Force @KivancOzbilgic
TILL : Tillson T3 MA @KivancOzbilgic
DAF : Dynamically Adjustable Filter @alexgrover
KFS : Kalman Filter Smoother @alexgrover
PKF : Parametric Kalman Filter @alexgrover
VAMA : Volatility Adjusted MA @Duyck
CTI : Correlation Trend Indicator by John Ehlers
BF : Blackman Filter @alexgrover
MAMA : MESA Adaptive MA aka: Mother of AMA @KivancOzbilgic
FAMA : Following Adaptive MA @KivancOzbilgic
ARMA : Autonomous Recursive MA @alexgrover
ZARMA : Zerolag ARMA @alexgrover
A2RMA : Adaptive ARMA @alexgrover
EDMA : Exponentially Deviating MA @MightyZinger
BLP : Butterworth Low Pass Filter @DonovanWall
GLP : Gaussian Low Pass Filter @DonovanWall
SWMA : Sine Weighted MA @blackcat1402
BB-RSI-ADX Entry PointsThis is a combination of indicators used to find oversold and overbought entry points for possible reversion.
A Green arrow will appear when all condition are met for an ENTER LONG position.
A Red arow will appear when all condition are met for an ENTER SHORT position.
You can modify all of these condition parameters from the indicator's settings.
How does the indicator work
The signals are using Bollinger Bands , BB %B , RSI and ADX indicators to try and find points of reversal
Enter LONG Conditions
Current candle low is below BB lower band.
The BB %B is more than 0.
RSI > 30
ADX > 25
Enter SHORT Conditions
Current candle high is above BB upper band.
The BB %B is less than 1.
RSI < 70
ADX > 25
Those are the default settings that seem to work for me but you can customize all of these from the indicator settings.
I find this strategy to best work on a 3 minute timeframe
Note: The bb %B is calculated for stDev - 1. This will help you see a change happening faster.

Dynamic ADX - [The Pine Guru]Dynamic ADX by The Pine Guru
What is the Dynamic ADX?
The Dynamic ADX is an indicator created using the regular ADX, Line, and additional ADX Moving Average. This MA allows the script to calculate the ADX differently to the original ADX, providing greater input and accessibility to the user. As the ADX is a volatility indicator, it is communicates to trend strength in the markets. The Dynamic ADX displays these trending Periods through user controlled visualizers like Fills, Background Color, and Bar Color.
How do I use the Dynamic ADX?
This indicator has 4 different "versions" or "conditions" in which it displays trend strength. These are achieved by checking and unchecking ADX, ADX MA and Line. Different combinations of these 3 inputs will result in a change of true condition that the script outputs.
Dynamic ADX Achieved by checking the ADX and ADX MA, results in an ADX similar to an MA Crossover, with the ADX being over the MA indicating a true or strong trend condition.
Regular ADX Achieved by Checking the ADX and Line. Results in the regular calculation of the ADX.
Mixture Achieved by Checking all three sections, which results in the calculation a normal ADX as well as the MA. Provides and extra condition or confluence into the ADX.
MA and Line Achieved by checking the ADX MA and Line. Results in a similar calculation to an original ADX but with a smoother MA.
Recommendations
This indicator will work typically in all markets with high volume and volatility. It is recommended that it is used as a confluence in a trading system, and not as an outright indicator. As always do your own testing before live use with this indicator. Do your own Research and refinements.
Please Leave a like if you enjoy this Indicator

Squeeze M + ADX + TTM (Trading Latino & John Carter) by [Rolgui]About this indicator:
This indicator aims to combine two good performing strategies, which can be used separately or together, mainly for investment positions, although it can also be used for intraday trading.
Strategy 1) Squeeze Oscillator and Average Directional Index:
This strategy is taught by Jaime Aibsai, which determines market entries based on reading the direction of the price movement (Directionality of the Oscillator) along with the strength of the Oscillator (Slope of the ADX).
Both tools are configured according to Jaime Abisai's strategy, by default (note that point 23 of the ADX is represented by point 0 on the panel, to make reading easier, its interpretation is not affected). Anyway you can adjust the input data according to your interest.
*You can see this setting in the first panel.
Strategy 2) Squeeze Momentum and Trade The Market Waves:
This strategy can be consulted either in John F. Carter's books or on his website.
This market reading is based on Price Volatility (Bollinger Bands and Keltner Channels interaction) and its Trend (Exponential Moving Averages), showing entries at times when price volatility is low and taking filtering active trend using T.T.M. Waves.
To configure the indicator in the same way that Carter does, it would be enough to turn off the ADX, turn on the Squeeze Momentum signals along with the T.T.M. Waves, and importantly, change the Linear Momentum value to 12 (this configuration can be found in his book).
*You can see this setting in the second panel.
Why this indicator?
I've added and removed the above flags as I needed to query them (which became tedious for me). The main objective of having merged them into one is to make their reading more agile and comfortable and thus improve the decision-making capacity of the trader who wishes to use them.
Credits and Acknowledgments:
I would like to give credits to other authors, for the sections of code that I have used to make this technical indicator. Thanks to @LazyBear, @matetaronna, @jombie and @joren for contributing to the community and keeping their code open. It is priceless!
Feel free to combine and practice your trading with both strategies, personally, they improved my profitability and this is why I recommend researching more about them. I've been using it for crypto investing, let me know if it's worth for you on stock market!
If you have any questions or suggestions you can leave it in the comments!
Greetings!

Triple SWMA + EMA Crossover Color Candle+ ADX Color Candle V2! IMPORTANT !
To better see the color of the bars I suggest you deactivate the Borders option in the chart settings / Symbol, LIKE THIS:
════════════════════════════════════════════════════════════════════════════════════════════════════════════════════
The indicator is the same as the previous version, with the only difference that now the indicator is composed of an addition of secondary candles colored according to the EMA cross, while the main candles based on the ADX, the SWMA are inserted into secondary candles
════════════════════════════════════════════════════════════════════════════════════════════════════════════════════
1) SWMA
There are 3 SWMA , with the possibility of modifying the Source and the length of each one, also each SWMA can be removed or can all of them be removed with the ON / OFF option in Inputs-STYLE. (ALL SWMA?)
════════════════════════════════════════════════════════════════════════════════════════════════════════════════════
2) EMA Fast and Slow, Cross
There are two EMAs, fast and slow, both with the possibility of changing the source and length, in the chart settings it is possible to change the color of EMA Long and EMA Short:
EMA Long = Ema Fast > Ema Slow
EMA Short = Ema Slow > Ema Fast
Ema cross has a style choice option, the possible choices are:
NONE = nothing
ALL = all choices
LINE = ema200 colored based on Ema Long-Short
BAR COLOR = color candles based on Ema Long-Short
PLOTSHAPE = signals based on Ema Long-Short
LINE + BAR COLOR = line + bar color
BAR COLOR + PLOTSHAPE = bar color + plotshape
════════════════════════════════════════════════════════════════════════════════════════════════════════════════════
3) ADX Candle
The candles are colored according to 4 inputs:
Color 1 ( Silver ) = ADX < 20
Color 2 (Black) = ADX cross-ADX Index (adx+adx 14 period back) / 2
Color 3 (Lime) = ADX > 0 and DI delta (DI plus - DI minus) > 0
Color 4 (Red) = ADX > 0 and DI delta (DI plus - DI minus) < 0
all colors are editable and if you don't want to have ADX Candle on the chart, just remove the ON / OFF option in Inputs-STYLE. (BAR COLOR ADX )

Triple SWMA + EMA Crossover Color Candle+ ADX Color CandleIMPORTANT
The indicator allows you to view the Color Bars only if it is in the foreground, to do this just put the indicator before the description of the symbol, LIKE THIS:
════════════════════════════════════════════════════════════════════════════════════════════════════════════════════════════════
This indicator is composed of:
1) Tiple SWMA
There are 3 SWMA, with the possibility of modifying the Source and the length of each one, also each SWMA can be removed or can all of them be removed with the ON / OFF option in Inputs-STYLE. (ALL SWMA?)
════════════════════════════════════════════════════════════════════════════════════════════════════════════════════════════════
2) EMA Fast and Slow, Cross
There are two EMAs, fast and slow, both with the possibility of changing the source and length, in the chart settings it is possible to change the color of EMA Long and EMA Short
EMA Long = Ema Fast > Ema Slow
EMA Short = Ema Slow > Ema Fast
Ema cross has a style choice option, the possible choices are:
ALL = all choices
LINE = ema200 colored based on Ema Long-Short
BAR COLOR = color candles based on Ema Long-Short
PLOTSHAPE = signals based on Ema Long-Short
LINE + BAR COLOR = line + bar color
BAR COLOR + PLOTSHAPE = bar color + plotshape
if you don't want to have EMA Fast and Slow, Cross on the chart, just remove the ON / OFF option in Inputs-STYLE. (EMA style)
════════════════════════════════════════════════════════════════════════════════════════════════════════════════════════════════
3) ADX Candle
The candles are colored according to 4 inputs:
Color 1 (Silver) = ADX < 20
Color 2 (Black) = ADX cross-ADX Index (adx+adx 14 period back) / 2
Color 3 (Lime) = ADX > 0 and DI delta (DI plus - DI minus) > 0
Colo 4 (Red) = ADX > 0 and DI delta (DI plus - DI minus) < 0
all colors are editable and if you don't want to have ADX Candle on the chart, just remove the ON / OFF option in Inputs-STYLE. (BAR COLOR ADX)
