Ultimate RSI+ADX Indicator# Ultimate RSI+ADX Indicator: Principles Explained
The Ultimate RSI+ADX Indicator combines two powerful technical analysis tools to create a comprehensive trading system with enhanced signal accuracy.
## Principles of Ultimate RSI
Unlike standard RSI, Ultimate RSI doesn't just measure price movements but considers price ranges in its calculations:
1. It identifies the high and low range of the current period.
2. It detects expansion or contraction of the range compared to previous periods.
3. It considers both direction and range changes to measure momentum more accurately.
This approach allows Ultimate RSI to better capture the context of price movements and reduce false signals compared to traditional RSI.
## The ADX Component
The Average Directional Index (ADX) measures trend strength regardless of direction:
1. It quantifies how strongly a price is trending.
2. Values above 25 typically indicate a strong trend is present.
3. It helps filter out sideways markets where trading signals might be less reliable.
## How the Ultimate RSI+ADX Indicator Works
This integrated indicator functions through these key mechanisms:
1. **Enhanced Momentum Calculation**: Using Ultimate RSI for more accurate overbought/oversold conditions.
2. **Buy Signal Conditions**:
- Ultimate RSI crosses above its signal line
- Ultimate RSI remains below the maximum buy threshold
- ADX confirms sufficient trend strength
- Positive RSI slope indicates upward momentum
3. **Sell Signal Conditions**:
- Downward reversal detected at elevated RSI levels
- Ultimate RSI crosses below its signal line
- Sharp decline compared to previous price action
- ADX confirms the presence of a strong trend
The Ultimate RSI+ADX Indicator excels at identifying potential reversal points in trending markets while filtering out noise in ranging conditions. It provides traders with a balanced approach to momentum and trend analysis, helping capture significant market moves more effectively.
Ortalama Yönsel Endeks (ADX)
ADX with Shaded ZoneThe ADX with Shaded Zone indicator is a momentum-based tool that visualizes trend strength using the Average Directional Index (ADX) along with the +DI and -DI lines. This indicator enhances the traditional ADX setup by adding a shaded zone between ADX levels 20 and 25, helping traders easily identify the transition area between non-trending and trending market conditions.
It plots:
+DI (Green): Positive Directional Indicator
−DI (Red): Negative Directional Indicator
ADX (Blue): Measures the strength of the trend
Shaded Zone: Highlights the indecisive range where ADX is below 25 (gray background between levels 20 and 25)
⚙️ How to Use:
✅ Trend Identification:
ADX < 20: Weak or no trend. Avoid trend-following strategies.
ADX 20–25 (Shaded Zone): Transition zone. Potential trend forming — stay cautious.
ADX > 25: Stronger trend. Favor trend-following strategies.
✅ Direction Confirmation:
If +DI > -DI and ADX > 25 → Uptrend confirmation.
If -DI > +DI and ADX > 25 → Downtrend confirmation.
Crossovers between +DI and -DI can be used as early signals.
✅ Shaded Zone Use:
The gray shaded area helps visually filter out low-trend strength conditions.
Useful for trend traders to wait before entering until ADX breaks above 25.

RSI + ADX + ATR Combo Indicator: RSI + ADX + ATR Combo Filter
This indicator is a confluence filter tool that combines RSI, ADX, and ATR into a single, easy-to-read chart overlay. It is designed to help traders identify low-volatility, non-trending zones with balanced momentum—ideal for strategies that rely on breakouts or reversals.
🔍 Core Components:
RSI (Relative Strength Index)
Standard RSI with custom upper and lower bounds (default: 60 and 40).
Filters out extreme overbought/oversold regions and focuses on price consolidation zones.
ADX (Average Directional Index)
Measures trend strength.
When ADX is below a custom threshold (default: 20), it indicates a weak or range-bound trend.
ATR (Average True Range)
Represents volatility.
Low ATR values (default threshold: 2.5) are used to filter out high-volatility environments, helping refine entries.
🟣 Signal Logic:
A signal is highlighted with a background color when all three conditions are met:
RSI is between lower and upper bounds (e.g., 40 < RSI < 60) ✅
ADX is below the trend threshold (e.g., ADX < 20) ✅
ATR is below the volatility threshold (e.g., ATR < 2.5) ✅
These combined conditions suggest a low-volatility, low-trend strength, and balanced momentum zone—perfect for anticipating breakouts or strong directional moves.

TriTrend Nexus[BullByte]TriTrend Nexus is a comprehensive market analysis tool that consolidates three well-established signals into a single, easy-to-read interface. It is designed to help traders quickly assess the market’s current condition and make more informed decisions about potential trend shifts.
Key Features and Functionality
Composite Signal System
Multi-Faceted Approach :
The indicator combines insights from three distinct market signals into one composite score. This approach provides a more holistic view of market conditions compared to relying on a single indicator.
Clear Classification :
Based on the composite score, TriTrend Nexus categorizes the market into:
Strong Signals : When all three underlying conditions are met, indicating a robust and established trend.
Early Signals : When two out of the three conditions are met, offering an early hint of a potential trend.
Neutral/Choppy : When conditions are ambiguous or conflicting, suggesting a lack of clear market direction.
Trend Qualifiers :
In addition to the composite score, the indicator subtly refines its signal by noting whether a trend is “Rising” or “Fading.” This further aids traders in understanding the momentum behind the signal.
Dynamic Signal Identification
Timely Alerts :
By analyzing the composite data in real time, the indicator quickly identifies when market conditions shift, offering early warning signals that help traders stay ahead of the market.
Adaptive Analysis :
The built-in signal assessment continuously monitors market changes. Whether the market is in the early stages of a move or firmly committed to a trend, TriTrend Nexus adapts its messaging to reflect the evolving conditions.
User-Friendly Dashboard
Integrated Display :
A customizable dashboard provides an at-a-glance summary of key metrics. Users can choose between a detailed view for comprehensive insights or a compact version for a streamlined experience.
Key Metrics Displayed :
Primary Signal : The overall market status, such as “Bullish Strong” or “Bearish Early.”
Composite Nexus Score : A numerical value representing the strength of the current market conditions.
Supporting Data : Essential values that help explain the current signal without overwhelming the trader.
Easy Interpretation :
The dashboard is designed with clarity in mind. Clear labeling and a consistent layout ensure that even traders new to composite indicators can quickly interpret the displayed information.
Visual Clarity and Aesthetic
Color-Coded Signals :
The indicator uses a vibrant color scheme to highlight market conditions:
Bright Green : Signifies a strong bullish trend.
Light Green : Indicates an emerging bullish trend.
Red : Represents a strong bearish trend.
Light Red/Pink : Denotes an early bearish signal.
Gray : Used when market conditions are neutral or choppy.
Graphical Enhancements :
The plotted oscillator visually reinforces the signal classifications with dynamic color transitions. Horizontal markers provide reference points to help traders easily compare the current readings against standard levels.
Customization Options
Adjustable Settings :
Traders can personalize the indicator by modifying input settings such as sensitivity thresholds and period lengths. This flexibility allows the tool to adapt to different market environments and trading styles.
Dashboard Flexibility :
The option to toggle between a full dashboard and a shorter version means that both novice and experienced traders can configure the display to best suit their needs. A more detailed dashboard offers extensive insights, while the compact mode provides a minimalist view for those who prefer simplicity.
Tailored User Experience :
With multiple adjustable parameters, users can fine-tune the indicator to respond precisely to their preferred timeframes and market conditions. This adaptability makes TriTrend Nexus a versatile tool for various trading strategies.
Benefits for Traders
Quick and Informed Decision-Making :
With a single glance at the dashboard and visual cues from the oscillator, traders can quickly gauge whether the market is poised for a strong move, is in the early stages of a trend, or is too volatile for clear signals. This helps in planning timely entries and exits.
Enhanced Market Insight :
By integrating multiple perspectives into one coherent score, the indicator filters out market noise and highlights the prevailing trend more reliably. This can be particularly useful during periods of market uncertainty.
Reduced Analysis Time:
The combination of clear, color-coded signals and an intuitive dashboard reduces the time spent analyzing various individual indicators, allowing traders to focus more on strategy execution.
Customization for Diverse Strategies :
The ability to adjust various input parameters and the dashboard layout ensures that traders can tailor the tool to fit their unique analysis style and market conditions, making it a versatile addition to any trading toolkit.
User-Friendly Interface :
Even for those who are not technically inclined, the clear visual design and straightforward signal descriptions make it easy to understand the current market situation without needing to interpret complex data.

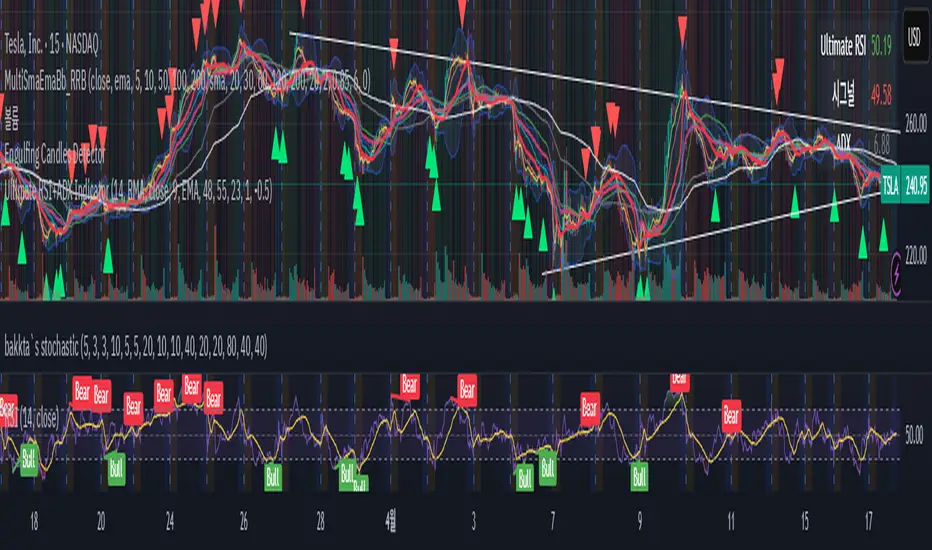
Relative Directional Index (RDI)🔍 Overview
The Relative Directional Index (RDI) is a hybrid tool that fuses the Average Directional and the Relative Strength Indices (ADX and RSI) into a single, highly visual interface. While the former captures trend strength, the latter reveals momentum shifts and potential exhaustion. Together, they can confirm trend structure, anticipate reversals, and sharpen the timing entries and exits.
📌 Why Combine ADX with RSI?
Most indicators focus on either trend-following (like ADX) or momentum detection (like RSI)—but rarely both. Each comes with trade-offs:
- ADX alone confirms trend strength but ignores momentum.
- RSI alone signals overbought/oversold, but lacks trend context.
The RDI resolves this by integrating both, offering:
- Smarter filters for trend entries
- Early warnings of momentum breakdowns
- More confident signal validation
🧠 Design Note: Fibonacci Harmony
All default values—5, 13, 21—are Fibonacci numbers. This is intentional, as these values reflect the natural rhythm of market cycles, and promote harmonic calibration between price action and indicator logic.
🔥 Key Features
✅ ADX Histogram
- Green bars = trend gaining strength
- Red bars = trend weakening
- Adjustable transparency for visual tuning
✅ ADX Line (Orange)
- Measures trend strength over time
- Rising = accelerating trend
- Falling = trend may be fading
✅ RSI Line (Lemon Yellow)
- Captures momentum surges and slowdowns
- Above 50 = bullish control
- Below 50 = bearish pressure
✅ Trend Strength Squares
- Bright green = strong uptrend
- Bright red = strong downtrend
- Faded colors = range-bound or indecisive
✅ ADX/RSI Crossover Markers
- Yellow square = RSI crosses above ADX → momentum building
- Orange square = ADX crosses above RSI → trend still dominant
✅ Customizable Reference Lines
- Yellow (50) = strong trend threshold
- Red (30) = weak trend zone
- Green (70) = overextended, potential exhaustion
_______________________________________________________
🎯 How to Trade with the RDI
The RDI helps traders identify momentum-supported trends, catch early reversals, and avoid false signals during consolidation.
✅ Trend Confirmation Entries
🔼 Bullish → Enter long on pullbacks or resistance breakouts
- ADX rising above 30
- RSI above 50
- Green trend square visible
🔽 Bearish → Enter short on breakdowns or failed retests
- ADX rising
- RSI below 50
- Red trend square visible
🧯 Exit if RSI crosses back against trend direction or ADX flattens
🚨 Reversal Setups Using Divergence
📈 Bullish Divergence → Long entry after confirmation (e.g. engulfing bar, volume spike)
- Price prints lower low
- RSI prints higher low
- Green triangle
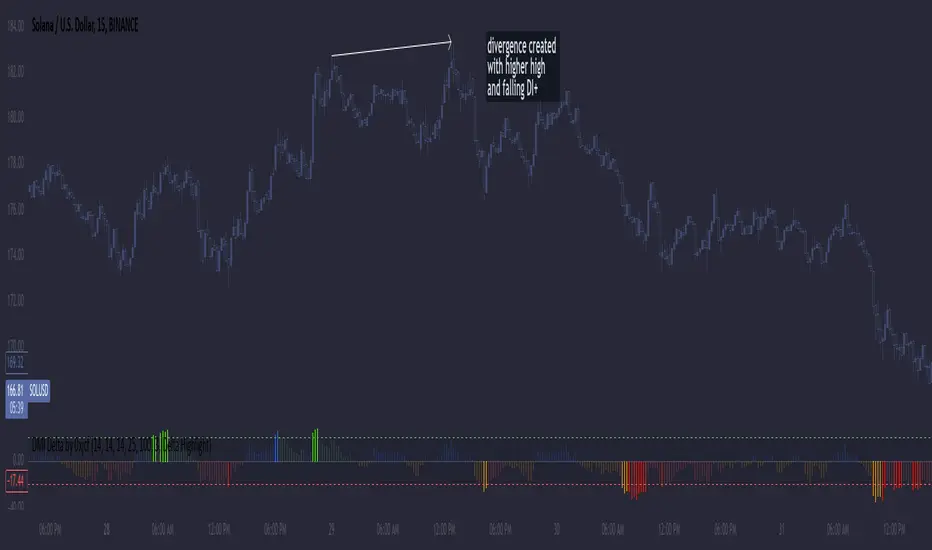
📉 Bearish Divergence → Short entry on breakdown
- Price prints higher high
- RSI prints lower high
- Red triangle
Tip: Stronger if ADX is declining (fading trend strength)
🔂 Breakout Detection via Cross Markers
- Yellow square = RSI > ADX → breakout brewing
- Orange square = ADX > RSI → trend continuation likely
⏸️ Avoid Choppy Markets
- RSI between 45–55
- Faded trend squares
- Flat ADX below 20–30
🧠 Pro Tips
- Combine RDI with VWAPs, moving averages and/or pitchforks
- Watch for alignment between trend and momentum
- Use divergence markers as confirmation, not stand-alone triggers
_______________________________________________________
⚠️ Hidden Divergence (Optional)
The RDI includes optional hidden divergence detection. These signals suggest trend continuation but are off by default. Use with discretion—best in established trends, not sideways markets.
🙈 Hidden Bullish
- Price prints higher low
- RSI prints lower low
🙈 Hidden Bearish
- Price prints lower high
- RSI prints higher high

Adv EMA Cloud v6 (ADX, Alerts)Summary:
This indicator provides a multi-faceted view of market trends using Exponential Moving Averages (EMAs) arranged in visually intuitive clouds, enhanced with an optional ADX-based range filter and configurable alerts for key market conditions. It aims to help traders quickly gauge trend alignment across short, medium, and long timeframes while filtering signals during potentially choppy market conditions.
Key Features:
Multiple EMAs: Displays 10-period (Fast), 20-period (Mid), and 50-period (Slow) EMAs.
Long-Term Trend Filter: Includes a 200-period EMA to provide context for the overall dominant trend direction.
Dual EMA Clouds:
Fast/Mid Cloud (10/20 EMA): Fills the area between the 10 and 20 EMAs. Defaults to Green when 10 > 20 (bullish short-term momentum) and Red when 10 < 20 (bearish short-term momentum).
Mid/Slow Cloud (20/50 EMA): Fills the area between the 20 and 50 EMAs. Defaults to Aqua when 20 > 50 (bullish mid-term trend) and Fuchsia when 20 < 50 (bearish mid-term trend).
Optional ADX Range Filter: Uses the Average Directional Index (ADX) to identify potentially non-trending or choppy markets. When enabled and ADX falls below a user-defined threshold, the EMA clouds will turn grey, visually warning that trend-following signals may be less reliable.
Configurable Alerts: Provides several built-in alert conditions using Pine Script's alertcondition function:
Confluence Condition: Triggers when a 10/20 EMA crossover occurs while both EMA clouds show alignment (both bullish/green/aqua or both bearish/red/fuchsia) and price respects the 200 EMA filter and the ADX filter indicates a trend (if filters are enabled).
MA Filter Cross: Triggers when price crosses above or below the 200 EMA filter line.
Full Alignment Start: Triggers on the first bar where full bullish or bearish alignment occurs (both clouds aligned + MA filter respected + ADX trending, if filters are enabled).
How It Works:
EMA Calculation: Standard Exponential Moving Averages are calculated for the 10, 20, 50, and 200 periods based on the closing price.
Cloud Creation: The fill() function visually shades the area between the 10 & 20 EMAs and the 20 & 50 EMAs.
Cloud Coloring: The color of each cloud is determined by the relationship between the two EMAs that define it (e.g., if EMA 10 is above EMA 20, the first cloud is bullish-colored).
ADX Filter Logic: The script calculates the ADX value. If the "Use ADX Trend Filter?" input is checked and the calculated ADX is below the specified "ADX Trend Threshold", the script considers the market potentially ranging.
ADX Visual Effect: During detected ranging periods (if the ADX filter is active), the plotCloud12Color and plotCloud23Color variables are assigned a neutral grey color instead of their normal bullish/bearish colors before being passed to the fill() function.
Alert Logic: Boolean variables track the specific conditions (crossovers, cloud alignment, filter positions, ADX state). The alertcondition() function creates triggerable alerts based on these pre-defined conditions.
Potential Interpretation (Not Financial Advice):
Trend Alignment: When both clouds share the same directional color (e.g., both bullish - Green & Aqua) and price is on the corresponding side of the 200 EMA filter, it may suggest a stronger, more aligned trend. Conversely, conflicting cloud colors may indicate indecision or transition.
Dynamic Support/Resistance: The EMA lines themselves (especially the 20, 50, and 200) can sometimes act as dynamic levels where price might react.
Range Warning: Greyed-out clouds (when ADX filter is enabled) serve as a visual warning that trend-based strategies might face increased difficulty or whipsaws.
Confluence Alerts: The specific confluence alerts signal moments where multiple conditions align (crossover + cloud agreement + filters), which some traders might view as higher-probability setups.
Customization:
All EMA lengths (10, 20, 50, 200) are adjustable via the Inputs menu.
The ADX length and threshold are configurable.
The MA Trend Filter and ADX Trend Filter can be independently enabled or disabled.
Disclaimer:
This indicator is provided for informational and educational purposes only. Trading financial markets involves significant risk. Past performance is not indicative of future results. Always conduct your own thorough analysis and consider your risk tolerance before making any trading decisions. This indicator should be used in conjunction with other analysis methods and tools. Do not trade based solely on the signals or visuals provided by this indicator.

ADX BoxDescription:
The ADX Box indicator provides traders with a quick and intuitive way to monitor the current trend strength based on the Average Directional Index (ADX), calculated with a customisable period (default: 7 periods).
This compact indicator neatly displays the current ADX value rounded to one decimal place, along with a clear directional arrow:
Green upward triangle (▲): Indicates that ADX is rising above its moving average, signaling increasing trend strength.
Red downward triangle (▼): Indicates that ADX is declining below its moving average, signaling weakening trend strength.
Key Features:
Small and clean visual representation.
Dynamically updates in real-time directly on the chart.
Ideal for quick trend strength assessment without cluttering your workspace.
Recommended Usage:
Quickly identifying whether market trends are strengthening or weakening.
Enhancing decision-making for trend-following or breakout trading strategies.
Complementing other indicators such as ATR boxes for volatility measurement.
Feel free to use, share, and incorporate this indicator into your trading setups for clearer insights and more confident trading decisions!

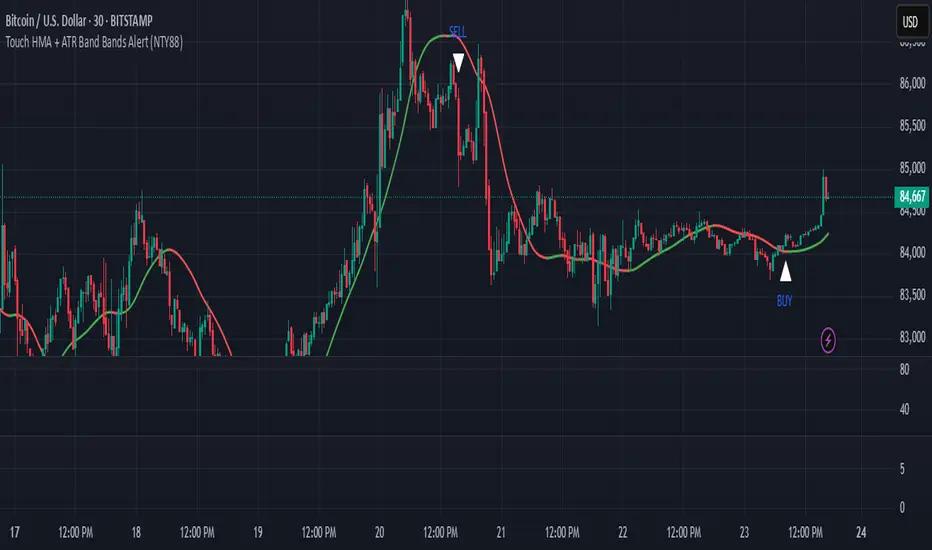
Touch HMA + ATR Band Bands Alert (NTY88)🔔 Precision Alerts | No Repainting | ATR-Based Touch Detection | HMA Trend Coloring
This script is a clean and powerful tool designed to help you catch precise market reversals using ATR Band touches combined with trend-following logic.
📌 How It Works
A custom Hull Moving Average (HMA) is used to track the trend.
Two dynamic ATR-based bands are drawn above and below the HMA.
A signal is generated when the closing price touches the upper or lower ATR band within a small tolerance zone.
✅ Key Features
🔁 Alternating Signals: Only one Buy → then one Sell → then Buy again. No signal spam.
🟢🔴 Color-Changing HMA Line: Green = HMA rising | Red = HMA falling
📏 Price Tolerance Input: Define how close the candle must be to the ATR band to trigger a signal.
🔔 Real-Time Alerts: Easily set alerts for Buy and Sell signals — works in live markets.
🚫 No Repainting: All signals are confirmed at candle close and will not change afterward.
🎯 When to Use
Great for trend reversals, scalping zones, or identifying potential exhaustion points.
Works well on any timeframe or market (crypto, stocks, forex).
💬 Pro Tip:
Combine this with RSI, Volume, or ADX filters to build a complete confluence system.
📈 Built for traders who love clean logic, precision entries, and visual clarity.
Market Condition Detector By BCB ElevateMarket Condition Detector - Bullish, Bearish & Sideways Market Indicator
This indicator helps traders identify bullish, bearish, and sideways market conditions using the Average Directional Index (ADX). It calculates trend strength and direction to categorize the market into three phases:
✅ Bullish Market: ADX is above the threshold, and the positive directional index (+DI) is greater than the negative directional index (-DI).
❌ Bearish Market: ADX is above the threshold, and +DI is lower than -DI.
🔄 Sideways Market: ADX is below the threshold, indicating weak trend strength and potential consolidation.
Features:
🔹 Dynamic Market Classification - Automatically detects and updates market conditions.
🔹 Table Display - Clearly shows whether the market is bullish, bearish, or sideways in a user-friendly format.
🔹 Customizable Settings - Adjust ADX period and threshold to suit different trading strategies.
🔹 Works on All Markets - Use for Crypto, Forex, Stocks, Commodities, and Indices.
This tool is ideal for trend traders, swing traders, and breakout traders looking to optimize entries and exits.
📌 How to Use:
1️⃣ Apply it to any chart and timeframe.
2️⃣ Use the table to confirm market conditions before taking trades.
3️⃣ Combine with other indicators like moving averages, RSI, or volume analysis for better trade decisions.

Fortuna Trend Predictor**Fortuna Trend Predictor**
### Overview
**Fortuna Trend Predictor** is a powerful trend analysis tool that combines multiple technical indicators to estimate trend strength, volatility, and probability of price movement direction. This indicator is designed to help traders identify potential trend shifts and confirm trade setups with improved accuracy.
### Key Features
- **Trend Strength Analysis**: Uses the difference between short-term and long-term Exponential Moving Averages (EMA) normalized by the Average True Range (ATR) to determine trend strength.
- **Directional Strength via ADX**: Calculates the Average Directional Index (ADX) manually to measure the strength of the trend, regardless of its direction.
- **Probability Estimation**: Provides a probabilistic assessment of price movement direction based on trend strength.
- **Volume Confirmation**: Incorporates a volume filter that validates signals when the trading volume is above its moving average.
- **Volatility Filter**: Uses ATR to identify high-volatility conditions, helping traders avoid false signals during low-volatility periods.
- **Overbought & Oversold Levels**: Includes RSI-based horizontal reference lines to highlight potential reversal zones.
### Indicator Components
1. **ATR (Average True Range)**: Measures market volatility and serves as a denominator to normalize EMA differences.
2. **EMA (Exponential Moving Averages)**:
- **Short EMA (20-period)** - Captures short-term price movements.
- **Long EMA (50-period)** - Identifies the overall trend.
3. **Trend Strength Calculation**:
- Formula: `(Short EMA - Long EMA) / ATR`
- The higher the value, the stronger the trend.
4. **ADX Calculation**:
- Computes +DI and -DI manually to generate ADX values.
- Higher ADX indicates a stronger trend.
5. **Volume Filter**:
- Compares current volume to a 20-period moving average.
- Signals are more reliable when volume exceeds its average.
6. **Volatility Filter**:
- Detects whether ATR is above its own moving average, multiplied by a user-defined threshold.
7. **Probability Plot**:
- Formula: `50 + 50 * (Trend Strength / (1 + abs(Trend Strength)))`
- Values range from 0 to 100, indicating potential movement direction.
### How to Use
- When **Probability Line is above 70**, the trend is strong and likely to continue.
- When **Probability Line is below 30**, the trend is weak or possibly reversing.
- A rising **ADX** confirms strong trends, while a falling ADX suggests consolidation.
- Combine with price action and other confirmation tools for best results.
### Notes
- This indicator does not generate buy/sell signals but serves as a decision-support tool.
- Works best on higher timeframes (H1 and above) to filter out noise.
---
### Example Chart
*The chart below demonstrates how Fortuna Trend Predictor can help identify strong trends and avoid false breakouts by confirming signals with volume and volatility filters.*

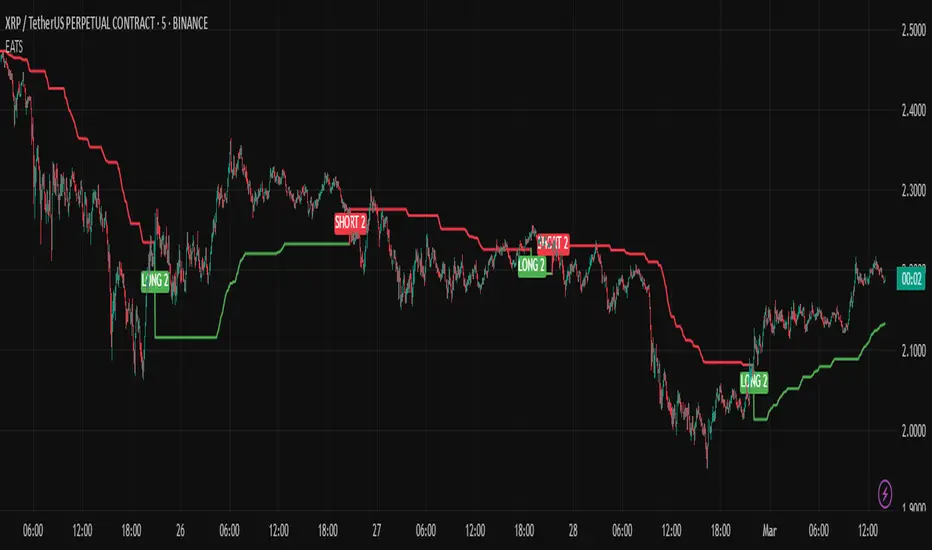
EMA Adaptive Trailing StopThe EMA Adaptive Trailing Stop Strategy is a versatile and comprehensive Pine Script designed for TradingView. This script provides an adaptive trailing stop mechanism that leverages the Exponential Moving Average (EMA) to adjust trailing stops based on market conditions. The strategy dynamically switches between trending and ranging markets by utilizing both Average True Range (ATR) and Average Directional Index (ADX) to detect market conditions.
Key Features:
EMA-Based Trailing Stop:
The script uses the EMA value to set trailing stops precisely. The EMA offers a more responsive calculation to price changes, ensuring closer and more accurate trailing stops that follow market movements effectively.
Market Condition Detection:
The script employs ATR and ADX to distinguish between trending and ranging markets. ATR measures market volatility, while ADX gauges trend strength. The combination of these two indicators provides a more accurate market condition detection.
Customizable Settings:
The script offers various flexible parameters to adjust EMA length, multipliers, and ATR length. Users can customize these settings according to their preferences and trading strategy.
Two Modes:
The script adapts to market conditions by providing two modes: trending mode and ranging mode. In trending mode, the trailing stop is tighter to follow price movements closely, whereas in ranging mode, the trailing stop is looser to accommodate lower volatility.
Entry and Exit Conditions:
The script detects market conditions to set buy and sell signals. These conditions include the calculations of EMA, ATR, and ADX to ensure the signals generated are valid and profitable.
Alerts:
The script provides buy and sell signals through alert conditions for efficient trade management. Users can enable these alerts to get real-time notifications when valid buy or sell signals are detected.
Suitable for Scalping and Swing Trading:
The script is well-suited for both scalping and swing trading strategies. Scalpers can benefit from the responsive and tighter trailing stops during trending conditions, while swing traders can take advantage of the adaptive and looser trailing stops during ranging conditions, allowing them to capture larger price movements.
Explanation of Mode 1 and Mode 2:
Mode 1: Trending Market:
In this mode, the market is identified as trending based on the ADX and ATR values.
LONG 1: This label indicates a buy signal in the trending market mode. It signifies that the trailing stop has been activated and a long position (buy) should be taken when the market is trending.
SHORT 1: This label indicates a sell signal in the trending market mode. It signifies that the trailing stop has been activated and a short position (sell) should be taken when the market is trending.
Mode 2: Ranging Market:
In this mode, the market is identified as ranging based on the ADX and ATR values.
LONG 2: This label indicates a buy signal in the ranging market mode. It signifies that the trailing stop has been activated and a long position (buy) should be taken with a looser trailing stop when the market is ranging.
SHORT 2: This label indicates a sell signal in the ranging market mode. It signifies that the trailing stop has been activated and a short position (sell) should be taken with a looser trailing stop when the market is ranging.
Technical Usage:
Variable Initialization:
The script initializes variables to store values such as trailing stop, long position status, and short position status.
Market Condition Detection:
The script calculates ATR and ADX values to detect whether the market is trending or ranging. This includes the use of f_adx function to calculate ADX values and determine market conditions.
EMA-Based Trailing Stop Calculation:
The script adjusts the trailing stop based on EMA values and ATR. The calculation involves customizable multipliers and parameters that influence the trailing stop's precision.
Plot Trailing Stop:
The script displays the trailing stop on the chart for clear visualization. This includes plotting the trailing stop line with appropriate colors to indicate long and short positions.
Entry and Exit Conditions:
The script determines the entry (buy) and exit (sell) conditions based on market condition detection and trailing stop settings. These conditions are crucial for generating valid buy or sell signals.
Plotshape and Alert:
The script provides plotshapes for buy and sell signals and sets up alert conditions for real-time notifications when a valid buy or sell signal is detected.
ADX with Moving AverageADX with Moving Average is a powerful indicator that enhances trend analysis by combining the standard Average Directional Index (ADX) with a configurable moving average.
The ADX helps traders identify the strength of a trend. In general:
ADX 0-20 – Absent or Weak Trend
ADX 25-50 – Strong Trend
ADX 50-75 – Very Strong Trend
ADX 75-100 – Extremely Strong Trend
By adding a moving average we can judge if the ADX itself is trending upwards or downwards, i.e. if a new trend is emerging or an existing one is weakening.
This combination allows traders to better confirm strong trends and filter out weak or choppy market conditions.
Key Features & Customization:
✔ Configurable DI & ADX Lengths – Adjust how quickly the ADX reacts to price movements (default: 14, 14).
✔ Multiple Moving Average Options – Choose between SMA, EMA, WMA, VWMA, or T3 for trend confirmation.
✔ Custom MA Length – Fine-tune the sensitivity of the moving average to match your strategy.
🔹 Use this indicator to confirm strong trends before entering trades, filter out false signals, or refine existing strategies with a dynamic trend-strength component. 🚀

Crypto Scanner v4This guide explains a version 6 Pine Script that scans a user-provided list of cryptocurrency tokens to identify high probability tradable opportunities using several technical indicators. The script combines trend, momentum, and volume-based analyses to generate potential buying or selling signals, and it displays the results in a neatly formatted table with alerts for trading setups. Below is a detailed walkthrough of the script’s design, how traders can interpret its outputs, and recommendations for optimizing indicator inputs across different timeframes.
## Overview and Key Components
The script is designed to help traders assess multiple tokens by calculating several indicators for each one. The key components include:
- **Input Settings:**
- A comma-separated list of symbols to scan.
- Adjustable parameters for technical indicators such as ADX, RSI, MFI, and a custom Wave Trend indicator.
- Options to enable alerts and set update frequencies.
- **Indicator Calculations:**
- **ADX (Average Directional Index):** Measures trend strength. A value above the provided threshold indicates a strong trend, which is essential for validating momentum before entering a trade.
- **RSI (Relative Strength Index):** Helps determine overbought or oversold conditions. When the RSI is below the oversold level, it may present a buying opportunity, while an overbought condition (not explicitly part of this setup) could suggest selling.
- **MFI (Money Flow Index):** Similar in concept to RSI but incorporates volume, thus assessing buying and selling pressure. Values below the designated oversold threshold indicate potential undervaluation.
- **Wave Trend:** A custom indicator that calculates two components (WT1 and WT2); a crossover where WT1 moves from below to above WT2 (particularly near oversold levels) may signal a reversal and a potential entry point.
- **Scanning and Trading Zone:**
- The script identifies a *bullish setup* when the following conditions are met for a token:
- ADX exceeds the threshold (strong trend).
- Both RSI and MFI are below their oversold levels (indicating potential buying opportunities).
- A Wave Trend crossover confirms near-term reversal dynamics.
- A *trading zone* condition is also defined by specific ranges for ADX, RSI, MFI, and a limited difference between WT1 and WT2. This zone suggests that the token might be in a consolidation phase where even small moves may be significant.
- **Alerts and Table Reporting:**
- A table is generated, with each row corresponding to a token. The table contains columns for the symbol, ADX, RSI, MFI, WT1, WT2, and the trading zone status.
- Visual cues—such as different background colors—highlight tokens with a bullish setup or that are within the trading zone.
- Alerts are issued based on the detection of a bullish setup or entry into a trading zone. These alerts are limited per bar to avoid flooding the trader with notifications.
## How to Interpret the Indicator Outputs
Traders should use the indicator values as guidance, verifying them against their own analysis before making any trading decision. Here’s how to assess each output:
- **ADX:**
- **High values (above threshold):** Indicate strong trends. If other indicators confirm an oversold condition, a trader may consider a long position for a corrective reversal.
- **Low values:** Suggest that the market is not trending strongly, and caution should be taken when considering entry.
- **RSI and MFI:**
- **Below oversold levels:** These conditions are traditionally seen as signals that an asset is undervalued, potentially triggering a bounce.
- **Above typical resistance levels (not explicitly used here):** Would normally caution a trader against entering a long position.
- **Wave Trend (WT1 and WT2):**
- A crossover where WT1 moves upward above WT2 in an oversold environment can signal the beginning of a recovery or reversal, thereby reinforcing buy signals.
- **Trading Zone:**
- Being “in zone” means that the asset’s current values for ADX, RSI, MFI, and the closeness of the Wave Trend lines indicate a period of consolidation. This scenario might be suitable for both short-term scalping or as an early exit indicator, depending on further market analysis.
## Timeframe Optimization Input Table
Traders can optimize indicator inputs depending on the timeframe they use. The following table provides a set of recommended input values for various timeframes. These values are suggestions and should be adjusted based on market conditions and individual trading styles.
Timeframe ADX RSI MFI ADX RSI MFI WT Channel WT Average
5-min 10 10 10 20 30 20 7 15
15-min 12 12 12 22 30 20 9 18
1-hour 14 14 14 25 30 20 10 21
4-hour 16 16 16 27 30 20 12 24
1-day 18 18 18 30 30 20 14 28
Adjust these parameters directly in the script’s input settings to match the selected timeframe. For shorter timeframes (e.g., 5-min or 15-min), the shorter lengths help filter high-frequency noise. For longer timeframes (e.g., 1-day), longer input values may reduce false signals and capture more significant trends.
## Best Practices and Usage Tips
- **Token Limit:**
- Limit the number of tokens scanned to 10 per query line. If you need to scan more tokens, initiate a new query line. This helps manage screen real estate and ensures the table remains legible.
- **Confirming Signals:**
- Use this script as a starting point for identifying high potential trades. Each indicator’s output should be used to confirm your trading decision. Always cross-reference with additional technical analysis tools or market context.
- **Regular Review:**
- Since the script updates the table every few bars (as defined by the update frequency), review the table and alerts regularly. Market conditions change rapidly, so timely decisions are crucial.
## Conclusion
This Pine Script provides a comprehensive approach for scanning multiple cryptocurrencies using a combination of trend strength (ADX), momentum (RSI and MFI), and reversal signals (Wave Trend). By using the provided recommendation table for different timeframes and limiting the tokens to 20 per query line (with a maximum of four query lines), traders can streamline their scanning process and more effectively identify high probability tradable tokens. Ultimately, the outputs should be critically evaluated and combined with additional market research before executing any trades.

Advanced Supertrend Enhanced ADXEnhanced Supertrend ADX Indicator - Technical Documentation
Overview
The Enhanced Supertrend ADX indicator combines ADX directional strength with Supertrend trend-following capabilities, creating a comprehensive trend detection system. It's enhanced with normalization techniques and multiple filters to provide reliable trading signals.
Key Features and Components
The indicator incorporates three main components:
Core ADX and Supertrend Fusion
Uses a shorter ADX period for increased sensitivity
Integrates Supertrend signals for trend confirmation
Applies a long-term moving average for trend context
Advanced Filtering System
Volatility filter: Identifies periods of significant market movement
Momentum filter: Confirms the strength and sustainability of trends
Lateral market detection: Identifies ranging market conditions
Data Normalization
Standardizes indicator readings across different instruments
Makes signals comparable across various market conditions
Reduces extreme values and false signals
Model Assumptions
The indicator operates under several key assumptions:
Market Behavior
Markets alternate between trending and lateral phases
Strong trends correlate with increased volatility
Price momentum confirms trend strength
Market transitions follow identifiable patterns
Signal Reliability
Low ADX values indicate lateral markets
Valid signals require both volatility and momentum confirmation
Multi-filter confirmation increases signal reliability
Price normalization enhances signal quality
Trading Applications
The indicator supports different trading approaches:
Trend Trading
Strong signals when all filters align
Clear distinction between bullish and bearish trends
Momentum confirmation for trend continuation
Range Trading
Clear identification of lateral markets
Band-based trading boundaries
Reduced false breakout signals
Transition Trading
Early identification of trend-to-range transitions
Clear signals for range-to-trend transitions
Momentum-based confirmation of breakouts
Risk Considerations
Important factors to consider:
Signal Limitations
Potential delay in fast-moving markets
False signals during extreme volatility
Time frame dependency
Best Practices
Use in conjunction with other indicators
Apply proper position sizing
Focus on liquid instruments
Consider market context
Performance Characteristics
The indicator shows optimal performance under specific conditions:
Ideal Conditions
Daily timeframe analysis
Clear trending market phases
Liquid market environments
Normal volatility conditions
Challenging Conditions
Choppy market conditions
Extremely low volatility
Highly volatile markets
Illiquid instruments
Implementation Recommendations
For optimal use, consider:
Market Selection
Best suited for major markets
Requires adequate liquidity
Works well with trending instruments
Timeframe Selection
Primary: Daily charts
Secondary: 4-hour charts
Caution on lower timeframes
Risk Management
Use appropriate position sizing
Set clear stop-loss levels
Consider market volatility
Monitor overall exposure
This indicator serves as a comprehensive tool for market analysis, combining traditional technical analysis with modern filtering techniques. Its effectiveness depends on proper implementation and understanding of market conditions.

Trend Strength & Direction📌 Assumptions of the "Trend Strength & Direction" Model
This model is designed to measure both trend strength and trend direction, using a modified version of the ADX (Average Directional Index) while also identifying ranging markets. Below is a detailed breakdown of all key assumptions.
1️⃣ Using ADX as the Basis for Trend Strength
Why ADX?
The ADX (Average Directional Index) is one of the most commonly used indicators for measuring trend strength, regardless of direction.
How is it calculated?
ATR (Average True Range) is used to normalize volatility.
Directional movement (+DM and -DM) is smoothed with an Exponential Moving Average (EMA) to obtain the +DI (Positive Directional Indicator) and -DI (Negative Directional Indicator).
Trend strength is derived by normalizing the absolute difference between +DI and -DI, divided by the sum of both.
🔹 Assumption: A high ADX means the trend is strong (whether bullish or bearish).
2️⃣ 50-Period Moving Average for Trend Strength
Why add a moving average?
ADX can be very volatile in the short term.
A 50-period SMA (Simple Moving Average) is used to smooth out trend strength and identify sustained trends.
🔹 Assumption: The SMA reduces false signals caused by short-term ADX spikes.
3️⃣ Identifying a Ranging Market (ADX Below 35)
How is a ranging market defined?
If the trend strength (ADX) is below 35, the market is considered "ranging".
The 35-level threshold is chosen empirically since ADX values below this level often indicate a lack of strong price direction.
When the market is ranging, the background color turns yellow.
🔹 Assumption: ADX < 35 indicates a sideways market, so the indicator colors the background yellow.
4️⃣ Determining Trend Direction Using +DI and -DI
How is direction determined?
If +DI > -DI, the trend is bullish (green).
If -DI > +DI, the trend is bearish (red).
If ADX is below 35, the market is ranging and turns yellow.
🔹 Assumption: Trend direction is determined by the relationship between +DI and -DI, not ADX values.
5️⃣ Background Color to Highlight Market Conditions
Yellow background if ADX < 35 → Ranging market.
Green background if ADX ≥ 35 and bullish.
Red background if ADX ≥ 35 and bearish.
🔹 Assumption: The background color visually differentiates trending vs. ranging phases.
6️⃣ Reference Levels for ADX
Lateral Threshold (35) → Below this, the trend is weak or ranging.
Neutral Threshold (50) → Intermediate level indicating moderate trend strength.
Strong Trend Threshold (75) → Above this, the trend is very strong and possibly overextended.
🔹 Assumption: ADX above 75 indicates a very strong trend, potentially near exhaustion.
🔹 Summary of Key Assumptions
1️⃣ ADX is the core strength metric → Strong trends when ADX > 35, weak below 35.
2️⃣ The 50-period SMA smooths out volatility → Prevents false signals.
3️⃣ Ranging markets are defined as ADX < 35 → Yellow background color.
4️⃣ Trend direction is based on +DI vs. -DI → Green = bullish, Red = bearish.
5️⃣ Background colors enhance readability → Helps distinguish different market phases.
6️⃣ ADX reference levels (35, 50, 75) indicate increasing trend strength.
Conclusion
This model combines ADX with a moving average and color-based logic to highlight trend strength, trend direction, and sideways markets. It helps traders quickly identify the best conditions for entering or exiting trades. 🚀

Strength Measurement -HTStrength Measurement -HT
This indicator provides a comprehensive view of trend strength by calculating the average ADX (Average Directional Index) across multiple timeframes. It helps traders identify strong trends, potential reversals, and confirm signals from other indicators.
Key Features:
Multi-Timeframe Analysis: Analyze trend strength across different timeframes. Choose which timeframes to include in the calculation (5 min, 15 min, 30 min, 1 hour, 4 hour).
Customizable ADX Parameters: Adjust the ADX smoothing (adxlen) and DI length (dilen) parameters to fine-tune the indicator to your preferred settings.
Smoothed Average ADX: The average ADX is smoothed using a Simple Moving Average to reduce noise and provide a clearer picture of the overall trend.
Color-Coded Visualization: The histogram clearly indicates trend direction and strength:
Green: Uptrend
Red: Downtrend
Darker shades: Stronger trend
Lighter shades: Weaker trend
Reference Levels: Includes horizontal lines at 25, 50, and 75 to provide benchmarks for trend strength classification.
Alerts: Set alerts for strong trend up (ADX crossing above 50) and weakening trend (ADX crossing below 25).
How to Use:
Select Timeframes: Choose the timeframes you want to include in the average ADX calculation.
Adjust ADX Parameters: Fine-tune the adxlen and dilen values based on your trading style and the timeframe of the chart.
Identify Strong Trends: Look for histogram bars with darker green or red colors, indicating a strong trend.
Spot Potential Reversals: Watch for changes in histogram color and height, which may suggest a weakening trend or a potential reversal.
Combine with Other Indicators: Use this indicator with other technical analysis tools to confirm trading signals.
Note: This indicator is based on the ADX, which is a lagging indicator.

ADX-DMIThis script manually calculates the Directional Movement Index (DMI) and the Average Directional Index (ADX) using Wilder’s smoothing technique. The DMI indicators are used to assess the strength and direction of a market trend. It includes three main lines: ADX (yellow), DI+ (green), and DI− (red). Traders use these indicators to determine whether a trend is strong and in which direction it is moving.
The process begins by defining the length parameter, which determines how many periods are considered in the calculation. It then calculates the True Range (TR), which is the greatest of three values: the difference between the current high and low, the difference between the current high and the previous close, and the difference between the current low and the previous close. This TR is used to compute the Average True Range (ATR), which smooths out price fluctuations to get a clearer picture of the market’s volatility. Next, the script calculates the +DM (positive directional movement) and -DM (negative directional movement) based on the changes in the highs and lows from one period to the next.
Finally, the script computes the DI+ and DI− values by dividing the smoothed +DM and -DM by the ATR and multiplying by 100 to express them as percentages. The DX value is calculated as the absolute difference between DI+ and DI−, normalized by the sum of both values. The ADX is then derived by smoothing the DX value over the specified length. The three indicators — ADX, DI+, and DI− — are plotted in the lower chart panel, providing traders with visual cues about the trend’s direction (DI+ and DI−) and strength (ADX).
Important Notice:
The use of technical indicators like this one does not guarantee profitable results. This indicator should not be used as a standalone analysis tool. It is essential to combine it with other forms of analysis, such as fundamental analysis, risk management strategies, and awareness of current market conditions. Always conduct thorough research.
Note: The effectiveness of any technical indicator can vary based on market conditions and individual trading styles. It's crucial to test indicators thoroughly using historical data before applying them in live trading scenarios.
Disclaimer:
Trading financial instruments involves substantial risk and may not be suitable for all investors. Past performance is not indicative of future results. This indicator is provided for informational and educational purposes only and should not be considered investment advice. Always conduct your own research before making any trading decisions.
ADX and DI Trend meter and status table IndicatorThis ADX (Average Directional Index) and DI (Directional Indicator) indicator helps identify:
Trend Direction & Strength:
LONG: +DI above -DI with ADX > 20
SHORT: -DI above +DI with ADX > 20
RANGE: ADX < 20 indicates choppy/sideways market
Trading Signals:
Bullish: +DI crosses above -DI (green triangle)
Bearish: -DI crosses below +DI (red triangle)
ADX Strength Levels:
Strong: ADX ≥ 50
Moderate: ADX 30-49
Weak: ADX 20-29
No Trend: ADX < 20
Best Uses:
Trend confirmation before entering trades
Identifying ranging vs trending markets
Exit signal when trend weakens
Works well on multiple timeframes
Most effective in combination with other indicators
The table displays current trend direction and ADX strength in real-time
TASC 2024.12 Dynamic ADX Histogram█ OVERVIEW
This script introduces a new version of the ADX oscillator, designed by Neil Jon Harrington and featured in the "Revisualizing The ADX Oscillator" article from the December 2024 edition of TASC's Traders' Tips .
█ CONCEPTS
The directional movement index (DMI+ and DMI−) and average directional index (ADX) indicators have long been popular with technical analysts. Developed by J. Welles Wilder in the 1970s, these indicators provide information about the direction and strength of price movements across bars. The DMI+ measures positive price movement, the DMI- measures negative price movement, and the ADX gauges the average strength of price trends. Although these indicators can provide helpful insights into price action and momentum, Neil Jon Harrington argues they are often misunderstood or misapplied.
Harrington's indicator, the Dynamic ADX Histogram (DADX), applies directional information to the ADX based on DMI+ and DMI- values to create a single oscillator centered around 0. The indicator displays the oscillator as a histogram with dynamic colors based on ADX movements and user-defined strength thresholds. The author believes this modification of the ADX and DMI data offers a more intuitive visualization of the information provided by Wilder's calculations.
An additional feature of the DADX is the option to use average (smooth) DMI+ and DMI- values in the oscillator's calculation, which reduces noise and choppiness at the cost of added lag.
█ USAGE
The "ADX Length" input determines the number of bars in the DMI and ADX calculation. The "DMI Smoothing Length" input controls the number of bars in the DMI smoothing calculation. Use a value of 1 for non-smoothed DMI data.
The sign of the DADX indicates the direction of price movements based on the difference between the smoothed DMI+ and DMI- values. The absolute value of the oscillator corresponds to the ADX, representing the trend strength.
The "Low Threshold" and "High Threshold" inputs define the ADX thresholds for categorizing trending, non-trending, and exhaustion states. The low threshold specifies the minimum absolute oscillator value required to indicate a trend, and the high threshold marks the absolute value where trend strength is excessive, possibly suggesting an upcoming consolidation or reversal. The indicator colors the histogram based on these thresholds and changes in the ADX, with brighter colors denoting a strengthening trend and darker colors signaling a weakening trend.

Trend IdentifierThe “Trend Identifier” indicator is designed to help traders quickly identify trending and sideways market conditions, allowing them to adapt their strategies based on the prevailing market sentiment. By combining several technical analysis tools—ATR (Average True Range), ADX (Average Directional Index), EMA (Exponential Moving Average), and RSI (Relative Strength Index)—this script provides insights into the market’s strength, direction, and volatility to improve trade decision-making.
How It Works
1. ATR (Average True Range):
• ATR measures market volatility. In this script, ATR is used in combination with a moving average to identify periods of rising or falling volatility, which helps differentiate between trending and non-trending conditions.
2. ADX (Average Directional Index):
• ADX is a key component in identifying the strength of a trend. The script uses a threshold system to classify market conditions:
• If ADX is low (below a specified threshold plus a buffer) and ATR indicates low volatility, the market is likely in a sideways condition.
• If ADX is high (above a threshold minus a buffer) with increasing ATR, the market is likely in a trending condition.
3. EMA (Exponential Moving Average):
• A 20-period EMA is used instead of a simple moving average to enhance trend detection speed. The close price’s position relative to the EMA helps identify bullish or bearish trends when combined with ADX and ATR data.
4. RSI (Relative Strength Index):
• RSI acts as a confirmation tool for trend strength. A bullish trend is confirmed if RSI is above 50 and the price is above the EMA, whereas a bearish trend is confirmed if RSI is below 50 and the price is below the EMA.
Market Condition Signals
• Sideways Signal:
• When ADX and ATR indicate a low-volatility, sideways market, the indicator changes the background color to gray, signaling potential low-trend movement or consolidation. A “S” symbol appears above the bars, making it easier to spot this condition.
• Bullish Trend:
• When conditions favor a strong upward trend, the background changes to green. A “B” symbol is displayed below the bar, indicating the onset of a bullish market condition.
• Bearish Trend:
• Conversely, if conditions indicate a downward trend, the background color changes to red. A “S” symbol is displayed below the bar, showing a bearish trend condition.
Using the Indicator
This indicator helps traders understand the current market structure in a glance:
• Sideways (Gray): Low-volatility consolidation period, ideal for range-bound strategies or waiting for a breakout.
• Bullish (Green): Confirmed uptrend, potentially suitable for buying or long entries.
• Bearish (Red): Confirmed downtrend, ideal for short selling or exiting long positions.
The “Trend Identifier” is a powerful tool for traders who seek a clear view of the market structure, using a balanced approach of volatility, trend strength, and momentum. By combining the power of ATR, ADX, EMA, and RSI, this indicator provides a nuanced picture of the market’s behavior, assisting traders in making more informed decisions.

DMI Delta by 0xjcfOverview
This indicator integrates the Directional Movement Index (DMI), Average Directional Index (ADX), and volume analysis into an Oscillator designed to help traders identify divergence-based trading signals. Unlike typical volume or momentum indicators, this combination provides insight into directional momentum and volume intensity, allowing traders to make well-informed decisions based on multiple facets of market behavior.
Purpose and How Components Work Together
By combining DMI and ADX with volume analysis, this indicator helps traders detect when momentum diverges from price action—a common precursor to potential reversals or significant moves. The ADX filter enhances this by distinguishing trending from range-bound conditions, while volume analysis highlights moments of extreme sentiment, such as solid buying or selling. Together, these elements provide traders with a comprehensive view of market strength, directional bias, and volume surges, which help filter out weaker signals.
Key Features
DMI Delta and Oscillator: The DMI indicator measures directional movement by comparing DI+ and DI- values. This difference (DMI Delta) is calculated and displayed as a histogram, visualizing changes in directional bias. When combined with ADX filtering, this histogram helps traders gauge the strength of momentum and spot directional shifts early. For instance, a rising histogram in a bearish price trend might signal a potential bullish reversal.
Volume Analysis with Extremes: Volume is monitored to reveal when market participation is unusually high, using a customizable multiplier to highlight significant volume spikes. These extreme levels are color-coded directly on the histogram, providing visual cues on whether buying or selling interest is particularly strong. Volume analysis adds depth to the directional insights from DMI, allowing traders to differentiate between regular and powerful moves.
ADX Trending Filter: The ADX component filters trends by measuring the overall strength of a price move, with a default threshold of 25. When ADX is above this level, it suggests that the market is trending strongly, making the DMI Delta readings more reliable. Below this threshold, the market is likely range-bound, cautioning traders that signals might not have as much follow-through.
Using the Indicator in Divergence Strategies
This indicator excels in divergence strategies by highlighting moments when price action diverges from directional momentum. Here’s how it aids in decision-making:
Bullish Divergence: If the price is falling to new lows while the DMI Delta histogram rises, it can indicate weakening bearish momentum and signal a potential price reversal to the upside.
Bearish Divergence: Conversely, if prices are climbing but the DMI Delta histogram falls, it may point to waning bullish momentum, suggesting a bearish reversal.
Visual Cues and Customization
The color-coded output enhances usability:
Bright Green/Red: Extreme volume with strong bullish or bearish signals, often at points of high potential for trend continuation or reversal.
Green/Red Shades: These shades reflect trending conditions (bullish or bearish) based on ADX, factoring in volume. Green signals a bullish trend, and red is a bearish trend.
Blue/Orange Shades: Indicates non-trending or weaker conditions, suggesting a more cautious approach in range-bound markets.
Customizable for Diverse Trading Styles
This indicator allows users to adjust settings like the ADX threshold and volume multiplier to optimize performance for various timeframes and strategies. Whether a trader prefers swing trading or intraday scalping, these parameters enable fine-tuning to enhance signal reliability across different market contexts.
Practical Usage Tips
Entry and Exit Signals: Use this indicator in conjunction with price action. Divergences between the price and DMI Delta histogram can reinforce entry or exit decisions.
Adjust Thresholds: Based on backtesting, customize the ADX Trending Threshold and Volume Multiplier to ensure optimal performance on different timeframes or trading styles.
In summary, this indicator is tailored for traders seeking a multi-dimensional approach to market analysis. It blends momentum, trend strength, and volume insights to support divergence-based strategies, helping traders confidently make informed decisions. Remember to validate signals through backtesting and use it alongside price action for the best results.
RSI Crossover and ADX oscillator [deepakks444]RSI Crossover and ADX Oscillator
The RSI Crossover and ADX Oscillator is a custom indicator designed to help traders identify potential trend reversals and trend strength by analyzing the Relative Strength Index (RSI) across multiple timeframes, combined with the Average Directional Index (ADX) to measure the momentum of a trend. This indicator provides a more comprehensive view of the market, allowing traders to spot possible entry and exit points based on multiple signals and conditions.
How the Script Works:
1. Multi-Timeframe RSI Calculation:
This indicator calculates the RSI for three different timeframes:
RSI 1 (default: 15 minutes)
RSI 2 (default: 1 hour)
RSI 3 (default: Daily)
By comparing the RSI across multiple timeframes, traders can gauge both short-term and longer-term momentum. For example, if the shorter timeframe RSI is moving in the same direction as the longer timeframe RSI, it may confirm the strength of the trend. Conversely, if they diverge, it could signal a potential reversal or weakening of the trend.
Each RSI value can also be smoothed using a variety of smoothing methods (SMA, EMA, WMA, RMA) to reduce noise and produce cleaner signals.
2. RSI Smoothing Options:
The smoothing function helps make RSI readings clearer by filtering out short-term fluctuations. This can be useful in volatile markets where small movements can trigger false signals. The user can select the preferred smoothing method (or choose none) and set the smoothing factor to control the sensitivity of the RSI line.
None: No smoothing applied.
SMA (Simple Moving Average): Averages RSI over a specified period, providing a more straightforward trend line.
EMA (Exponential Moving Average): Puts more weight on recent data points, making the trend line more responsive to recent price movements.
WMA (Weighted Moving Average): A weighted average that emphasizes more recent values.
RMA (Running Moving Average): Another smoothing option similar to SMA but with different calculation properties.
3. ADX Trend Strength Measurement:
The Average Directional Index (ADX) is used to measure the strength of a trend, regardless of its direction. ADX is a widely used tool to confirm whether the market is trending strongly or if the market is in a sideways range.
ADX > 25: Indicates a strong trend.
ADX < 25: Indicates a weak trend or range-bound market.
In this script, the color of the ADX line changes dynamically based on whether the trend is strengthening (green) or weakening (red). This allows traders to quickly assess whether the market conditions are favorable for trend-following strategies.
4. Divergence Detection:
The script includes an option to detect regular bullish and bearish divergence between price and RSI. Divergence occurs when price moves in one direction but RSI moves in the opposite direction, which may indicate that the current trend is weakening and could be about to reverse.
Bullish Divergence: Occurs when the price makes a lower low, but the RSI makes a higher low. This could signal a potential upward reversal.
Bearish Divergence: Occurs when the price makes a higher high, but the RSI makes a lower high. This could signal a potential downward reversal.
These divergence signals help traders spot potential reversal points before they become obvious on the price chart itself.
5. No-Trade Zone:
The no-trade zone is an important feature of this script. It highlights the range between RSI 40 and 60, which represents a neutral or indecisive market condition. When the RSI is within this range, it indicates that the market lacks clear directional momentum, making it a riskier environment for trend-following trades. The script shades this region on the chart, visually warning traders to avoid initiating trades during these periods.
Visual Table Display:
To improve clarity, the script includes a table that shows key values directly on the chart:
RSI 1 (15-minute): Displays the current RSI value for the 15-minute timeframe.
RSI 2 (1-hour): Displays the current RSI value for the 1-hour timeframe.
RSI 3 (Daily): Displays the current RSI value for the Daily timeframe.
ADX: Displays the current ADX value, with color-coding to show whether the trend is strengthening (green) or weakening (red).
Long/Short Signal: This final cell in the table shows whether a potential Long or Short signal is currently active based on RSI crossovers and ADX strength.
The table can be repositioned on the chart according to user preference (Top Right, Top Left, Bottom Right, Bottom Left).
Possible Entry and Exit Points:
Long Entry Criteria:
RSI 1 crosses above RSI 2.
RSI 1 is above its 9-period moving average (to confirm upward momentum).
When these conditions are met, the script will display a potential Long signal in the table, and an alert will be triggered if enabled.
Note : ADX is rising, indicating that the trend strength is increasing. ADX is falling, indicating that the trend is weakening.
Short Entry Criteria:
RSI 1 (15-minute) crosses below RSI 2 (1-hour).
RSI 1 is below its 9-period moving average (to confirm downward momentum).
Note : ADX is rising, indicating that the trend strength is increasing. ADX is falling, indicating that the trend is weakening.
When these conditions are met, the script will display a potential Short signal in the table, and an alert will be triggered if enabled.
Exit Criteria:
Exit a Long position when a Short signal is generated or when a yellow candle appears, which indicates that momentum is weakening.
Exit a Short position when a Long signal is generated or when a yellow candle appears.
Customizable Inputs:
This script offers several customization options for users:
RSI Length and Timeframes:
Adjust the length of the RSI calculation and the timeframes for each RSI (default: 15-minute, 1-hour, Daily). This allows traders to tailor the script to different market conditions and assets.
Smoothing Method:
Choose how the RSI values are smoothed (None, SMA, EMA, WMA, RMA) and adjust the smoothing factor.
ADX Settings:
Toggle the ADX on/off, and adjust the smoothing factor and DI length to match your preferred trend strength calculation.
Divergence Detection:
Enable or disable divergence detection and set the range of bars for detecting divergence patterns.
Table Position:
Change the location of the table on the chart (Top Right, Top Left, Bottom Right, Bottom Left).
Note : I have used RSI 1 = 3 Minutes, RSI 2 = 15 Minutes and RSI 3 = 1 Hour as input in the shown chart.
Important Notes:
This script is intended for educational purposes only. It is designed to help traders learn how to combine RSI and ADX to analyze trends and momentum, but it should not be used as financial advice or a guaranteed trading strategy.
Always test the script in a demo environment before using it in live trading to understand how it behaves with different assets and timeframes.
Proper risk management and additional confirmations should be used alongside this indicator for effective trading.

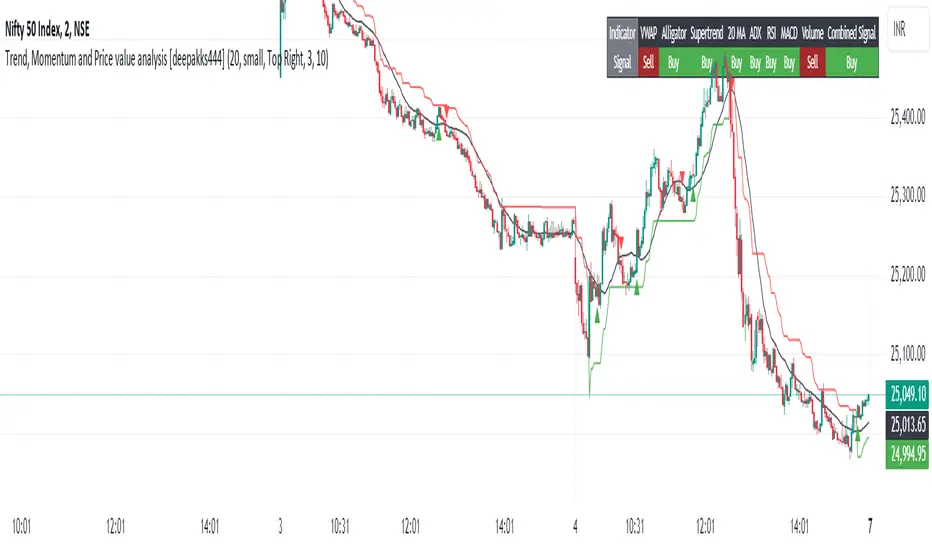
Trend, Momentum and Price value analysis [deepakks444]Trend, Momentum, and Price Value Analysis
This indicator combines several key technical analysis tools to help traders evaluate the market's trend strength, momentum, and overall price behavior. It uses a variety of signals to generate a "Buy," "Sell," or "No Clear Indication" based on multiple indicators and plots them directly on the chart. A customizable table also summarizes these signals, making it easy to interpret the market conditions in real-time.
Key Features:
VWAP (Volume-Weighted Average Price): Indicates whether the price is above or below the VWAP line, helping to identify buying or selling opportunities based on fair value.
Alligator Indicator: Utilizes three simple moving averages (SMAs) to track trend direction, providing a clear "Buy" or "Sell" signal when the averages are aligned.
Supertrend: A widely-used trend-following indicator, this script identifies potential buy or sell zones based on the price's relationship with the Supertrend line.
20-period Moving Average (MA): A simple moving average to track the overall trend direction. The signal is based on the price crossing above or below the MA.
ADX (Average Directional Index): Measures the strength of the trend. A reading above 25 indicates a "Buy" signal, while a reading below suggests a "Sell."
RSI (Relative Strength Index): Generates a buy signal when RSI exceeds 60 and a sell signal when it drops below 40. Values between 40 and 60 indicate a neutral condition.
MACD (Moving Average Convergence Divergence): Provides a signal for buying when the MACD line crosses above the signal line, and selling when it crosses below.
Volume Signal: Compares current volume against the 20-period moving average to identify significant volume spikes. This helps in determining if the market is supported by strong volume.
Customization Options:
Moving Average Length: Customize the 20-period MA length to better fit your trading style or the asset you’re analyzing.
Supertrend Settings: Adjust the Supertrend factor and ATR period for different timeframes or volatility environments.
Table Position: Customize where the signal table is displayed on the chart (Top Right, Top Left, Bottom Right, or Bottom Left).
Table Appearance: Set the table background color and choose between small or tiny text size for better readability.
Signal Summary:
The indicator computes a combined signal based on the number of "Buy" or "Sell" signals from the individual indicators. If 5 or more indicators suggest a "Buy" or "Sell," the table will display a combined signal for easier decision-making. This feature consolidates the signals into one straightforward output, helping you filter noise and act on clear trends.
Table Display:
The customizable table organizes the signals of the key indicators, showing:
Indicator: Lists all the indicators in use, such as VWAP, Alligator, Supertrend, etc.
Signal: Displays "Buy," "Sell," or "Neutral" for each indicator based on the current market conditions.
Intended Use:
This script is designed to help traders monitor multiple technical indicators at once, giving them a clearer view of the market’s trend strength, momentum, and volatility. While it simplifies the process of interpreting various signals, users should use it in combination with their own research and risk management strategies.
Disclaimer: This script is for educational purposes only and should not be considered financial advice. All trading involves risk, and the performance of an indicator in the past does not guarantee future results. Always perform due diligence and use proper risk management techniques.
3 days ago
Release Notes
A "Buy" triangle is plotted below the bar if the signal changes to "Buy".
A "Sell" triangle is plotted above the bar if the signal changes to "Sell".
Script Name: Trend, Momentum, and Price Value Analysis
The Trend, Momentum, and Price Value Analysis script provides a multi-faceted approach to market analysis, combining several technical indicators into a single tool. This script offers an easy-to-interpret table summarizing various indicator signals, along with visual buy/sell signals on the chart.
Key Features:
VWAP (Volume Weighted Average Price):
The VWAP provides insights into whether the current price is above or below the average weighted price, helping traders identify potential buy or sell opportunities.
Alligator Indicator (Simplified):
Using three simple moving averages (SMAs), this tool helps identify the beginning of trends and potential buy/sell zones based on the Alligator jaw, teeth, and lips.
Supertrend:
A trend-following indicator that determines whether the market is in a bullish or bearish phase based on ATR and factor inputs. The Supertrend line is plotted on the chart.
20-period Moving Average (MA):
A basic moving average that assists in gauging price direction and the overall trend.
ADX (Average Directional Index):
Helps identify the strength of a trend. A value above 25 indicates a strong trend.
RSI (Relative Strength Index):
Measures momentum by identifying overbought and oversold conditions. A signal is triggered when RSI is above 60 (buy) or below 40 (sell).
MACD (Moving Average Convergence Divergence):
A momentum indicator that provides signals when the MACD line crosses the signal line.
Volume Signal:
Compares the current volume with a 20-period average to determine if volume supports the current trend direction.
Signal Table:
A table is generated on the chart, displaying real-time signals from each of the above indicators. The table is customizable with background colors and text sizes.
The position of the table can be set to any corner of the chart for convenience.
Combined Signal Logic:
The script calculates a Combined Signal based on the majority of buy or sell signals across all the indicators. If 5 or more indicators give a buy or sell signal, a combined signal is generated.
Buy/Sell Signal Plots:
The script plots buy (green triangle) and sell (red triangle) signals on the chart based on the combined signal when transitioning from a previous opposite signal.
Customizable Inputs:
Users can customize the length of the moving averages, adjust the background and text colors of the table, and choose the position of the table on the chart.