Ortalama Yönsel Endeks (ADX)


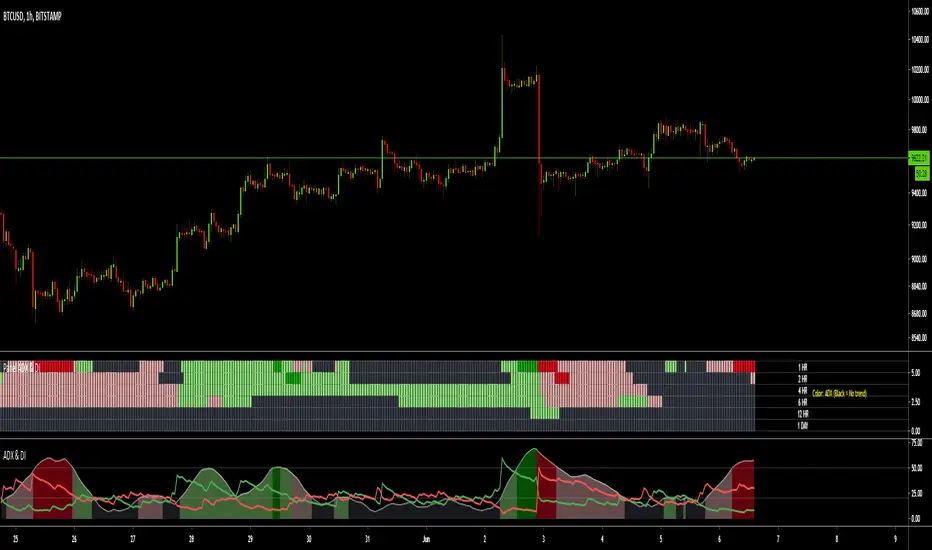
MTF ADX & DI - Monitoring PanelMonitoring panel showing the ADX (Average Directional Index) & DMI (Directional Movement Index) as color code for 6 different timeframes.
This gives a very easy overview on the current state of the market and if it is trending.
- ADX basically describes the strength of a Trend
- DMI give indication on the direction of the trend, usually shown as +DI and -DI
Meanings of the Colors:
ADX is below Low Threshold (no trend) : Black
ADX is above Low Threshold and DI is positive (weak bullish trend) : Light Green
ADX is above High Threshold and DI is positive (strong bullish trend) : Dark Green
ADX is above Low Threshold and DI is negative (weak bearish trend) : Light Red
ADX is above High Threshold and DI is negative (strong bearish trend) : Dark Red
- Low Threshold (default = 20) and High Threshold (default = 50) can be changed in the settings
- Timeframes can be changed, but the description labels are currently hardcoded - if you want to change it, just copy the script and change them
- Currently there are two additional timeframes commented in the code - if you want to use them, just copy the script and uncomment them
Have fun and as always I am open for constructive feedback.
Cheers!
LIZ ADX+DMIThe thick lines represent ADX .
When the volatility increases, it faces up and the color changes from gray to green.
When the background is gray and starts to turn green from below the horizontal line of reference value of 20, the volatility increases, indicating that the environment is becoming easier to trade.
When ADX rises and then peaks out, the line goes down and the previously green line changes to gray.
This means that the trend that was going on before is now over.People who hold positions use them to sign off their hands.
Also, those who want to see the trend change and build a new position with a backstop can use it to sign their entries.
When the background is gray (due to the deterioration of ADX ), it indicates that the volatility is low, there is no value width, and the direction is unclear, so it's not a good time to trade.
The two thin lines, red and blue, are DMI.A red line at the top and a blue line at the bottom indicates that the buying power is dominant, and the gap between the two lines is painted red.
On the other hand, if the blue line is up and the red line is down, it shows that the selling power is superior and it is painted blue.
When the two ADX lines intersect, and the color between the lines is changing from red to blue or blue to red, it indicates that the buyer's advantage has changed.
You can look at when the line crosses, and then enter in the new direction of dominance and build a position.
You can also determine that your position is in line with the market flow if it is in line with your current predominance.
However, in the opposite case, it suggests that the position you have is not in the right direction.
When two DMI lines are crossed frequently, it indicates a range or random rate.
In such cases, the background is often gray, indicating that it is difficult to make a profit in trade.
If you are interested in the invitation-only indicator, please contact us on private chat.
太い線はADXを表してます。
ボラティリティーが上昇すると上を向き、色がグレーから緑に変化します。
背景がグレーの期間で、水平線で示す基準値20より低い位置から上を向き緑に変化し始める時、ボラティリティーが上昇し、トレードしやすい環境になりつつある事を示唆しています。
ADXが上昇し、やがてピークアウトするとラインが下を向き、それまで緑だったラインの色がグレーに変わります。これは、それまで続いていたトレンドが一旦終了した事を意味します。
ポジションを持っていた人は、手仕舞いのサインに使います。
また、トレンドの転換を確認し、逆張りで新規ポジションの構築を狙っている人はエントリーのサインに使えます。
ADXが低下しているせいで,背景がグレーになっている時は,ボラティリティーが低下しており、値幅がなく、方向性がはっきりしないという理由で取引に向いていない時期である事を示します。
赤、青2本の細いラインはDMIです。赤いラインが上、青いラインが下の時は買い勢力が優勢である事を示し、2本の線の間が赤に塗られます。
反対に青いラインが上、赤いラインが下の時は売り勢力が優勢である事を示し、青に塗られます。
2本のADXラインが交差し、線の間に塗られた色が、
赤から青、または青から赤に変化する時、買い方売り方の優劣が入れ替わった事を示唆します。
ラインがクロスするタイミングを見て、新しく優勢になった方向にエントリーし、ポジションを構築できます。
また、自分が既に持っているポジションが、現在優勢である方向と一致している時はマーケットの流れに合っていると判断できます。
しかし反対の時は、あなたが持っているポジションの方向が合っていない事を示唆しています。
2本のDMIラインが頻繁にクロスしている時は、レンジ相場やランダム相場である事を示唆します。
そのような時は背景もグレーになっている時が多く、トレードで利益を出すのが難しい環境である事を表しています。
招待専用インジに興味ある方はプライベートチャットに連絡をください。

PROFIT+ V3 ALERTThis is an alert indicator for PROFIT+ V3 strategy .
Add it to your chart with the strategy and create alerts to
receive notifications when Buy and Sell signals are generated.
To receive access for the strategy and this indicator, please pm me or contact
me at telegram from the link below.
----------------------------------------------------------------------------
Это алерт индикатор к стратегии PROFIT+ V3 .
Используйте индикатор со стратегией и создавайте алерты
для получения уведомлений когда генерируются сигналы
на покупку и продажу.
Для получения доступа к стратегии и к данному индикатору,
пожалуйста, напишите мне в лс или в телеграм через ссылку ниже.

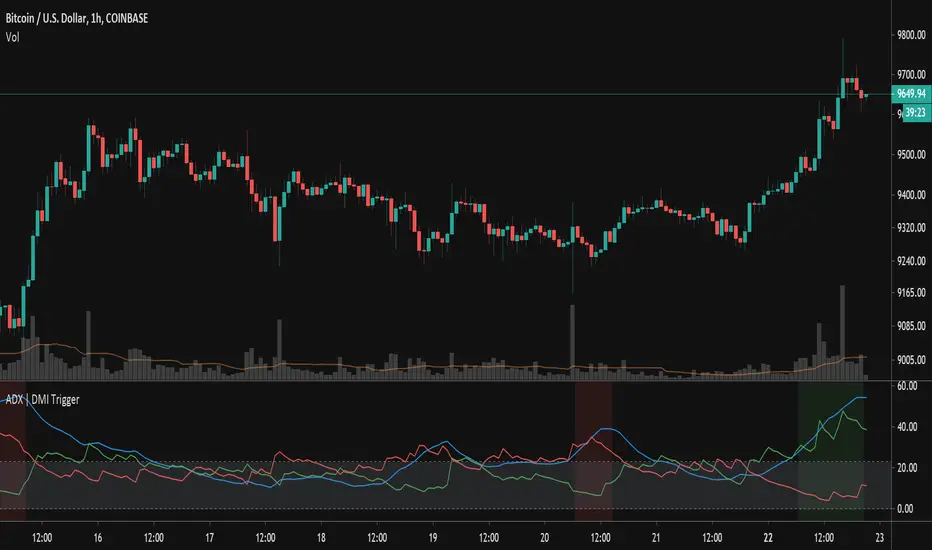
ADX TriggerThis script fires off a buy alert when the ADX is rising and above a user-defined value (default 25). It fires off a sell signal when ADX starts sloping downward. The lookback period to determine if it is sloping up/down (in bars) is also configurable by the user. The plot highlights green when there is a "go" signal. Thanks to @9e52f12edd034d28bdd5544e7ff92e for the idea.
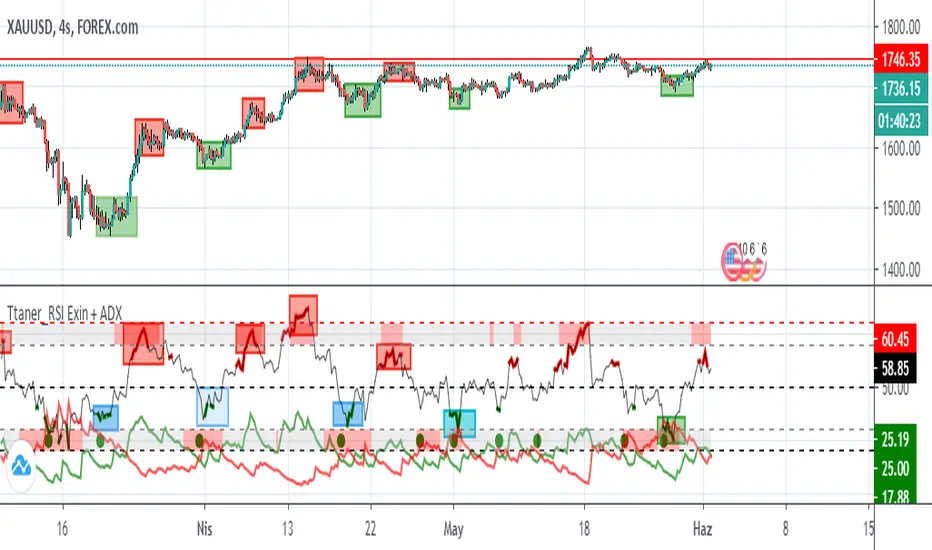
Relative Strength Index Exin + ADX Hello friends, I wish you all the best.
Relative Strength İndex + Adx coding.
I'd like to talk a little bit about how it works
We can say that the ascension action begins when the green line rises above the red line
you can measure the success rate of this indicator from the past.
RSI The green dots at the bottom show reception.
RSI The red dots on the top indicate that sales may come.
RSI means purchase when the bottom is green
When the RSI top line turns red, it means sales
If my sharing has helped you, you can like and support it. Stay tuned to be notified of new analysis and indicators
DMA: ADX L30A modified version of the ADX indicator
Indicator average directional movement ( ADX ) helps traders determine the strength of the trend, not its actual direction. It can be used to determine whether changes in the market or starts a new trend. It refers to the average directional movement Index (DMI), and, in fact, included DMI ADX line . The oscillator ranges from 0 to 100, where high values noted a strong trend and low readings indicate a weak trend. It is often combined with directional indicators. The indicator was developed by Welles Wilder, who has created several leading trading indicators.
Disconnected the lines DI and set the horizontal level 30
-----
Модифицированная версия индикатора ADX .
Индикатор среднего направленного движения ( ADX ) помогает трейдерам определить силу тренда, а не его фактическое направление. Его можно использовать, чтобы выяснить, меняется ли рынок, или начинается новый тренд. Он относится к Индексу направленного движения (DMI) и, фактически, в DMI включена линия ADX . Осциллятор колеблется от 0 до 100, где высокие показания отмечают сильный тренд, а низкие показания указывают на слабый тренд. Он часто комбинируется с направленными индикаторами. Индикатор был разработан Уэллсом Уайлдером, который создал несколько ведущих торговых индикаторов.
Отключены линии DI и установлен горизонтальный уровень на значении 30

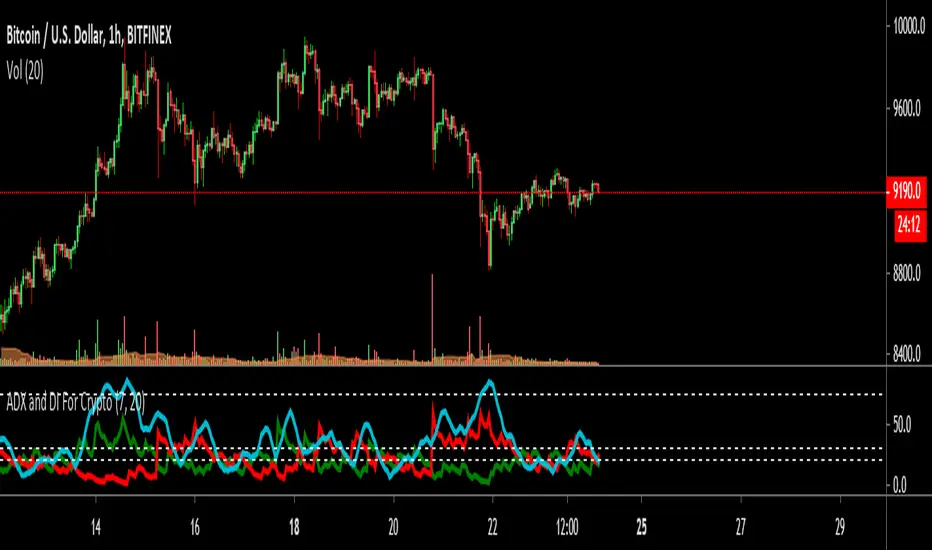
ADX and DI For Cryptocustomized version to add my favourite settings for crypto
Best time frame is daily followed by 4H
ADX Near 20 or less means trend is choppy and weak
ADX Cross over 30 means trend is starting to gain momentum
ADX Near 75 means momentum is near maximum, trend needs to rest for a while ( The area between 70~90 )
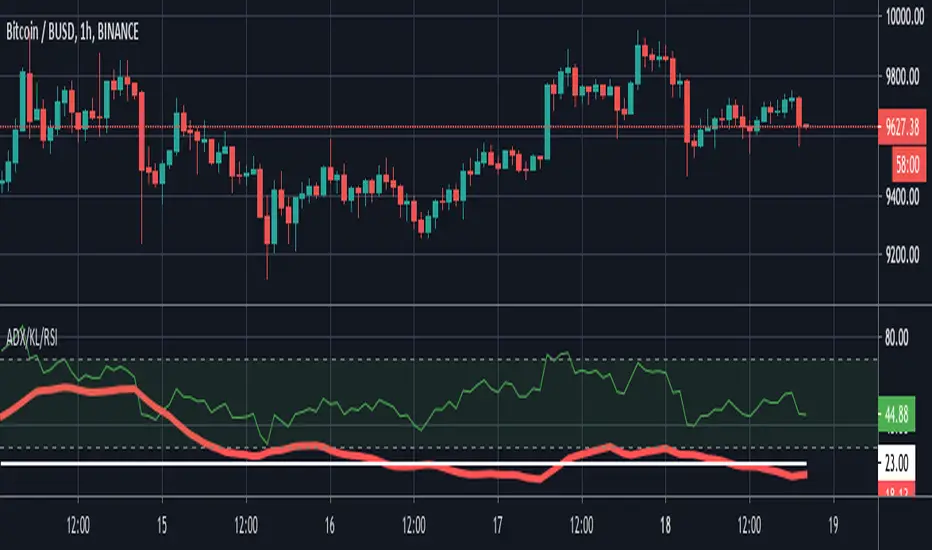
ADX + Keylevel + RSIThis script is a combination of the Average Directional Movement Index (ADX) help to determine the trend strength with a key level and Relative Strength Index is an oscillator that measures the speed and change of price movements.
ADX + KeylevelThe Average Directional Movement Index (ADX) help to determine the trend strength with a key level.

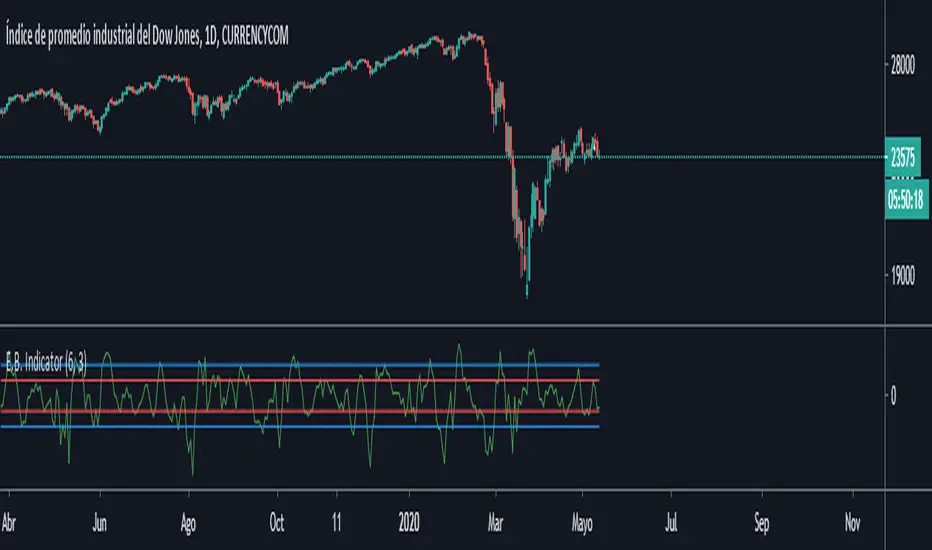
E.B. IndicatorThis is a custom indicator. When the green line crosses above the level 6, it's going to sell the stock. When it crosses down -6, it's going to buy the stock. You can change the level's number to adapt it to any asset.
It works for US30, or any Dow's Futures . But you can adapt it to any market, FOREX/Crypto/Stocks.
Also it works better in 5/15 min chart, but you can adapt it to any resolution too.
EntryModel is the level to make Buy and Sell transactions.
ExitModel is the level to close transactions.
If you would like to have the access, just DM me!
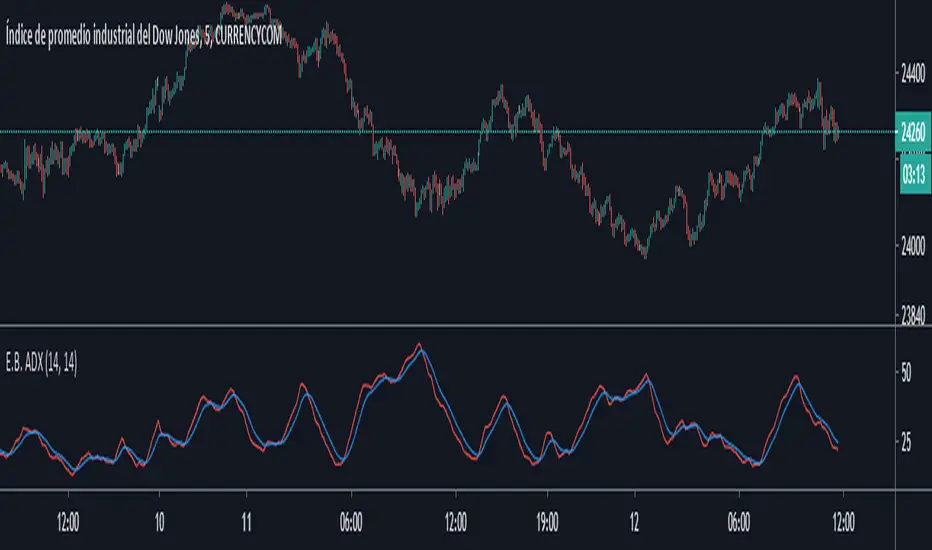
E.B. ADXThis is a simple ADX with an EMA (9) that we use in our Strategy.
When the Red line crosses above the ema, it will start a new "Trend Scenario".
When the red line crosses down the ema, it will start a market without trend.
If you want the indicator just DM me!
Jackrabbit.modulus.ADXThis is the ADX indicator for the Jackrabbit suite and modulus framework.
This indicator supports differential timeframe analysis and confirmational bias. Timeframes supported:
1 Second, 5 Seconds, 15 Seconds, 30 Seconds, 1 Minute, 5 Minutes, 15 Minutes, 30 Minutes, 45 Minutes, 1 Hour, 2 Hours, 3 Hours, 4 Hours, 6 Hours, 8 Hours, 12 Hours, and 1 Day
The main indicatior and the confirmational indicator can both be individually tuned for the length of the ADX signal. When confirmation bias is enanled, its chart is inverted below 0.
The Jackrabbit modulus framework is a plug in play paradigm built to operate through TradingView's indicator on indicatior (IoI) functionality. As such, this script receives a signal line from the previous script in the IoI chain, and evaluates the buy/sell signals appropriate to the current analysis. The results are either combined with the signal line, or used as confirmation to the signal line. A new signal line is generated for the next script in the link.
Buy/Sell alerts are produced, but this script is not designed or meant to function outside my framework.
By default, the signal line is visible and the charts are turned off. Signal line visibility is controlled by the Style tab, and the charts display is controlled by the indicator settings tab.
This script is by invitation only. To learn more about accessing this script, please see my signature or send me a PM. Thank you.

unRekt - KISS AddieKISS Addie is the ADX and DI+- indicator and is part of the 'keeping it simple' series. ADX is your Average Directional Index and DI is you Directional Movement Indicator.
ADX - Will show the strength of the trend regardless of direction.
00 - 10 : No trend
10 - 20 : Transitioning trend
20 - 40 : Trending
40 - 99 : Exhausted (Can also be considered a stronger trend the higher it goes, but look to exit position once it begins to downward slope and pay attention to DI spread)
DI - Will show the direction of movement. This indicator includes two views of the DI. the DI+ and DI- crossover and a histogram of the spread between the two.
Bullish : Green crosses over red.
Bearish : Red crosses over green.

PROFIT + ALERTS V2This is an Alert indicator for PROFIT + strategy.
Use it with the strategy to create and receive notifications when the strategy generates buy / sell signals.
To get access to the indicator and its strategy pm me.
------------------------------------------------------
Это алерт индикатор для стратегии PROFIT +
для получения уведомлений когда стратегия генерирует buy / sell сигналы.
Для получения доступа к индикатору и стратегии пишите в личные сообщения.

Stochastic Pop and Drop Signals [Bitduke]It's a long/short signals for modified Stochastic Pop and Drop strategy.
About
It's the strategy of 2 indicators: Stochastic Oscillator to define the bias and Average Directional Index to confirm it.
Signals
Strategy flips long / short depending of indicator signals. There can be multiple signals of the same type, for example, 2 longs in a row, only the first of them matters, others you should handle in your websocket script or manually.
Testing
Tested on different sources for data, oscillator periods and different levels in relation to the crypto market.
So, it shows good results with two tight thresholds at 55 and 45 level.
The bar chart below the defining the bullish and bearish periods (green and red) and gives a signal to enter the trade (purple bars).
Backtesting
Backtested on XBTUSD , BTCPERP ( FTX ) pairs. You may notice it shows good results on 3h timeframe.
Relatively low drawdown
~ 10% (from 2019 to date) FTX
~ 22% (4 years from 2016) Bitmex
Bitmex 3h (2017 - 2020) :
i.imgur.com
FTX 3h (2019 - 2020):
i.imgur.com
Possible Improvements
- Regarding trading algorithm it would be good to check with strategy with ADX somehow. Maybe for the better entries
- As for Risk Management system, it can be improved by adding trailing stop to the strategy.
Link: school.stockcharts.com

Estrategia de Monitor - RSI/EMAThis indicator, competes the signals of two of the most important and reliable indicators for monitoring price trends, the Squeeze Monitor and the RSI.
For a better visualization of the relationship of the indicators with the price, the Squeeze Monitor is presented in colored bars that represent the trend of the indicator. The RSI is combined with the EMA of the RSI that supports its directionality.
As additional support for decision making, the ADX is also plotted, as an element to project the force of the next movement.
The indicator settings are presented in the configuration of the indicator. The following parameters can be adjusted there:
** Monitor Parameters **
Monitor Length Squeeze -> "Long. Monitor"
** ADX parameters **
ADX Longitug -> "Long. ADX"
ADX Smoother -> "Suavizador ADX"
ADX Variation Factor -> "Factor Var. ADX"
This parameter defines the minimum variation for the
ADX address highlighting
** RSI parameters **
RSI Length -> "Long. RSI"
RSI Smoothing -> "Suavizador RSI"
RSI EMA Length -> "Long. EMA del RSI"
Finally, the Script consolidates the information, based on the trends of the indicators, and changes the color of the candle body. The color code considers Green for the uptrend, Red for the Downtrend and Yellow in transition processes (not operable).

Directional Movement Index TrendThis DMI I modified to see the trend more clearly, and the ADX line changes according to the trend force, which is perfectly configurable, the configuration I left my default configuration, in case you want to modify it because you see the trend in different values, feel free, and basically the columns are the average of DI and also indicate the trend more clearly.
/////////////////////////////////////////////////////////////////////////////////////////////////////////////////////////////////////////////////////////////////////////////////////
Esse DMI eu modifiquei para ver a tendência com maior clareza, e a linha do ADX ela muda de acordo com a força de tendência, a qual é perfeitamente configurável, a configuração eu deixei a minha configuração padrão, caso você queira modificar porque você vê a tendência em valores diferentes, sinta-se livre, e basicamente as colunas são a média de DI e indicam também com mais clareza a tendência.

Wolfs ADX + DII have created an alternative visualisation of the ADX + DI indicator created by MasaNakamura, credits to them for providing the source code! :-)
The histogram represents the distance between the DI+ and the DI-. The crossing of the histogram is equal to the crossing of the DI lines.
The ADX line is coloured based on the threshold.
This creates a clean representation of the ADX + DI.

[PX] ADX BoxesHello guys,
today I would like to share an indicator that I had in my mind for quite some time. I call it ADX Boxes.
How does it work?
What the indicator does is very simple. Whenever the ADX falls below a certain threshold (which can be managed in the user input settings) a box will appear. The box will continue to grow as long as the ADX stays below the threshold. Once the ADX goes back above the threshold, the box will stop growing and will set its right border.
There are two modes, which can be used to determine the upper and lower border of the box. The first one is called "Extremes", which plots the borders the highest high and lowest low for the range below the threshold. The second one is called "Avg. High/Low", which plots the borders at the average high and average low within the range.
Furthermore, the indicator contains an option to show the average value of the detected range below the ADX threshold.
Just like all my other indicator scripts, this one comes with different styling options for boxes in progress, settled boxes and the average value.
Hopefully, some of you find it useful.
Make sure you leave a follow and a like :)
Happy trading!!

ORTI Average Directional Index (Static Timeframe Multi-Period)The " ORTI Average Directional Index (Static Timeframe Multi-Period) " is now a public script, based into an existing study named " Average Directional Index ", but with some better functions about time frame and its measurament. As a redesigned and recalculated set of the common plotted average, a technical analysis metric.
The cherry on the top for this version is, when you want to get a predetermined count in (ranges) units of time, as: minutes, hours or days, in any graph you could get a static average, and this count will be automatically respected. For example, an average could be configurated to know a trend per day, week or month... or whatever comes to mind, and at every single chart that you move through (5m, 15m, 1h, 4h, etc), you will see the same average to make your own "trend analysis" into a micro/macro market view.
But now, with the option to convert the "Simple Moving Average" to adapt into 9 different kinds of "Moving Averages", to have a much more robust indicator which in turn would serve both as "Bollinger Bands" and by any of the most used "Moving Averages", a hybrid basically.
The following options to convert the "Simple Moving Average" ( SMA ) to:
• Double Exponential Moving Average ( DEMA )
• Exponential Moving Average ( EMA )
• Hull Moving Average ( HMA )
• Least Square Moving Average ( LSMA )
• Running Moving Average ( RMA )
• Smoothed Moving Average ( SMMA )
• Volume-weighted Moving Average ( VWMA )
• Weighted Moving Average ( WMA )
The Average Directional Index ( ADX ) along with the Negative Directional Indicator ( -DI ) and the Positive Directional Indicator ( +DI ) are momentum strength indicators that evolved for use in stock trading. Commodities trader J. Welles Wilder pioneered their use. Technical traders who use charting techniques want to know when first spotting a shifting trend how strong that trend is and how likely it is to sustain itself over time. The ADX helps investors determine trend strength as they plan their investment strategies.
For more technical information look at Investopedia .
Note: The previous calculation example is not the default, the parameters can be adjusted according to the criteria of the merchant.

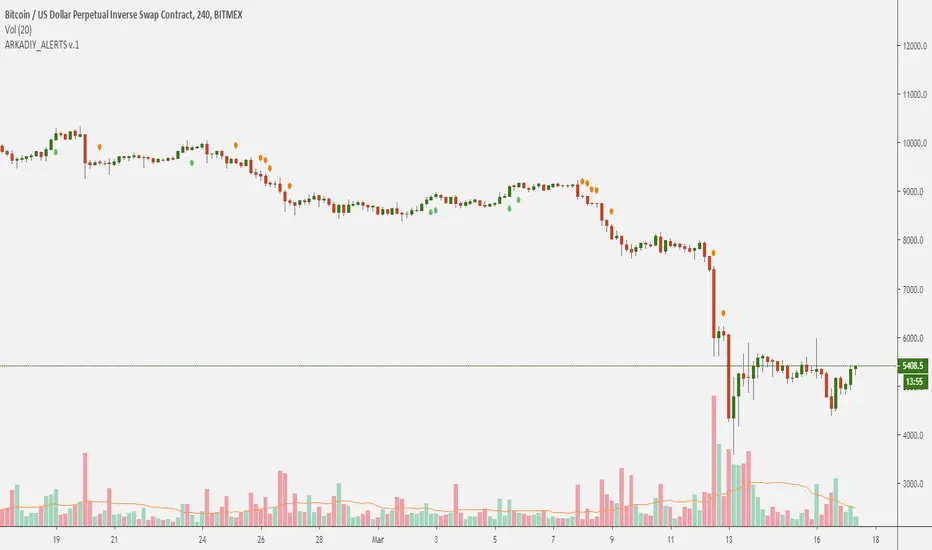
ARKADIY_ALERTS v1.0
This is an alert indicator for ARKADIY v 1.0 strategy .
Use it along with the strategy to receive alerts when the strategy generates buy/sell signals.
The strategy and the alert indicator are invite only.
To get access please write in coomments or pm me.
------------------------------------------------------------------
Данный индикатор является алертом для стратегии ARKADIY v 1.0 .
Используйте его вместе со стратегией для получение уведомлений когда будут генерироваться сигналы на покупку/продажу.
Индикатор и стратегия ограничены по доступу.
Для получения доступа пишите в комментарии и в сообщениях.