VuManChu Strategy [ADX + Vol + Risk] - Good for BTC- The strategy uses the VuManChu WaveTrend oscillator
- Before entering any trade, the ADX filter must show a reading above 25. For more reliable momentum moves
- Three-Layer Exit System:
Fixed Stop Loss (3%): Hard stop placed 3% below entry for longs (above for shorts) to limit maximum loss per trade. This accommodates typical BTC 5-minute volatility without premature stopouts.
Take Profit Target (9%): Fixed profit target at 9% providing a 1:3 risk-reward ratio. This means you only need a 40-50% win rate to be profitable overall.
Conditional Trailing Stop: The most sophisticated protection - a trailing stop that only activates after the trade reaches 4.5% profit (halfway to target). Once activated, it trails price by 2%, locking in gains while still allowing the trade to reach the full 9% target.
Ortalama Yönsel Endeks (ADX)

Monthly DI+ & RSI StrategyOverview This strategy is designed to capture significant trend reversals and continuations on the Monthly timeframe. It combines the trend-following capability of the Directional Movement Index (DMI) with the fast momentum detection of RSI (Period 6).
Core Logic The strategy triggers a long position based on a dual-confirmation system. It looks for a specific "handshake" between Trend (DI) and Momentum (RSI).
Entry Conditions (OR Logic) A Buy signal is generated if EITHER of the following occurs:
Trend Trigger: DI+ crosses over DI- (while RSI is already bullish, trading above its SMA).
Momentum Trigger: RSI(6) crosses over RSI SMA(14) (while the trend is already bullish, with DI+ > DI-).
Exit Condition (Stop Loss)
Trend Reversal: The position is closed immediately if DI- crosses over DI+, indicating the bullish trend has been invalidated.
Default Settings
Timeframe: Optimized for 1M (Monthly) charts.
RSI: Length 6
RSI SMA: Length 14
DMI: Length 14 / Smoothing 14
Risk Warning This script is for educational purposes only. Past performance does not guarantee future results. Always backtest on your specific asset classes before trading.

Trend Vector Pro v2.0Trend Vector Pro v2.0
👨💻 Developed by: Mohammed Bedaiwi
💡 Strategy Overview & Coherence
Trend Vector Pro (TVPro) is a momentum-based trend & reversal strategy that uses a custom smoothed oscillator, an optional ADX filter, and classic Pivot Points to create a single, coherent trading framework.
Instead of stacking random indicators, TVPro is built around these integrated components:
A custom momentum engine (signal generation)
An optional ADX filter (trend quality control)
Daily Pivot Points (context, targets & S/R)
Swing-based “Golden Bar” trailing stops (trade management)
Optional extended bar detection (overextension alerts)
All parts are designed to work together and are documented below to address originality & usefulness requirements.
🔍 Core Components & Justification
1. Custom Momentum Engine (Main Signal Source)
TVPro’s engine is a custom oscillator derived from the bar midpoint ( hl2 ), similar in spirit to the Awesome Oscillator but adapted and fully integrated into the strategy. It measures velocity and acceleration of price, letting the script distinguish between strong impulses, weakening trends, and pure noise.
2. ADX Filter (Trend Strength Validation – Optional)
Uses Average Directional Index (ADX) as a gatekeeper.
Why this matters: This prevents the strategy from firing signals in choppy, non-trending environments (when ADX is below the threshold) and keeps trades focused on periods of clear directional strength.
3. Classic Pivot Points (Context & Targets)
Calculates Daily Pivot Points ( PP, R1-R3, S1-S3 ) via request.security() using prior session data.
Why this matters: Momentum gives the signal, ADX validates the environment, and Pivots add external structure for risk and target planning. This is a designed interaction, not a random mashup.
🧭 Trend State Logic (5-State Bar Coloring)
The strategy uses the momentum's value + slope to define five states, turning the chart into a visual momentum map:
🟢 STRONG BULL (Bright Green): Momentum accelerating UP. → Strong upside impulse.
🌲 WEAK BULL (Dark Green): Momentum decelerating DOWN (while positive). → Pullback/pause zone.
🔴 STRONG BEAR (Bright Red): Momentum accelerating DOWN. → Strong downside impulse.
🍷 WEAK BEAR (Dark Red): Momentum decelerating UP (while negative). → Rally/short-covering zone.
🔵 NEUTRAL / CHOP (Cyan): Momentum is near zero (based on noise threshold). → Consolidation / low volatility.
🎯 Signal Logic Modes
TVPro provides two selectable entry styles, controlled by input:
Reversals Only (Cleaner Mode – Default): Targets trend flips. Entry triggers when the current state is Bullish (or Bearish) and the previous state was not. This reduces noise and over-trading.
All Strong Pulses (Aggressive Mode): Targets acceleration phases. Entry triggers when the bar turns to STRONG BULL or STRONG BEAR after any other state. This mode produces more trades.
📌 Risk Management Tools
🟡 Golden Bars – Trailing Stops: Yellow “Trail” Arrows mark confirmed Swing Highs/Lows. These are used as logical trailing stop levels based on market structure.
Extended Bars: Detects when price closes outside a 2-standard-deviation channel, flagging overextension where a pullback is more likely.
Pivot Points: Used as external targets for Take Profit and structural stop placement.
⚙️ Strategy Defaults (Crucial for Publication Compliance)
To keep backtest results realistic and in line with House Rules, TVPro is published with the following fixed default settings:
Order Size: 5% of equity per trade ( default_qty_value = 5 )
Commission: 0.04% per order ( commission_value = 0.04 )
Slippage: 2 ticks ( slippage = 2 )
Initial Capital: 10,000
📘 How to Trade with Trend Vector Pro
Entry: Take Long when a Long signal appears and confirm the bar is Green (Bull state). Short for Red (Bear state).
Stop Loss: Place the initial SL near the latest swing High/Low, or near a relevant Pivot level.
Trade Management: Follow Golden (Trail) Arrows to trail your stop behind structure.
Exits: Exit when: the trailing stop is hit, Price reaches a major Pivot level, or an opposite signal prints.
🛑 Disclaimer
This script is for educational purposes only and does not constitute financial advice. Past performance does not guarantee future results. Always forward-test and use proper risk management before applying any strategy to live trading.

Rawa_Trade_System_Vol_AdxThe strategy must be configured for each instrument separately; the basic configuration uses a trailing stop, a 4H timeframe, and excludes margin trading.

EMA Cross + RSI + ADX - Autotrade Strategy V2Overview
A versatile trend-following strategy combining EMA 9/21 crossovers with RSI momentum filtering and optional ADX trend strength confirmation. Designed for both cryptocurrency and traditional futures/options markets with built-in stop loss management and automated position reversals.
Key Features
Multi-Market Compatibility: Works on both crypto futures (Bitcoin, Ethereum) and traditional markets (NIFTY, Bank NIFTY, S&P 500 futures, equity options)
Triple Confirmation System: EMA crossover + RSI filter + ADX strength (optional)
Automated Risk Management: 2% stop loss with wick-touch detection
Position Auto-Reversal: Opposite signals automatically close and reverse positions
Webhook Ready: Six distinct alert messages for automation (Entry Buy/Sell, Close Long/Short, SL Hit Long/Short)
Performance Metrics
NIFTY Futures (15min): 50%+ win rate with ADX filter OFF
Crypto Markets: Requires extensive backtesting before live deployment
Optimal Timeframes: 15-minute to 1-hour charts (patience required for higher timeframes)
Strategy Logic
Entry Signals:
LONG: EMA 9 crosses above EMA 21 + RSI > 55 + ADX > 20 (if enabled)
SHORT: EMA 9 crosses below EMA 21 + RSI < 45 + ADX > 20 (if enabled)
Exit Signals:
Opposite EMA crossover (auto-closes current position)
Stop loss hit at 2% from entry price (tracks candle wicks)
Technical Indicators:
Fast EMA: 9-period (short-term trend)
Slow EMA: 21-period (primary trend)
RSI: 14-period with 55/45 thresholds (momentum confirmation)
ADX: 14-period with 20 threshold (trend strength filter - optional)
Market-Specific Settings
Traditional Markets (NIFTY, Bank NIFTY, S&P Futures, Options)
Recommended Settings:
ADX Filter: Turn OFF (less choppy, cleaner trends)
Timeframe: 15-minute chart
Win Rate: 50%+ on NIFTY Futures
Why No ADX: Traditional markets have more institutional participation and smoother price action, making ADX unnecessary
Cryptocurrency Markets (BTC, ETH, Altcoins)
Recommended Settings:
ADX Filter: Turn ON (ADX > 20)
Timeframe: 15-minute to 1-hour
Extensive backtesting required before live trading
Why ADX: Crypto markets are highly volatile and prone to false breakouts; ADX filters low-quality chop
Best Practices
✅ Backtest thoroughly on your specific instrument and timeframe
✅ Use larger timeframes (1H, 4H) for higher quality signals and better risk/reward
✅ Adjust RSI thresholds based on market volatility (try 52/48 for more signals, 60/40 for fewer but stronger)
✅ Monitor ADX effectiveness - disable for traditional markets, enable for crypto
✅ Proper position sizing - adjust default_qty_value based on your capital and instrument price
✅ Paper trade first - test for 2-4 weeks before risking real capital
Risk Management
Fixed 2% stop loss per trade (adjustable)
Stop loss tracks candle wicks for accurate execution
Positions auto-reverse on opposite signals (no manual intervention needed)
0.075% commission built into backtest (adjust for your broker)
Customization Options
All parameters are adjustable via inputs:
EMA periods (default: 9/21)
RSI length and thresholds (default: 14-period, 55/45 levels)
ADX length and threshold (default: 14-period, 20 threshold)
Stop loss percentage (default: 2%)
Webhook Automation
This strategy includes six distinct alert messages for automated trading:
"Entry Buy" - Long position opened
"Entry Sell" - Short position opened
"Close Long" - Long position closed on opposite crossover
"Close Short" - Short position closed on opposite crossover
"SL Hit Long" - Long stop loss triggered
"SL Hit Short" - Short stop loss triggered
Compatible with Delta Exchange, Binance Futures, 3Commas, Alertatron, and other webhook platforms.
Important Notes
⚠️ Crypto markets require extensive backtesting - volatility patterns differ significantly from traditional markets
⚠️ Higher timeframes = better results - 15min works but 1H/4H provide cleaner signals
⚠️ ADX toggle is critical - OFF for traditional markets, ON for crypto
⚠️ Not financial advice - always conduct your own research and use proper risk management
⚠️ Past performance ≠ future results - backtest results may not reflect live trading conditions
Disclaimer
This strategy is for educational and informational purposes only. Trading futures and options involves substantial risk of loss. Always backtest thoroughly, start with paper trading, and never risk more than you can afford to lose. The author assumes no responsibility for any trading losses incurred using this strategy.

Futures Fighter MO: Multi-Confluence Day Trading System ADX/SMI👋 Strategy Overview: The Multi-Confluence Mashup
The Futures Fighter MO is a comprehensive, multi-layered day trading strategy designed for experienced traders focusing on high-liquidity futures contracts (e.g., NQ, ES, R2K).
This strategy is a sophisticated mashup that uses the 1-minute chart for surgical entries while enforcing strict environmental filtering through higher-timeframe data. We aim to capture high-conviction moves only when multiple, uncorrelated signals align.
🧠 How the Logic Works (Concepts & Confluence)
Our logic is built on four pillars, which must align for a trade to be executed:
Primary Trend Filter
Indicators :
ADX/DMI (15-Minute Lookback)
Role :
Price action is filtered to ensure the ADX (17/14) is above 25, confirming a strong, prevailing market trend (Bullish or Bearish). Trades are strictly rejected during "Flat" (sideways) market regimes.
Entry Signal Types
The system uses multiple entry types:
- 🟢 Trend Long/Short: A breakout/rejection near the 200-Period EMA is confirmed by the primary ADX trend.
- 🔴 Engulfing Rejection: A strong signal when a Bullish/Bearish Engulfing or Doji prints near the long-term 500-Period EMA (emaGOD) while the Stochastic Momentum Index (SMI on 30M) is in an extreme overbought/oversold state (below $-40$ or above $40$).
Volatility & Volume Confirmation
Indicators: Average True Range (ATR) and 20-Period SMA of Volume
Role: Every entry requires a volume spike (Current Volume $> 1.5 \times$ SMA Volume) to confirm that the move is supported by significant liquidity. Volatility is tracked via ATR to define bar range and stop boundaries.
Structural Guardrails
Indicators: Daily Pivot Points (PP, S1-S3, R1-R3)
Role: Trades are disabled if the current bar's price range intersects with a Daily Pivot Point. This is a critical filter to avoid high-chop consolidation zones near key structural levels.
📊 Strategy Results & Required Disclosures
I strive to publish backtesting results that are transparent and realistic for the retail futures trader.
- Initial Capital: $50,000 - A realistic base for Mini/Micro futures contracts.
- Order Size: 1 Contract (Pyramiding up to 3) - Conservative risk relative to the account size.
- Commission: $0.11 USD per order - Represents realistic costs for low-cost brokers.
- Slippage: 2 Ticks - Accounts for expected market friction.
⚠️ Risk Management & Deviations
Stop-Loss: The strategy uses a dynamic stop-loss system where positions are closed upon a reversal (e.g., breaking the 50-Period EMA or failure to hold a Pivot Point), rather than a fixed tick-based stop. This is suited for experienced traders using a low relative risk (single Micro-contract entry) on a larger account. Users must confirm that the first entry's maximum potential loss remains below $10\%$ of their capital for compliance.
Trade Sample Size: Due to data limitations of the TradingView Essential plan (showing $\approx 50$ trades over 2 weeks), the sample size is under the ideal $100+$ target. Justification: This system is designed to generate signals across a portfolio of correlated futures markets (NQ, ES, R2K, Gold, Crude), meaning the real sample size for a user tracking the portfolio is significantly higher.
Drawdown Control: This strategy is designed for manual management. It requires the user to turn the script/alerts OFF after a significant drawdown and only reactivate it once a recovery trend is established externally.
The strategy uses a combination of dynamic trailing stops, structural support/resistance zones, and a fixed profit target to manage open positions.
🛑 Strategy Exit Logic
1. General Stop-Loss (Dynamic Trailing Stop)
These conditions act as the primary dynamic stop, closing the position if the market reverses past a key Moving Average (MA):
- Long Positions Closed When: The current bar's close crosses under the 50-Period EMA (emaLong).
- Short Positions Closed When: The current bar's close crosses above the 50-Period EMA (emaLong).
2. Profit Target (Fixed Percentage)
The script includes a general exit based on a user-defined profit percentage:
Take Profit Trigger: The position is closed when the currentProfitPercent meets or exceeds the input Profit Target (%) (default is 1.0% of the entry price).
3. Structural Exits (Daily Pivot Points)
These exits are high-priority, "close all" orders that trigger when the price fails to hold or reclaims a recent Daily Pivot Point, suggesting a failure of the current move.
- VR Close All - Long ($\sym{size} > 0$) - Price crosses under a Daily Resistance Level (R1, R2, or R3) minus 1 ATR within the last 10 bars. This indicates the current momentum failed to hold Resistance as support.
- VS Close All - Short ($\sym{size} < 0$) - Price crosses above a Daily Support Level (S1, S2, or S3) plus 1 ATR within the last 10 bars. This indicates the current momentum failed to hold Support as resistance.
4. Trend Failure Exit (Trend-Following Signals Only)
This exit protects against holding a position when the primary high-timeframe trend used for the entry has failed:
- Long Positions Closed When: The primary trend is no longer "bullish" for more than 2 consecutive bars (i.e., it turned "bearish" or "flat").
- Short Positions Closed When: The primary trend is no longer "bearish" for more than 2 consecutive bars (i.e., it turned "bullish" or "flat").
5. End of Day (EOD) Session Control
The final hard exits based on time:
- End of Session (EoS): At 11:30 AM, new trades are disabled (TradingDay := false). Open positions are kept.
- End of Day (EoD): At 1:30 PM, all remaining open positions are closed (strategy.close_all).
🤝 Development & Disclaimer
This script and description were created with assistance from Gemini and GitHub Copilot. My focus is on helping fellow real estate investors and day traders develop mechanically sound systems.
Disclaimer: This is for educational purposes only and does not constitute financial advice. Always abide by the Realtor Code and manage your own risk.

Turtle Strategy - Triple EMA Trend with ADX and ATRDescription
The Triple EMA Trend strategy is a directional momentum system built on the alignment of three exponential moving averages and a strong ADX confirmation filter. It is designed to capture established trends while maintaining disciplined risk management through ATR-based stops and targets.
Core Logic
The system activates only under high-trend conditions, defined by the Average Directional Index (ADX) exceeding a configurable threshold (default: 43).
A bullish setup occurs when the short-term EMA is above the mid-term EMA, which in turn is above the long-term EMA, and price trades above the fastest EMA.
A bearish setup is the mirror condition.
Execution Rules
Entry:
• Long when ADX confirms trend strength and EMA alignment is bullish.
• Short when ADX confirms trend strength and EMA alignment is bearish.
Exit:
• Stop Loss: 1.8 × ATR below (for longs) or above (for shorts) the entry price.
• Take Profit: 3.3 × ATR in the direction of the trade.
Both parameters are configurable.
Additional Features
• Start/end date inputs for controlled backtesting.
• Selective activation of long or short trades.
• Built-in commission and position sizing (percent of equity).
• Full visual representation of EMAs, ADX, stop-loss, and target levels.
This strategy emphasizes clean trend participation, strict entry qualification, and consistent reward-to-risk structure. Ideal for swing or medium-term testing across trending assets.

DNSE VN301!, ADX Momentum StrategyDiscover the tailored Pine Script for trading VN30F1M Futures Contracts intraday.
This strategy applies the Statistical Method (IQR) to break down the components of the ADX, calculating the threshold of "normal" momentum fluctuations in price to identify potential breakouts for entry and exit signals. The script automatically closes all positions by 14:30 to avoid overnight holdings.
www.tradingview.com
Settings & Backtest Results:
- Chart: 30-minute timeframe
- Initial capital: VND 100 million
- Position size: 4 contracts per trade (includes trading fees, excludes tax)
- Backtest period: Sep-2021 to Sep-2025
- Return: over 270% (with 5 ticks slippage)
- Trades executed: 1,000+
- Win rate: ~40%
- Profit factor: 1.2
Default Script Settings:
Calculates the acceleration of changes in the +DI and -DI components of the ADX, using IQR to define "normal" momentum fluctuations (adjustable via Lookback period).
Calculates the difference between each bar’s Open and Close prices, using IQR to define "normal" gaps (adjustable via Lookback period).
Entry & Exit Conditions:
Entry Long: Change in +DI or -DI > Avg IQR Value AND Close Price > Previous Close
Exit Long: (all 4 conditions must be met)
- Change in +DI or -DI > Avg IQR Value
- RSI < Previous RSI
- Close–Open Gap > Avg IQR Gap
- Close Price < Previous Close
Entry Short: Change in +DI or -DI > Avg IQR Value AND Close Price < Previous Close
Exit Short: (all 4 conditions must be met)
- Change in +DI or -DI > Avg IQR Value
- RSI > Previous RSI
- Close–Open Gap > Avg IQR Gap
- Close Price > Previous Close
Disclaimers:
Trading futures contracts carries a high degree of risk, and price movements can be highly volatile. This script is intended as a reference tool only. It should be used by individuals who fully understand futures trading, have assessed their own risk tolerance, and are knowledgeable about the strategy’s logic.
All investment decisions are the sole responsibility of the user. DNSE bears no liability for any potential losses incurred from applying this strategy in real trading. Past performance does not guarantee future results. Please contact us directly if you have specific questions about this script.

Supertrend [TradingConToto]Supertrend — ADX/DI + EMA Gap + Breakout (with Mobile UI)
What makes it original
Supertrend combines trend strength (ADX/DI), multi-timeframe bias (EMA63 and EMA 200D equivalent), a structural filter based on the distance between EMA2400 and EMA4800 expressed in ATR units, and a momentum confirmation through a previous high breakout.
This is not a random mashup — it’s a sequence of filters designed to reduce trades in ranging markets and prioritize mature trends:
Direction: +DI > -DI (trend led by buyers).
Strength: ADX > mean(ADX) (avoids weak, choppy phases).
Short-term bias: Close > EMA63.
Long-term bias: Close > EMA4800 ≈ EMA200 daily on H1.
Momentum: Close > High (immediate breakout).
Structure: (EMA2400 − EMA4800) > k·ATR (ensures separation in ATR units, filters out flat phases).
Entries & exits
Entry: when all six conditions are met and no open position exists.
Exit: if +DI < -DI or Close < EMA63.
Visuals: EMA63 is painted green while in position and red otherwise, with a supertrend-style band; “BUY” labels appear below the green band and “SELL” labels above the red band.
UI: includes a compact table (mobile-friendly) showing the state of each condition.
Default parameters used in this publication
Initial capital: 10,000
Position size: 10% of equity (≤10% per trade is considered sustainable).
Commission: 0.01% per side (adjust to your broker/market).
Slippage: 1 tick
Pyramiding: 0 (only one position at a time)
Adjust commission/slippage to match your market. For US equities, commissions are often per share; for spot crypto, 0.10–0.20% total is common. I publish with 0.01% per side as a conservative example to avoid overestimating results.
Recommended backtest dataset
Timeframe: H1
Multi-cycle window (e.g. 2015–today)
Symbols with high liquidity (e.g. NASDAQ-100 large caps, or BTC/ETH spot) to generate 100+ trades. Avoid cherry-picked short windows.
Why each filter matters
+DI > -DI + ADX > mean: reduce counter-trend trades and weak signals.
Close > EMA63 + Close > EMA4800: enforce trend alignment in short and long horizons.
Breakout High : requires immediate momentum, avoids early entries.
EMA gap in ATR units: blocks flat or compressed structures where EMA200D aligns with price.
Limitations
The breakout filter may skip healthy pullbacks; the design prioritizes continuation over perfect entry price.
No fixed trailing stop/TP; exits depend on trend degradation via DI/EMA63.
Results vary with real costs (commissions, slippage, funding). Adjust defaults to your broker.
How to use
Apply it on a clean chart (no other indicators when publishing).
Keep in mind the default parameters above; if you change them, mention it in your notes and use the same values in the Strategy Tester.
Ensure your dataset produces 100+ trades for statistical validity.

BDNS ORB Strategy v3BDNS Opening Range Breakout Strategy
What This Strategy Does This strategy implements an Opening Range Breakout (ORB) system that identifies the high and low prices during a customizable opening period, then trades breakouts above or below these levels with momentum confirmation. The strategy goes beyond basic ORB concepts by incorporating ADX momentum filtering, VWAP directional bias, dynamic position sizing, and sophisticated exit management including breakeven moves and trailing stops.
Core Strategy Logic
Opening Range Definition: The strategy tracks price action during a user-defined opening period (default: 9:30-9:35 AM ET for 5 minutes). During this time, blue horizontal lines appear marking the session high and low. A yellow background highlights this opening range period.
Breakout Detection: After the opening range completes, green and red horizontal lines appear showing the actual entry levels - these are offset from the range boundaries by a configurable number of ticks (default: 24 ticks) to filter out false breakouts and ensure committed moves.
Entry Conditions: Trades trigger when price breaks through these offset levels during the trading window (green background, default until 10:30 AM ET), but only when:
ADX momentum indicator exceeds threshold (default 24.0) in the breakout direction
Price relationship to VWAP confirms directional bias (when VWAP filter enabled)
Daily trade limits haven't been reached
Large range filtering conditions are met
Visual Elements and Usage
Range Lines: Blue lines show the actual opening range boundaries. These appear immediately when the opening session begins.
Entry Levels: Green (long) and red (short) lines show where trades will trigger, appearing after the opening range completes.
Information Table: A data table appears in the top-right showing real-time strategy status including range size in ticks, ADX readings, filter status, trade counts, and momentum conditions.
Position Management:
When in a trade, colored circles appear showing:
Lime circles: Long position targets (T1, T2, T3)
Orange circles: Short position targets
Red circles: Stop loss levels
Blue crosses: Breakeven levels (when that feature activates)
Purple lines: Trailing stop levels (when position 3 trailing activates)
Background Colors:
Yellow: Opening range session active
Green: Trading window active
Purple: Large range day detected
Gray: Large range day being skipped
Position Management System
The strategy uses a three-tier exit approach:
Position 1: Takes partial profits at first target (default 50% of range size)
Position 2: Exits at second target (default 100% of range size)
Position 3: Either exits at third target or uses trailing stop after Position 2 wins
Breakeven Feature: When enabled and price reaches the breakeven trigger level, all stop losses move to a more favorable breakeven level instead of the original stop, protecting against giving back profits.
Trailing Stop System: After Position 2 hits its target, Position 3 automatically switches to a trailing stop that moves in the trader's favor as price continues trending.
Customization for Different Instruments
The default settings are configured for MNQ (Micro NASDAQ futures) but the ORB concept is highly customizable for any futures instrument and timeframe. Range duration, breakout offsets, and filter thresholds should be adjusted based on the specific instrument's volatility characteristics and typical intraday patterns.
Filter Usage Guidelines
ADX Momentum Filter: Essential for avoiding breakouts during consolidation. Higher thresholds (30+) for trending markets, lower (20-25) for more opportunities.
VWAP Filter: Helpful in trending conditions but may reduce trade frequency. Better to disable during range-bound or mean-reverting periods.
Large Range Filter: Critical risk management tool. When the opening range exceeds your threshold:
Skip: Avoids trades when stops would be too large
Fade: Trades mean reversion back into the range
Trade: Takes breakouts regardless (higher risk)
Range Size Considerations: Setting a large range threshold (200-400 ticks) helps avoid days when both sides of the range get tested before any meaningful breakout occurs, which often leads to whipsaws.
Risk Management Features
Dynamic Stops and Targets: All exit levels scale with the opening range size, ensuring risk/reward remains consistent regardless of daily volatility. A 100-tick range day will have proportionally smaller stops than a 300-tick range day.
Position Sizing: Configure contract amounts for each position tier based on account size and risk tolerance.
Daily Trade Limits: Prevents overtrading by limiting trades per direction per day.
Breakout Offset: The tick offset from range boundaries is crucial - too small creates false signals, too large misses good moves. Test different values based on your instrument's typical noise levels.
Advanced Features
Large Third Target: Set Target 3 to 300-500% to essentially hold runners indefinitely, using the trailing stop as the primary exit method for capturing extended trends.
Fade Trading: On large range days, the strategy can trade mean reversion when initial breakouts fail, often providing good counter-trend opportunities.
Time-Based Exits: All positions close at the end of the trading window, preventing overnight risk.
Strategy Properties Used
Initial Capital: $5,000 (realistic for micro contract trading)
Commission: $0.50 per contract (realistic retail rates)
Position Size: 100% of equity (manages risk through contract quantities and stop placement)
Default quantities: 3/1/1 contracts across the three positions
The default settings assume larger account sizes or proprietary trading firm accounts where higher risk tolerance is acceptable. With MNQ at $0.50 per tick, a typical 200-tick opening range with 75% stop loss (150 ticks) would risk $375 on a 5-contract position. For smaller retail accounts, consider reducing position sizes significantly - using only Position 1 (3 contracts) would risk $225, or even reducing to 1-2 total contracts to maintain appropriate risk levels relative to account size.
Getting Started Apply the strategy to your preferred instrument
Adjust the opening range time and duration for your market
Set appropriate breakout offset based on typical noise levels
Configure large range threshold based on your risk tolerance
Test filter combinations to find what works best for your trading style
Adjust contract quantities based on your account size and risk management rules
The strategy works best on liquid instruments with clear opening sessions and sufficient volatility to generate meaningful ranges. Results will vary significantly based on market conditions, parameter settings, and the specific instrument traded.
I warrant that the information created and published by by me here on TradingView is not prohibited, doesn't constitute investment advice, and isn't created solely for qualified investors.

MomentumThe strategy uses EMA200, ADX/DMI, RSI, and volume. Pivot levels and Heikin-Ashi ensure safe entries, while cooldowns and opposite-locks prevent overtrading. Exits are managed with ATR trailing stops and trend-reversal signals.

Ultimate Bot v5 (Full Visual + Reversal + Sustained Signals)Ultimate Bot v5 is a powerful, all-in-one Pine Script strategy designed for traders who want both clarity and precision in their charts. It combines classic momentum indicators, volatility filters, and reversal logic to highlight high-probability trade opportunities.
🔹 Key Features
Full Visual Mode – Clean and easy-to-read buy/sell markers with large arrows and labels.
EMA Trend Detection – Fast & slow EMA crossovers for trend direction.
RSI + MACD Confirmation – Confirms entries with momentum & strength checks.
Reversal Alerts – Detects sharp drops or spikes for rebound/reversal plays.
Sustained Signal Mode – Highlights stronger continuation trends, not just short-term flips.
ADX Strength Filter (optional) – Filters out weak/noisy signals during sideways markets.
ATR Dynamic Positioning – Arrows adapt to volatility so they’re always visible.
Custom Alerts – Works with TradingView alerts for buy, sell, and reversal signals.
🔹 Why Use It?
This bot is designed to help traders:
✅ Spot early reversals and potential bounce opportunities
✅ Confirm strong momentum moves with multi-indicator checks
✅ Avoid false signals in choppy markets
✅ Trade with confidence using visual clarity

TrendPilot AI v2 — Adaptive Trend Day Trading StrategyOverview
TrendPilot AI v2 is a structured, rules-based day trading strategy that identifies and follows market momentum using a sophisticated blend of technical indicators. Optimized for 15-minute and higher timeframes on high market cap cryptocurrencies (AAVE, SOL, ETH, BCH, BTC) to minimize manipulation risks, it adapts to changing market conditions with dynamic risk management and controlled re-entry logic to maximize trend participation while minimizing noise.
Core Logic
Multiple EMA Trend Confirmation — Uses three Exponential Moving Averages (fast, medium, slow) to detect robust bullish, bearish, or neutral trends, ensuring trades align with the prevailing market direction.
ADX Momentum Filter — Employs an ADX-based filter to confirm strong trends, avoiding entries in choppy or low-momentum markets.
Smart Entry Filter — Optional ATR-based buffer (period 14, multiplier 1.5) around the fast EMA prevents entries at overextended prices, enhancing trade precision.
Flexible Exit System — Offers multiple exit options: fixed take-profit (default 1.7 offset), trend-reversal exits, or ATR-based trailing stops (period 14, multiplier 2.0), with secure modes requiring candle closes for confirmation to gain Max Profit.
Controlled Re-Entry Logic — Allows re-entries after take-profit or price-based stop-loss with configurable wait periods (default 6 bars), max attempts (default 2), and EMA touch requirements (fast, medium, or slow).
State-Aware Risk Management — Tracks trend states and recent exits to adapt entries, with daily trade limits (default 5 long/short) and loss cooldowns (default 2 stop-losses) for disciplined trading.
How to Use & Configuration
Markets & Timeframes
Works with high market cap cryptocurrencies (AAVE, SOL, ETH, BCH, BTC).
Optimized for intraday charts (15m–4h) but adaptable to higher timeframes (e.g., 1h, 4h).
Trade Direction Settings
Dual Trades — Trades both long and short, quickly re-aligning after trend reversals.
Long Only — Ignores bearish signals, ideal for bullish markets or strong uptrends.
Short Only — Ignores bullish signals, suited for bearish markets or downtrends.
Risk Management Settings
Stop Loss Types
Trend Reversal — Closes positions when an opposite trend signal is confirmed (default).
Fixed Offset — Static stop at 3.5 offset from entry price (adjustable).
ATR Based — Dynamic trailing stop using ATR (period 14, multiplier 2.0), adjusting to market volatility.
Secure SL Mode — Optional setting to trigger price-based stops only on candle closes, reducing false exits.
Maximum recommended risk per trade is 5–10% of account equity.
Trade size is configurable (default 20 units) to match individual risk appetite.
Take Profit Options
Fixed Offset — Predefined target at 1.7 offset from entry (adjustable, e.g., 2.5 for SOL).
Secure TP Mode — Exits only when a candle closes beyond the target, ensuring reliable profit capture.
Trend Reversal — Exits on opposite trend signals when fixed TP is disabled, ideal for riding longer trends.
Trade Management Controls
Smart Entry Filter — Optional ATR-based buffer (period 14, multiplier 1.5) prevents chasing overextended prices.
Max Re-Entries — Limits continuation trades per trend cycle (default 2).
Daily Trade Limits — Caps long/short trades per day (default 5 each) for disciplined trading.
Daily Loss Cooldown — Pauses trading after a set number of stop-losses (default 2) per day.
Max Bars in Trade — Closes positions after a set duration (default 1440 bars) to prevent stale trades.
Configuration Steps
Apply the strategy to your chosen symbol (e.g., AAVE/USDT, SOL/USDT) and timeframe (15m or higher).
Select Trade Direction mode (Dual, Long Only, or Short Only).
Set Stop Loss (Trend Reversal, Fixed Offset, or ATR Based) and Take Profit (fixed or trend-reversal).
Adjust Smart Entry Filter, Max Re-Entries, Daily Limits, and Loss Cooldown as needed.
Test across multiple market conditions using the performance panel (top-right, showing Total Trades, Wins, Losses, Win Rate).
Enables automated trading via webhook integration with platforms like Binance Futures.
Set up alerts for long/short entries (🟢 Long, 🔴 Short) and exits (🎯 Max TP, 🛑 Max SL, 🚨 Force Exit).
Backtesting Guidance
Use realistic commission (default 0.01%) and slippage (default 2 ticks) matching your broker and instrument.
Validate performance over long historical periods (e.g., 3–6 months) to ensure >100 trades across different market regimes.
Avoid curve-fitting by testing on multiple high market cap coins (AAVE, SOL, ETH, BCH, BTC) and avoiding over-optimization.
EMA and ATR parameters are set to balanced, industry-standard values for realistic backtesting.
Best Practices, Defaults & Disclaimer
Best Practices
Use consistent and conservative position sizing (default 20 units).
Match commission and slippage to your broker’s actual rates.
Enable secure TP/SL modes for entries and exits to reduce false signals.
Test across different symbols, timeframes, and market phases before live trading.
Keep parameters simple to avoid overfitting.
Default Settings (Recommended Starting Point)
Initial Capital: $10,000
Order Size: Fixed, 20 units
Commission: 0.01%
Slippage: 2 ticks
Take Profit Offset: 1.7 (adjustable, e.g., 2.5 for SOL)
Stop Loss Type: Trend Reversal (default), Fixed Offset (3.5), or ATR Based (period 14, multiplier 2.0)
Smart Entry Filter: ATR period 14, multiplier 1.5 (optional)
Max Re-Entries: 2 per trend cycle
Daily Trade Limits: 5 long, 5 short
Daily Loss Cooldown: 2 stop-losses
Max Bars in Trade: 1440 bars
Subscription Information
TrendPilot AI v2 is an invite-only strategy, accessible only to approved subscribers.
Benefits include full access to all features, priority support, and regular updates.
Access is limited to ensure a high-quality user experience.
Compliance Status
No functional warnings in the script.
The script uses closed candle logic, ensuring no repainting or lookahead issues.
Designed for realistic backtesting with a $10,000 account and sustainable risk (≤5–10% per trade).
Disclaimer
This strategy is intended for educational and analytical purposes only. Trading involves substantial risk, and past performance does not guarantee future results. You are solely responsible for your own trading decisions and risk management.
Developed by: TrendPilotAI Team
For questions, setup guidance, or enhancement suggestions, contact TrendPilotAI Team via TradingView.

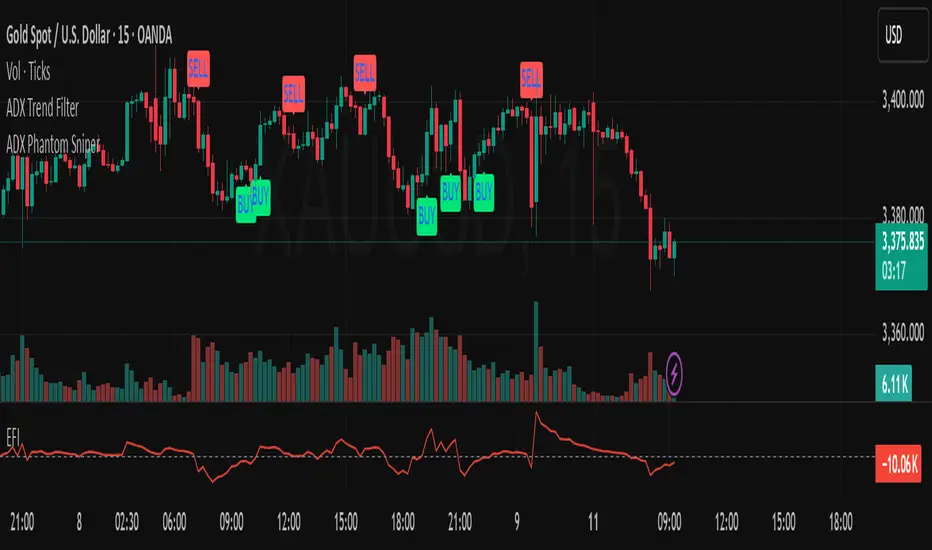
ADX Phantom SniperADX Phantom Sniper is a precision trend-following tool that combines three powerful forces:
1. ADX & DI Crossover Trigger – Detects strong directional moves only when the trend strength exceeds a defined threshold.
2. Multi-Timeframe (MTF) Confirmation – Executes on the current chart timeframe (e.g., M15) only if the higher timeframe (H1) confirms the same trend direction.
3. Force Index Momentum Filter – Filters entries based on bullish/bearish momentum to avoid weak signals.
Signal Logic:
BUY: EMA14 > EMA100, price above EMA14, +DI crosses above -DI, ADX > threshold, Stochastic crosses above signal line in the bullish zone (>50), MTF trend aligned, Force Index > 0 (optional).
SELL: EMA14 < EMA100, price below EMA14, -DI crosses above +DI, ADX > threshold, Stochastic crosses below signal line in the bearish zone (<50), MTF trend aligned, Force Index < 0 (optional).
Features:
Noise filtering with trend structure + higher timeframe alignment
On-chart BUY/SELL labels for easy signal spotting
Optional Force Index filter toggle
Adjustable ADX threshold, EMA lengths, Stochastic settings, and higher timeframe choice
Suitable for scalping and swing entries depending on timeframe
Recommended Setup:
Primary chart: M15
Higher timeframe confirmation: H1
Combine with your preferred risk management rules.
Disclaimer:
This tool is for educational purposes only and is not financial advice. Past performance does not guarantee future results. Use at your own risk.
SwingTrade ADX Strategy v6This is a swing trading strategy that combines VWAP (Volume Weighted Average Price), ADX (Average Directional Index) for trend strength, and volume ratios to generate long/short entry and exit signals. It's designed for daily charts but can be adapted.
#### Key Features:
- **Entries**: Based on VWAP crossovers, rising/falling delta (price deviation from VWAP), ADX trend confirmation, and volume ratios.
- **Exits**: Dynamic exits when VWAP delta reverses after a peak.
- **Filters**: Optional toggles for VWAP signals, ADX, and volume. Backtest date range for custom periods.
- **Visuals**: VWAP line, signal shapes/labels, and an info panel showing key metrics (VWAP Delta %, ADX, Volume Ratio).
- **Alerts**: Built-in alerts for buy/sell entries and exits.
#### How to Use:
1. Apply to your chart (e.g., stocks, forex, crypto).
2. Adjust parameters in the settings (e.g., ADX threshold, volume period).
3. Enable/disable indicators as needed.
4. Backtest using the date filters and review equity curve.
**Disclaimer**: This is for educational purposes only. Past performance is not indicative of future results. Not financial advice—trade at your own risk. Backtest thoroughly and use with proper risk management.
Feedback welcome! If you find it useful, give it a like.

PRO Trading Averaging Beta(v1)Adaptive Position Scaling
Automatically increases position size during pullbacks using exponential volume scaling (1x, 2x, 4x, etc.). This reduces average entry cost and accelerates breakeven when price reverses.
Multi-Timeframe Confirmation
All indicators operate on a higher timeframe (120 minutes), providing:
Noise-filtered signals
Stronger trend alignment
Reduced false entries
Triple-Layer Entry Logic
Requires simultaneous confluence of:
Custom Bollinger Band penetration
RSI oversold filter (above critical threshold)
Golden cross confirmation (fast MA > slow MA)
Volatility assessment via ATR
Intelligent Exit System
Position closure triggers when either:
Fixed profit target (% of account) is reached
Technical boundary (upper Bollinger Band) is touched
⚙️ Core Mechanics:
graph LR
A --> B
B --> C{Initial Entry: 1% capital}
C --> D
D -->|Yes| E
D -->|No| F
E --> G{Max Averaging Levels?}
G -->|No| D
G -->|Yes| H
F --> I
📊 Implementation Guide:
Capital Configuration
Set initial_capital to your actual account size
Calculate base contract size:
(Account Size × 0.01) / (Instrument Price × Point Value)
Example: $10,000 account → 0.01 BTC futures contracts
Pyramiding Structure
Volume progression per averaging level:
Level 1: 1× (Base volume)
Level 2: 2×
Level 3: 4×
Level 4: 8×
Level 5: 16×
Level 6: 32×
(Max 6 levels configurable in strategy settings)
Custom Entry Variations
Alternative approach for swing captures:
// Enter only at 3rd averaging with 5% capital
if averaging_condition and strategy.opentrades == 2
strategy.entry("SwingEntry", strategy.long, qty=base_order_size*5)
Risk Management Protocol
No traditional stop-loss (replaced by averaging)
Break-even trigger: Manually move to breakeven at +0.5% profit
Max exposure: Capped at 6 averaging levels
Commissions: Pre-configured at 0.1% per trade
⚠️ Critical Risk Disclosures:
"Past Performance ≠ Future Results"
Historical optimization requires continuous forward testing ("Walk Forward" in TV).
Pyramiding Hazards
Exponential volume growth demands:
Minimum 20% free margin buffer
High liquidity instruments (spread < 0.5% of ATR)
Strict per-level risk calculation
Market Regime Dependence
Peak efficiency during:
Strong trends with 2-4% retracements
Assets with ATR > 1.5% of daily range
Avoid ranging/low-volatility conditions
💡 Pro Usage Recommendations:
Position Sizing Formula
For futures: Contracts = (Capital × Risk %) / (Entry Price × Point Value × Stop Distance)
Profit Protection
Close 50% position at 50% profit target, trail remainder
Event Safety
Disable averaging during:
High-impact news events
Exchange outages
Abnormal volume spikes
pie
title Risk Allocation per Level
“First Entry” : 12
“Level 2” : 18
“Level 3” : 25
“Level 4” : 45
ESSENTIAL: This strategy demands strict discipline. Terminate averaging when price action deviates from expected patterns. Always maintain reserve capital exceeding maximum drawdown requirements. Regularly validate strategy performance against current market dynamics.
🔥 Уникальные особенности и ценность:
Адаптивное усреднение
Стратегия автоматически увеличивает позицию при движении против вас, используя экспоненциальное наращивание объема (1x, 2x, 4x и т.д.). Это снижает среднюю цену входа и ускоряет выход в прибыль при развороте.
Мультитаймфреймная фильтрация
Все индикаторы работают на старшем таймфрейме (120 минут), что:
Фильтрует рыночный шум
Обеспечивает более надежные сигналы
Синхронизируется с глобальным трендом
Комбинированный триггер входа
Для активации требуется одновременное выполнение 4 условий:
Пробитие кастомной полосы Боллинджера
Подтверждение тренда (быстрая MA > медленной MA)
Контроль перепроданности (RSI выше критического уровня)
Фильтр волатильности (ATR)
Двойной механизм выхода
Закрытие позиций происходит при:
Достижении целевого уровня прибыли (% от депозита)
Техническом сигнале (касание верхней полосы Боллинджера)
⚙️ Как работает стратегия:
graph TD
A --> B
B --> C{Первый вход: 1% депозита}
C --> D
D -->|Да| E
D -->|Нет| F
E --> G{Достигнут лимит усреднений?}
G -->|Нет| D
G -->|Да| H
F --> I
📊 Как пользоваться:
Стартовые настройки
Base Order Size: Стартовый объем = 1% депозита
(Пример: при $10 000 депозита = 0.01 контракта)
initial_capital: Укажите ваш реальный депозит
Правила пирамидинга
Объем наращивается по схеме:
Уровень 1: 1x (базовый объем)
Уровень 2: 2x
Уровень 3: 4x
Уровень 4: 8x
Уровень 5: 16x
Уровень 6: 32x
РЕКОМЕНДУЕТСЯ Максимум 6 уровней усреднения (настраивается в pyramiding)
Кастомизация входов
Пример модификации для агрессивной тактики:
// Вход только на 3-м усреднении с 5% депозита
if averaging_condition and strategy.opentrades == 2
strategy.entry("BuyAggressive", strategy.long, qty=base_order_size*5)
Можно поставить параметр пираммидинг 1 и получать больше сигналов на младших тайм фреймах
Управление рисками
Стоп-лосс: Не используется (заменен усреднением)
Перевод в безубыток: Активируйте вручную при +0.5%
Максимальная просадка: Рекомендуется Ограничивать 6 уровнями усреднения
Комиссии: Учтены (0.1% от объема сделки)
Критические предупреждения:
"Вчера ≠ Сегодня"
Стратегия оптимизирована под историческую волатильность. Регулярно тестируйте на новых данных (режим "Перед тест" в TV).
Опасность усреднения
Экспоненциальный рост объема требует:
Глубокого расчета риска на уровень
Минимум 20% свободного маржи
Ликвидный инструмент (спред < 0.5% от ATR)
Рыночные условия
Максимальная эффективность в:
Трендовых рынках с коррекциями 2-4%
Инструментах с ATR > дневного диапазона 1.5%
💡 Рекомендации по использованию:
Для фьючерсов: Рассчитайте контракты через (капитал * 0.01) / (цена * пункт_стоимости)
При 50% достижении цели прибыли - закройте 50% позиции
Отключайте усреднение при выходе макро-новостей
pie
title Распределение риска
"Первый вход" : 10
"Уровень 2" : 20
"Уровень 3" : 30
"Уровень 4" : 40
ВАЖНО: Эта стратегия требует дисциплины! Прекращайте усреднение при отклонении рынка от исторических паттернов. Всегда имейте резервный капитал для экстренных случаев.

Intraday Trading Hit and Run# Strategy Overview
This is a short-term trading system designed for quick entries/exits (intraday). It uses multiple technical indicators to identify momentum trades in the direction of the trend, with built-in risk management through trailing stops.
# Main Components
1. Trend Filter
Uses two EMAs (10-period "fast" blue line and 100-period "slow" red line)
Only trades when:
Long: Price AND fast EMA are above slow EMA
Short: Price AND fast EMA are below slow EMA
2. Main Signal
////Stochastic Oscillator (14-period):
Buy when %K line crosses above %D line
Sell when %K crosses below %D
////Trend Strength Check
Smoothed ADX indicator (5-period EMA of ADX):
Requires ADX value ≥ 25 to confirm strong trend
3. Confirmation using Volume Filter (Optional)
Checks if current volume is 1.5× greater than 20-period average volume
# Entry Rules
A trade is only taken when:
All 3 indicators agree (EMA trend, Stochastic momentum, ADX strength)
Volume filter is satisfied (if enabled)
# Exit Rules
1. Emergency Exit:
Close long if price drops below fast EMA
Close short if price rises above fast EMA
2. Trailing Stop:
Actively protects profits by moving stop-loss:
Maintains 0.1% distance from highest price (longs) or lowest price (shorts)
# Risk Management
Only use 10% of account per trade
Includes 0.04% commission cost in calculations
All trades monitored with trailing stops
# How It Operates
The strategy looks for strong, high-volume momentum moves in the direction of the established trend (as determined by EMAs). It jumps in quickly ("hit") when conditions align, then protects gains with an automatic trailing stop ("run"). Designed for fast markets where trends develop rapidly.
You can use it on 15m, 1h or 4h

Multi-Indicator Swing [TIAMATCRYPTO]v6# Strategy Description:
## Multi-Indicator Swing
This strategy is designed for swing trading across various markets by combining multiple technical indicators to identify high-probability trading opportunities. The system focuses on trend strength confirmation and volume analysis to generate precise entry and exit signals.
### Core Components:
- **Supertrend Indicator**: Acts as the primary trend direction filter with optimized settings (Factor: 3.0, ATR Period: 10) to balance responsiveness and reliability.
- **ADX (Average Directional Index)**: Confirms the strength of the prevailing trend, filtering out sideways or choppy market conditions where the strategy avoids taking positions.
- **Liquidity Delta**: A volume-based indicator that analyzes buying and selling pressure imbalances to validate trend direction and potential reversals.
- **PSAR (Optional)**: Can be enabled to add additional confirmation for trend changes, turned off by default to reduce signal filtering.
### Key Features:
- **Flexible Direction Trading**: Choose between long-only, short-only, or bidirectional trading to adapt to market conditions or account restrictions.
- **Conservative Risk Management**: Implements fixed percentage-based stop losses (default 2%) and take profits (default 4%) for a positive risk-reward ratio.
- **Realistic Backtesting Parameters**: Includes commission (0.1%) and slippage (2 points) to reflect real-world trading conditions.
- **Visual Signals**: Clear buy/sell arrows with customizable sizes for easy identification on the chart.
- **Information Panel**: Dynamic display showing active indicators and current risk settings.
### Best Used On:
Daily timeframes for cryptocurrencies, forex, or stock indices. The strategy performs optimally on assets with clear trending behavior and sufficient volatility.
### Default Settings:
Optimized for conservative position sizing (5% of equity per trade) with an initial capital of $10,000. The backtesting period (2021-2023) provides a statistically significant sample of varied market conditions.

SwingTrade VWAP Strategy[TiamatCrypto]V1.1This Pine Script® code creates a trading strategy called "SwingTrade VWAP Strategy V1.1." This strategy incorporates various trading tools, such as VWAP (Volume Weighted Average Price), ADX (Average Directional Index), and volume signals. Below is an explanation of the components and logic within the script:
### Overview of Features
- **VWAP:** A volume-weighted moving average that assesses price trends relative to the VWAP level.
- **ADX:** A trend strength indicator that helps confirm the strength of bullish or bearish trends.
- **Volume Analysis:** Leverages volume data to gauge momentum and identify volume-weighted buy/sell conditions.
- **Dynamic Entry/Exit Signals:** Combines the above indicators to produce actionable buy/sell or exit signals.
- **Customizable Inputs:** Inputs for tuning parameters like VWAP period, ADX thresholds, and volume sensitivity.
---
### **Code Breakdown**
#### **Input Parameters**
The script begins by defining several user-configurable variables under groups. These include indicators' on/off switches (`showVWAP`, `enableADX`, `enableVolume`) and input parameters for VWAP, ADX thresholds, and volume sensitivity:
- **VWAP Period and Threshold:** Controls sensitivity for VWAP signal generation.
- **ADX Settings:** Allows users to configure the ADX period and strength threshold.
- **Volume Ratio:** Detects bullish/bearish conditions based on relative volume patterns.
---
#### **VWAP Calculation**
The script calculates VWAP using the formula:
\
Where `P` is the typical price (`(high + low + close)/3`) and `V` is the volume.
- It resets cumulative values (`sumPV` and `sumV`) at the start of each day.
- Delta percentage (`deltaPercent`) is calculated as the percentage difference between the close price and the VWAP.
---
#### **Indicators and Signals**
1. **VWAP Trend Signals:**
- Identifies bullish/bearish conditions based on price movement (`aboveVWAP`, `belowVWAP`) and whether the price is crossing the VWAP level (`crossingUp`, `crossingDown`).
- Also detects rising/falling delta changes based on the VWAP threshold.
2. **ADX Calculation:**
- Calculates the directional movement (`PlusDM`, `MinusDM`) and smoothed values for `PlusDI`, `MinusDI`, and `ADX`.
- Confirms strong bullish/bearish trends when ADX crosses the defined threshold.
3. **Volume-Based Signals:**
- Evaluates the ratio of bullish volume (when `close > VWAP`) to bearish volume (when `close < VWAP`) over a specified lookback period.
---
#### **Trade Signals**
The buy and sell signals are determined by combining conditions from the VWAP, ADX, and volume signals:
- **Buy Signal:** Triggered when price upward crossover VWAP, delta rises above the threshold, ADX indicates a strong bullish trend, and volume confirms bullish momentum.
- **Sell Signal:** Triggered under inverse conditions.
- Additionally, exit conditions (`exitLong` and `exitShort`) are based on VWAP crossovers combined with the reversal of delta values.
---
#### **Plotting and Display**
The strategy plots VWAP on the chart and adds signal markers for:
- **Buy/Long Entry:** Green triangle below bars.
- **Sell/Short Entry:** Red triangle above bars.
- **Exit Signals:** Lime or orange "X" shapes for exits from long/short positions.
- Additionally, optional text labels are displayed to indicate the type of signal.
---
#### **Trading Logic**
The script's trading logic executes as follows:
- **Entries:**
- Executes long trades when the `buySignal` condition is true.
- Executes short trades when the `sellSignal` condition is true.
- **Exits:**
- Closes long positions upon `exitLong` conditions.
- Closes short positions upon `exitShort` conditions.
- The strategy calculates profits and visualizes the trade entry, exit, and running profit within the chart.
---
#### **Alerts**
Alerts are set up to notify traders via custom signals for buy and sell trades.
---
### **Use Case**
This script is suitable for day traders, swing traders, or algorithmic traders who rely on confluence signals from VWAP, ADX, and volume momentum. Its modular structure (e.g., the ability to enable/disable specific indicators) makes it highly customizable for various trading styles and financial instruments.
#### **Customizability**
- Adjust VWAP, ADX, and volume sensitivity levels to fit unique market conditions or asset classes.
- Turn off specific criteria to focus only on VWAP or ADX signals if desired.
#### **Caution**
As with all trading strategies, this script should be used for backtesting and analysis before live implementation. It's essential to validate its performance on historical data while considering factors like slippage and transaction costs.

[SM-042] EMA 5-8-13 with ADX FilterWhat is the strategy?
The strategy combines three exponential moving averages (EMAs) — 5, 8, and 13 periods — with an optional ADX (Average Directional Index) filter. It is designed to enter long or short positions based on EMA crossovers and to exit positions when the price crosses a specific EMA. The ADX filter, if enabled, adds a condition that only allows trades when the ADX value is above a certain threshold, indicating trend strength.
Who is it for?
This strategy is for traders leveraging EMAs and trend strength indicators to make trade decisions. It can be used by anyone looking for a simple trend-following strategy, with the flexibility to adjust for trend strength using the ADX filter.
When is it used?
- **Long trades**: When the 5-period EMA crosses above the 8-period EMA, with an optional ADX condition (if enabled) that requires the ADX value to be above a specified threshold.
- **Short trades**: When the 5-period EMA crosses below the 8-period EMA, with the ADX filter again optional.
- **Exits**: The strategy exits a long position when the price falls below the 13-period EMA and exits a short position when the price rises above the 13-period EMA.
Where is it applied?
This strategy is applied on a chart with any asset on TradingView, with the EMAs and ADX plotted for visual reference. The strategy uses `strategy.entry` to open positions and `strategy.close` to close them based on the set conditions.
Why is it useful?
This strategy helps traders identify trending conditions and filter out potential false signals by using both EMAs (to capture short-term price movements) and the ADX (to confirm the strength of the trend). The ADX filter can be turned off if not desired, making the strategy flexible for both trending and range-bound markets.
How does it work?
- **EMA Crossover**: The strategy enters a long position when the 5-period EMA crosses above the 8-period EMA, and enters a short position when the 5-period EMA crosses below the 8-period EMA.
- **ADX Filter**: If enabled, the strategy checks whether the ADX value is above a set threshold (default is 20) before allowing a trade.
- **Exit Conditions**: Long positions are closed when the price falls below the 13-period EMA, and short positions are closed when the price rises above the 13-period EMA.
- **Plotting**: The strategy plots the three EMAs and the ADX value on the chart for visualization. It also displays a horizontal line at the ADX threshold.
This setup allows for clear decision-making based on the interaction between different time-frame EMAs and trend strength as indicated by ADX.

Reversal Trading Bot Strategy[BullByte]Overview :
The indicator Reversal Trading Bot Strategy is crafted to capture potential market reversal points by combining momentum, volatility, and trend alignment filters. It uses a blend of technical indicators to identify both bullish and bearish reversal setups, ensuring that multiple market conditions are met before entering a trade.
Core Components :
Technical Indicators Used :
RSI (Relative Strength Index) :
Purpose : Detects divergence conditions by comparing recent lows/highs in price with the RSI.
Parameter : Length of 8.
Bollinger Bands (BB) :
Purpose : Measures volatility and identifies price levels that are statistically extreme.
Parameter : Length of 20 and a 2-standard deviation multiplier.
ADX (Average Directional Index) & DMI (Directional Movement Index) :
Purpose : Quantifies the strength of the trend. The ADX threshold is set at 20, and additional filters check for the alignment of the directional indicators (DI+ and DI–).
ATR (Average True Range) :
Purpose : Provides a volatility measure used to set stop levels and determine risk through trailing stops.
Volume SMA (Simple Moving Average of Volume ):
Purpose : Helps confirm strength by comparing the current volume against a 20-period average, with an optional filter to ensure volume is at least twice the SMA.
User-Defined Toggle Filters :
Volume Filter : Confirms that the volume is above average (or twice the SMA) before taking trades.
ADX Trend Alignment Filter : Checks that the ADX’s directional indicators support the trade direction.
BB Close Confirmation : Optionally refines the entry by requiring price to be beyond the upper or lower Bollinger Band rather than just above or below.
RSI Divergence Exit : Allows the script to close positions if RSI divergence is detected.
BB Mean Reversion Exit : Closes positions if the price reverts to the Bollinger Bands’ middle line.
Risk/Reward Filter : Ensures that the potential reward is at least twice the risk by comparing the distance to the Bollinger Band with the ATR.
Candle Movement Filter : Optional filter to require a minimum percentage move in the candle to confirm momentum.
ADX Trend Exit : Closes positions if the ADX falls below the threshold and the directional indicators reverse.
Entry Conditions :
Bullish Entry :
RSI Divergence : Checks if the current close is lower than a previous low while the RSI is above the previous low, suggesting bullish divergence.
Bollinger Confirmation : Requires that the price is above the lower (or upper if confirmation is toggled) Bollinger Band.
Volume & Trend Filters : Combines volume condition, ADX strength, and an optional candle momentum condition.
Risk/Reward Check : Validates that the trade meets a favorable risk-to-reward ratio.
Bearish Entry :
Uses a mirror logic of the bullish entry by checking for bearish divergence, ensuring the price is below the appropriate Bollinger level, and confirming volume, trend strength, candle pattern, and risk/reward criteria.
Trade Execution and Exit Strateg y:
Trade Execution :
Upon meeting the entry conditions, the strategy initiates a long or short position.
Stop Loss & Trailing Stops :
A stop-loss is dynamically set using the ATR value, and trailing stops are implemented as a percentage of the close price.
Exit Conditions :
Additional exit filters can trigger early closures based on RSI divergence, mean reversion (via the middle Bollinger Band), or a weakening trend as signaled by ADX falling below its threshold.
This multi-layered exit strategy is designed to lock in gains or minimize losses if the market begins to reverse unexpectedly.
How the Strategy Works in Different Market Conditions :
Trending Markets :
The ADX filter ensures that trades are only taken when the trend is strong. When the market is trending, the directional movement indicators help confirm the momentum, making the reversal signal more reliable.
Ranging Markets :
In choppy markets, the Bollinger Bands expand and contract, while the RSI divergence can highlight potential turning points. The optional filters can be adjusted to avoid false signals in low-volume or low-volatility conditions.
Volatility Management :
With ATR-based stop-losses and a risk/reward filter, the strategy adapts to current market volatility, ensuring that risk is managed consistently.
Recommendation on using this Strategy with a Trading Bot :
This strategy is well-suited for high-frequency trading (HFT) due to its ability to quickly identify reversal setups and execute trades dynamically with automated stop-loss and trailing exits. By integrating this script with a TradingView webhook-based bot or an API-driven execution system, traders can automate trade entries and exits in real-time, reducing manual execution delays and capitalizing on fast market movements.
Disclaimer :
This script is provided for educational and informational purposes only. It is not intended as investment advice. Trading involves significant risk, and you should always conduct your own research and analysis before making any trading decisions. The author is not responsible for any losses incurred while using this script.

Strategy SuperTrend SDI WebhookThis Pine Script™ strategy is designed for automated trading in TradingView. It combines the SuperTrend indicator and Smoothed Directional Indicator (SDI) to generate buy and sell signals, with additional risk management features like stop loss, take profit, and trailing stop. The script also includes settings for leverage trading, equity-based position sizing, and webhook integration.
Key Features
1. Date-based Trade Execution
The strategy is active only between the start and end dates set by the user.
times ensures that trades occur only within this predefined time range.
2. Position Sizing and Leverage
Uses leverage trading to adjust position size dynamically based on initial equity.
The user can set leverage (leverage) and percentage of equity (usdprcnt).
The position size is calculated dynamically (initial_capital) based on account performance.
3. Take Profit, Stop Loss, and Trailing Stop
Take Profit (tp): Defines the target profit percentage.
Stop Loss (sl): Defines the maximum allowable loss per trade.
Trailing Stop (tr): Adjusts dynamically based on trade performance to lock in profits.
4. SuperTrend Indicator
SuperTrend (ta.supertrend) is used to determine the market trend.
If the price is above the SuperTrend line, it indicates an uptrend (bullish).
If the price is below the SuperTrend line, it signals a downtrend (bearish).
Plots visual indicators (green/red lines and circles) to show trend changes.
5. Smoothed Directional Indicator (SDI)
SDI helps to identify trend strength and momentum.
It calculates +DI (bullish strength) and -DI (bearish strength).
If +DI is higher than -DI, the market is considered bullish.
If -DI is higher than +DI, the market is considered bearish.
The background color changes based on the SDI signal.
6. Buy & Sell Conditions
Long Entry (Buy) Conditions:
SDI confirms an uptrend (+DI > -DI).
SuperTrend confirms an uptrend (price crosses above the SuperTrend line).
Short Entry (Sell) Conditions:
SDI confirms a downtrend (+DI < -DI).
SuperTrend confirms a downtrend (price crosses below the SuperTrend line).
Optionally, trades can be filtered using crossovers (occrs option).
7. Trade Execution and Exits
Market entries:
Long (strategy.entry("Long")) when conditions match.
Short (strategy.entry("Short")) when bearish conditions are met.
Trade exits:
Uses predefined take profit, stop loss, and trailing stop levels.
Positions are closed if the strategy is out of the valid time range.
Usage
Automated Trading Strategy:
Can be integrated with webhooks for automated execution on supported trading platforms.
Trend-Following Strategy:
Uses SuperTrend & SDI to identify trend direction and strength.
Risk-Managed Leverage Trading:
Supports position sizing, stop losses, and trailing stops.
Backtesting & Optimization:
Can be used for historical performance analysis before deploying live.
Conclusion
This strategy is suitable for traders who want to automate their trading using SuperTrend and SDI indicators. It incorporates risk management tools like stop loss, take profit, and trailing stop, making it adaptable for leverage trading. Traders can customize settings, conduct backtests, and integrate it with webhooks for real-time trade execution. 🚀
Important Note:
This script is provided for educational and template purposes and does not constitute financial advice. Traders and investors should conduct their research and analysis before making any trading decisions.

ADX for BTC [PineIndicators]The ADX Strategy for BTC is a trend-following system that uses the Average Directional Index (ADX) to determine market strength and momentum shifts. Designed for Bitcoin trading, this strategy applies a customizable ADX threshold to confirm trend signals and optionally filters entries using a Simple Moving Average (SMA). The system features automated entry and exit conditions, dynamic trade visualization, and built-in trade tracking for historical performance analysis.
⚙️ Core Strategy Components
1️⃣ Average Directional Index (ADX) Calculation
The ADX indicator measures trend strength without indicating direction. It is derived from the Positive Directional Movement (+DI) and Negative Directional Movement (-DI):
+DI (Positive Directional Index): Measures upward price movement.
-DI (Negative Directional Index): Measures downward price movement.
ADX Value: Higher values indicate stronger trends, regardless of direction.
This strategy uses a default ADX length of 14 to smooth out short-term fluctuations while detecting sustainable trends.
2️⃣ SMA Filter (Optional Trend Confirmation)
The strategy includes a 200-period SMA filter to validate trend direction before entering trades. If enabled:
✅ Long Entry is only allowed when price is above a long-term SMA multiplier (5x the standard SMA length).
✅ If disabled, the strategy only considers the ADX crossover threshold for trade entries.
This filter helps reduce entries in sideways or weak-trend conditions, improving signal reliability.
📌 Trade Logic & Conditions
🔹 Long Entry Conditions
A buy signal is triggered when:
✅ ADX crosses above the threshold (default = 14), indicating a strengthening trend.
✅ (If SMA filter is enabled) Price is above the long-term SMA multiplier.
🔻 Exit Conditions
A position is closed when:
✅ ADX crosses below the stop threshold (default = 45), signaling trend weakening.
By adjusting the entry and exit ADX levels, traders can fine-tune sensitivity to trend changes.
📏 Trade Visualization & Tracking
Trade Markers
"Buy" label (▲) appears when a long position is opened.
"Close" label (▼) appears when a position is exited.
Trade History Boxes
Green if a trade is profitable.
Red if a trade closes at a loss.
Trend Tracking Lines
Horizontal lines mark entry and exit prices.
A filled trade box visually represents trade duration and profitability.
These elements provide clear visual insights into trade execution and performance.
⚡ How to Use This Strategy
1️⃣ Apply the script to a BTC chart in TradingView.
2️⃣ Adjust ADX entry/exit levels based on trend sensitivity.
3️⃣ Enable or disable the SMA filter for trend confirmation.
4️⃣ Backtest performance to analyze historical trade execution.
5️⃣ Monitor trade markers and history boxes for real-time trend insights.
This strategy is designed for trend traders looking to capture high-momentum market conditions while filtering out weak trends.
