Average

SMA 21/30/50/100/200 with Cross by DragonByteCombines several key simple moving averages into one slot without going overboard. Includes cross indicators between the 50/100 and the 50/200 day SMA's.

Multiple SMAs + X-Bar High/LowWhen starting my daily analysis, I typically open a daily chart and check where the price is compared to several SMAs, as well as check the high/low of today and the 10-day high/low. This indicator was designed to save chart space as well as make finding the highs and lows more efficient. Everything is adjustable, so you don't have to stick with my 10-bar rule.

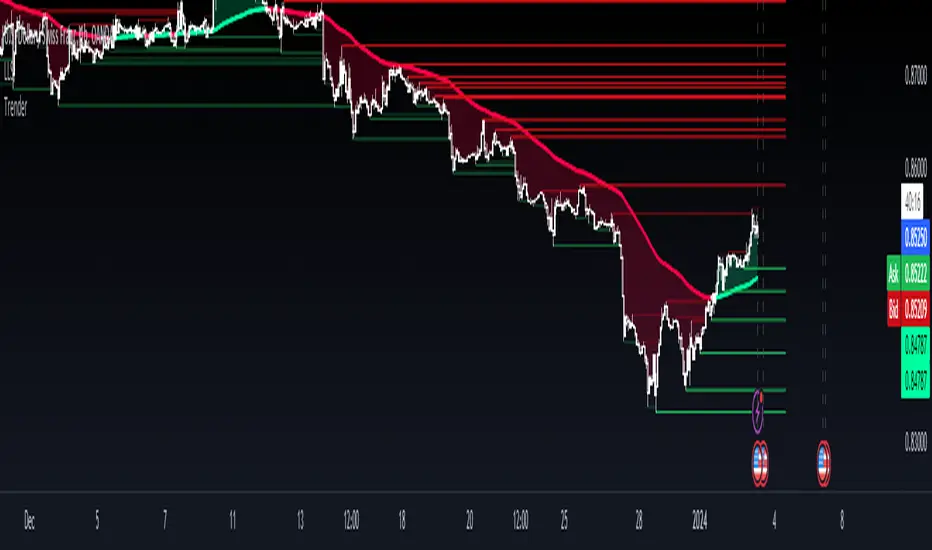
TrenderTrender is an indicator that compiles trend-following ideas in a complete friendly-custom indicator. Based on classic arithmetic moving averages, exponential moving averages, volume and a little bit of Fibonacci. Indicator built and usable in TradingView, focused only for easy visualization of the trend.
Scripting Tutorial 3 - Triple Many Moving AveragesThis script is for a triple moving average indicator where the user can select from different types of moving averages. It is meant as an educational script with well formatted styling, and references for specific functions.

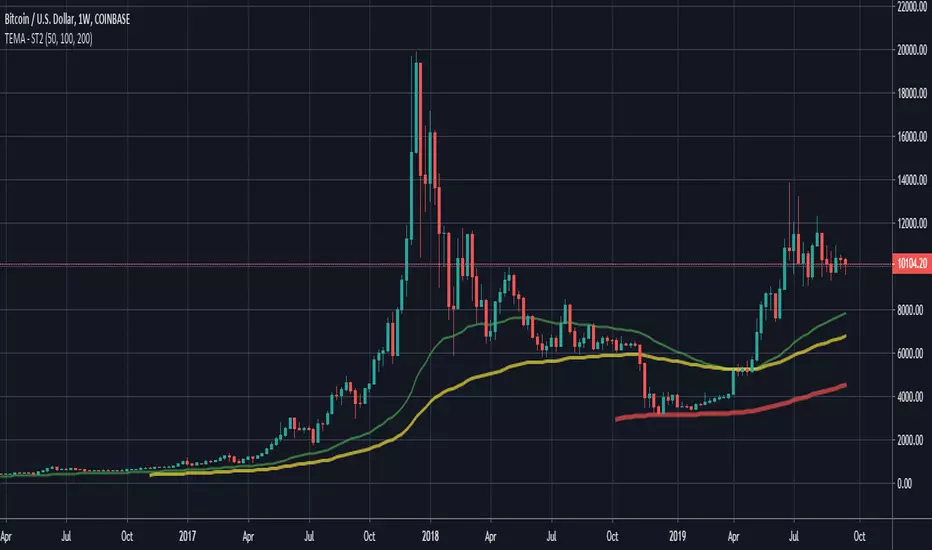
Scripting Tutorial 2 - Triple Exponential Moving AveragesThis script is for a triple exponential moving average indicator. It is meant as an educational script with well formatted styling, and references for specific functions.
Scripting Tutorial 1 - Simple Moving AverageThis script is for a simple moving average indicator. It is meant as an educational script with well formatted styling, and references for specific functions.

Alpha-Decreasing Exponential Moving AverageThe alpha parameter of this moving average decreases with every new bar on the chart, so it will become more slowly and slowly in course of time. Can act like additional support/resistance line but works in an acceptable way on weekly and monthly timeframes only.

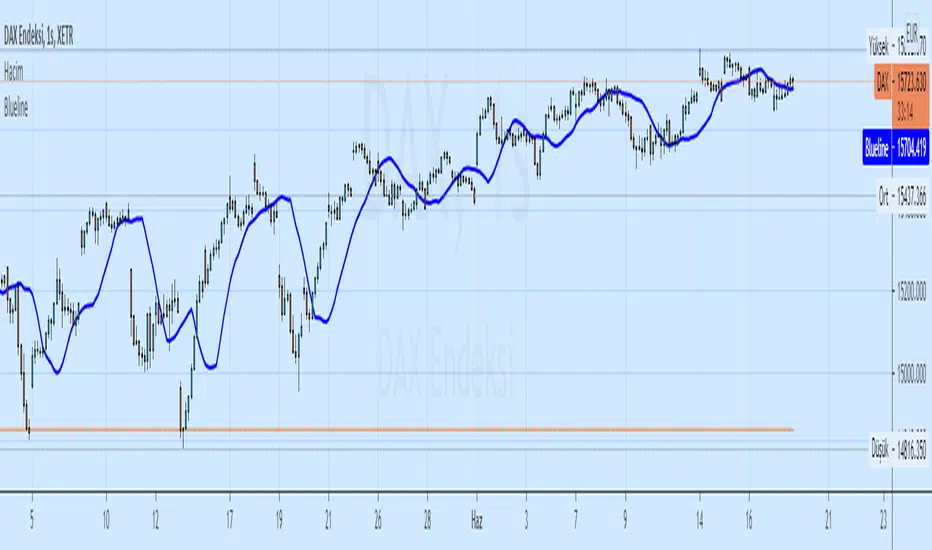
MMDVZ 1.0 - Moving Multi-Day VWAP ZonesVolatility adjusted moving multi-day VWAP zones
Directionality, trend and support/resistance levels at a glance
Useful for trading practically all kinds of stocks and futures.
Works well with many timeframes.
More updates to come, stay tuned

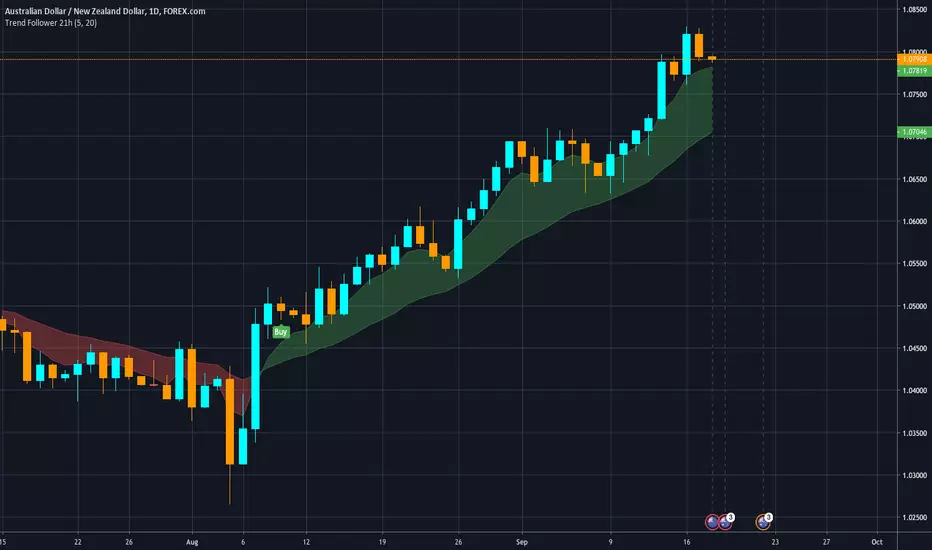
Trend Finder [Anan]Hello Friends,
This is so usefull MTF pane to know how powerfull the trend is (Bull/Bear)
It's so easy to use, just apply it on low time frame and ride the trend..


Smart Labelling - Candlestick ChartingThis is a full-fledged implementation of a system presented in an unique research paper 'Profitability of Candlestick Charting Patterns in the Stock Exchange of Thailand' (2017) on candlestick charting, candlestick patterns, trend identification methods, and testing.
You can easily find this paper in the Web. For example, visit: www.researchgate.net
This script is best suited for middle-to-higher time frames. Possible future developments: trend identification and factor calculation techniques.
Donate: PayPal (paypal.me)

TJD Parabolic SAR + Binary PivotsIdentifies support points, and pivots on the market, to place you in trending trades, and identify potential reversals.

Scott's historical ATR(volatility) percentileHistorical Volatility Percentile using Average True Range as measure of volatility.
Historical True Range Percentile


EMA 21,13,8 - scalping3 EMAs will help identify and predict uptrends and downtrends
-If EMAs are all above the candles it a sign to sell & if the EMAs are below its a sign to buy
- If the Green-8 EMA crosses or touches red candle then flips under the other EMAs & candles then it's time to sell
-If the Green-8 EMA crosses or touches green candle then flips above the other EMAs & candles then it's time to buy
- how far is the EMAs from the candle it'll show how strong the trend. combine this strategy with the stochastic oscillator & RSI to get the maximum benefit

Leeloo Quadruple (4x) Simple Moving AverageOne-stop shop for all of the simple moving averages because editing separately is annoying.

4x MTF RSI - by Redjinator 4x Multi-Timeframe RSI - by Redjinator (August 2019)
This is a new version of an old indicator of mine and has been updated for a much more accurate reading of timeframes greater than the on screen chart.
Features of this indicator are:
- under the hood it uses pine script v 4.0
- repainting issues normally caused by pulling data from higher timeframes has been eliminated.
- ability to plot up to RSI signals at one time.
- customized timeframe selection per RSI.
- ability to plot an average of the 4 customized RSI signals.
- visualized heatmapping for any selected RSI signal (including the average).
- by default it very closely resembles the clean look of a default RSI indicator.
I will be releasing more indicators for public use in the near future.
Thank you for viewing my work, I hope you find it useful!
-Redjinator
Looking for something more than my scripts of convenience? Check out Ape for long/short signals here: discord.gg
Do you like my work? Want to send me a BTC tip? - BTC Address: 14JXjyVRruvUTwWPjEtzthapfLqgM1Qj6E

AntiRekt RibbonThis script is a fork of the Madrid Ribbon, the only difference is that you can color your bars depending on the trend.
