Trend CCITrend CCI (TCCI) Indicator
Description:
The Trend CCI (TCCI) indicator is a unique combination of the Commodity Channel Index (CCI) and the Average True Range (ATR), designed to identify trends and market reversals with a refined sensitivity to price volatility. The indicator plots the CCI, adjusted by an ATR filter, and color-codes the trendline to signal uptrends and downtrends.
How It Works:
This indicator uses the CCI to measure price momentum and an ATR-based filter to smooth out market noise, making it easier to detect significant shifts in the market trend. Key parameters such as the ATR Period, ATR Multiplier, and CCI Period have been carefully chosen to optimize the indicator's performance:
1. ATR Period (default: 18)
The ATR Period determines the number of periods used to calculate the **Average True Range**, which reflects market volatility. In this case, an **ATR Period of 18** has been selected for several reasons:
Balance between responsiveness and noise reduction : A period of 18 strikes a balance between being responsive to recent price movements and filtering out minor fluctuations. Shorter ATR periods might be too reactive, creating false signals, while longer periods might miss shorter-term trends.
Adaptable to various market conditions : An 18-period ATR is suitable for both intraday and swing trading strategies, making it versatile across different time frames.
Standard industry practice : Many traders use ATR settings between 14 and 20 periods as a convention for detecting reliable volatility levels.
2. ATR Multiplier (default: 1.5)
The ATR Multiplier is applied to the ATR value to define how sensitive the indicator is to volatility. In this case, a multiplier of 1.5 has been chosen:
Avoiding whipsaws in low volatility markets: By setting the multiplier to 1.5, the indicator filters out smaller, less significant price movements, reducing the likelihood of whipsaw signals (i.e., false trend reversals during periods of low volatility).
Optimizing signal accuracy: A moderate multiplier like 1.5 ensures that the indicator only generates signals when the price moves a significant distance from the average range. Higher multipliers (e.g., 2.0) may ignore valid opportunities, while lower multipliers (e.g., 1.0) might create too many signals.
Enhancing trend clarity : The multiplier’s role in widening the range allows the indicator to respond more clearly during periods of strong trends, reducing signal noise and false positives.
3. CCI Period (default: 63)
The CCI Period defines the number of periods used to calculate the Commodity Channel Index. A 63-period CCI is selected based on the following considerations:
Smoothing the momentum calculation: A longer period, such as 63, is used to smooth out the CCI and reduce the effects of short-term price fluctuations. This period captures longer-term momentum, making it ideal for identifying more significant market trends.
-Filtering out short-term noise: While shorter CCI periods (e.g., 14 or 20) may be more reactive, they tend to produce more signals, some of which may be false. A 63-period CCI focuses on stronger and more sustained price movements, providing fewer but higher-quality signals.
Adapted to intermediate trading: A 63-period CCI aligns well with traders looking for medium-term trend-following strategies, striking a balance between long-term trend identification and responsiveness to significant price shifts.
How to Use:
Green Area: When the trendline turns green, it signals that the CCI is positive, reflecting upward momentum. This can be interpreted as a buy signal, indicating the potential for long positions or continuing bullish trades.
Red Area: When the trendline turns red, it signals that the CCI is negative, reflecting downward momentum. This can be interpreted as a sell signal, indicating potential short positions or bearish trades.
ATR Filter: The ATR helps reduce false signals by ignoring minor price movements. Traders can adjust the ATR Multiplier to make the indicator more or less sensitive based on market conditions. A lower multiplier (e.g., 1.2) may increase signal frequency, while a higher multiplier (e.g., 2.0) reduces it.
Originality:
The Trend CCI (TCCI) stands out due to its combination of the CCI and ATR. While many indicators simply plot raw CCI values, this script enhances the CCI’s effectiveness by incorporating an ATR-based volatility filter. This ensures that only significant trends trigger signals, making it a more reliable tool in volatile markets. The choice of the ATR period, multiplier, and CCI period ensures a refined balance between trend detection and noise reduction, distinguishing it as a powerful trend-following indicator.
Additionally, the visual aspect—using color-coded trendlines that dynamically shift between green and red—simplifies the interpretation of market trends, offering traders a clear and immediate understanding of trend direction and momentum strength.
Final Recommendations:
Use in Trending Markets The TCCI is most effective in trending markets, where its signals align with broader market momentum. In sideways or low-volatility markets, consider adjusting the ATR multiplier or using other complementary indicators to confirm the signals.
Risk Management: Always integrate robust risk management practices, such as using stop-loss orders and position sizing, to protect against sudden market reversals or periods of heightened volatility.
Adjust for Volatility: Consider the volatility of the asset being traded. In highly volatile assets, a higher ATR multiplier (e.g., 2.0) may be necessary to filter out noise, while in more stable assets, a lower multiplier (e.g., 1.2) might generate earlier signals.
By using the Trend CCI (TCCI) indicator with a deeper understanding of its key parameters, traders can better identify trends, reduce noise, and improve their overall decision-making in the markets.
Good Profits!
ATR

ATR Price Targets (Daily, Weekly, Monthly)This indicator calculates and displays dynamic price targets based on the Average True Range (ATR) for daily, weekly, and monthly timeframes. It’s designed to help traders set volatility-based price targets for more precise stop-losses, take-profit levels, and trade management.
Features:
Daily, Weekly, and Monthly ATR Targets: Automatically calculates and plots upper and lower price targets based on ATR values for each timeframe.
Risk Management Tool: Ideal for setting stop-loss and take-profit levels based on market volatility.
Customizable Settings: You can adjust the ATR length and multiplier to match your preferred trading style and risk tolerance.
Visual Alerts: Background colors change when price reaches or exceeds the calculated targets, providing easy visual cues for decision-making.
How to Use:
Use the upper and lower price targets to set realistic exit points for your trades.
Adjust the ATR multiplier for more or less conservative targets based on market volatility.
Apply this across multiple timeframes to combine long-term and short-term volatility trends.
This indicator is perfect for traders looking to incorporate volatility analysis into their trading strategy using ATR.

Adaptive VWAP [QuantAlgo]Introducing the Adaptive VWAP by QuantAlgo 📈🧬
Enhance your trading and investing strategies with the Adaptive VWAP , a versatile tool designed to provide dynamic insights into market trends and price behavior. This indicator offers a flexible approach to VWAP calculations by allowing users to adapt it based on lookback periods or fixed timeframes, making it suitable for a wide range of market conditions.
🌟 Key Features:
🛠 Customizable VWAP Settings: Choose between an adaptive VWAP that adjusts based on a rolling lookback period, or switch to a fixed timeframe (e.g., daily, weekly, monthly) for a more structured approach. Adjust the VWAP to suit your trading or investing style.
💫 Dynamic Bands and ATR Filter: Configurable deviation bands with multipliers allow you to visualize price movement around VWAP, while an ATR-based noise filter helps reduce false signals during periods of market fluctuation.
🎨 Trend Visualization: Color-coded trend identification helps you easily spot uptrends and downtrends based on VWAP positioning. The indicator fills the areas between the bands for clearer visual representation of price volatility and trend strength.
🔔 Custom Alerts: Set up alerts for when price crosses above or below the VWAP, signaling potential uptrend or downtrend opportunities. Stay informed without needing to monitor the charts constantly.
✍️ How to Use:
✅ Add the Indicator: Add the Adaptive VWAP to your favourites and apply to your chart. Choose between adaptive or timeframe-based VWAP calculation, adjust the lookback period, and configure the deviation bands to your preferred settings.
👀 Monitor Bands and Trends: Watch for price interaction with the VWAP and its deviation bands. The color-coded signals and band fills help identify potential trend shifts or price extremes.
🔔 Set Alerts: Configure alerts for uptrend and downtrend signals based on price crossing the VWAP, so you’re always informed of significant market movements.
⚙️ How It Works:
The Adaptive VWAP adjusts its calculation based on the user’s chosen configuration, allowing for a flexible approach to market analysis. The adaptive setting uses a rolling lookback period to continuously adjust the VWAP, while the fixed timeframe option anchors VWAP to key timeframes like daily, weekly, or monthly periods. This flexibility enables traders and investors to use the tool in various market environments.
Deviation bands, calculated with customizable multipliers, provide a clear visual of how far the price has moved from the VWAP, helping you gauge potential overbought or oversold conditions. To reduce false signals, an ATR-based filter can be applied, ensuring that only significant price movements trigger trend confirmations.
The tool also includes a fast exponential smoothing function for the VWAP, helping smooth out price fluctuations without sacrificing responsiveness. Trend confirmation is reinforced by the number of bars that price stays above or below the VWAP, ensuring a more consistent trend identification process.
Disclaimer:
The Adaptive VWAP is designed to enhance your market analysis but should not be relied upon as the sole basis for trading or investing decisions. Always combine it with other analytical tools and practices. No statements or signals from this indicator constitute financial advice. Past performance is not indicative of future results.

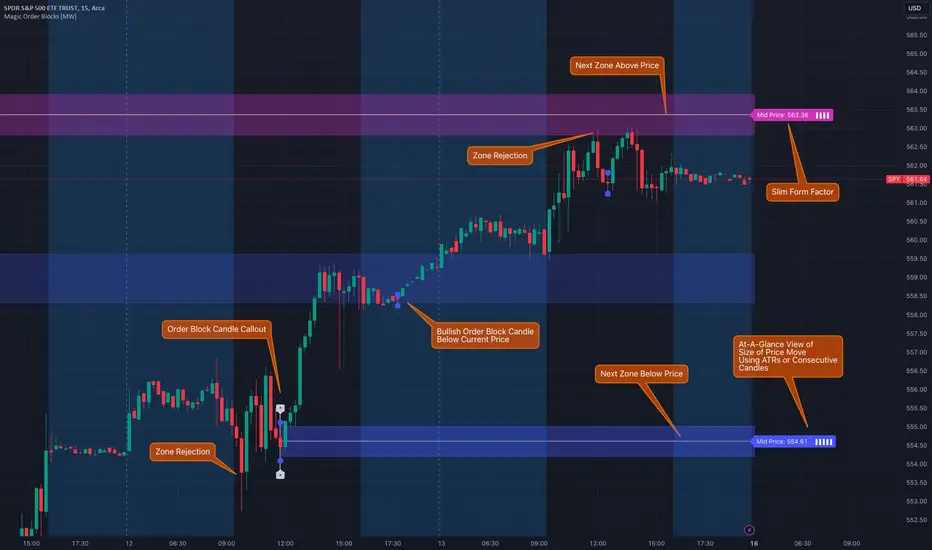
Magic Order Blocks [MW]Add a slim design, minimalist view of the most relevant higher and lower order blocks to your chart. Use our novel method of filtering that uses both the the number of consecutive bullish or bearish candles that follow the order block, and the number of ATRs that the asset’s price changed following the order block. View just the order blocks above and below the current price, or view the backgrounds for each and every one. And, if you're up to it, dig into a comprehensive view of the data for each order block candle.
Settings:
General Settings
Minimum # of Consecutive Bars Following Order Block
Show Bullish Order Blocks Below / Hide Last Bullish Block
Show Bearish Order Blocks Above / Hide Last Bearish Block
Use ATR Filter - Select # of ATRs Below
Closest Order Block is Followed by This Many ATRs
Preferences
Right Offset of Indicator Label
Show Mid-Line from Recent Order Block Indicator Label
Use ATRs Instead of Consecutive Candles in Label Indicator
Show Timestamp of Recent Order Block
Show Large Order Block Detail Labels
Show Small Order Block Labels
Background Settings
Show Background for Recent Order Block Indicator Label
# of Backgrounds to Show Before Now
Show All Bullish Order Block Backgrounds
Show All Bearish Order Block Backgrounds
Calculations
This indicator creates a matrix of each order block that is followed by the user-specified number of consecutive bullish or bearish candles. The data can be further filtered by the number of ATRs that the price moves after the order block - also user-defined. The most recent bearish order block above the current price takes arrays from the initial filtered matrix of arrays, filters once more by the “mid-price” of the order block (the average between the order block candle high and low) and selects the last element from this order block matrix. The same follows for the latest bearish order block above the current price.
How to Use
An order block refers to a price range or zone on a chart where large institutional orders have been placed, causing a significant shift in market direction. These zones are crucial because they often indicate areas of strong buying or selling interest, which can lead to future support or resistance levels. Traders use order blocks to identify potential points of market reversal or continuation.
The Magic Order Blocks default view shows the most recent overhead bearish order block above the current price, and the most recent bullish order block below. These can presumably act as support or resistance levels, because they reflect the last price where a significant price move occurred. “Significant” meaning that the order block candle was followed by many consecutive bullish or bearish candles. Based on the user-defined settings, it can also mean that price moved multiples of the asset's average true range (ATR). More consecutive candles means that the duration of the move lasted a long time. A higher ATR move indicates that the price moved impulsively in one direction.
The default view also shows a label to the right of the current price that provides the price level, the time stamp of the order block (optional), and a sequence of bars that show the significance of the level. By default, these bars represent the number of ATRs that price rose or fell following the order block, but they can be toggled to show the number of consecutive bullish or bearish candles that followed the order block.
Although the default view provides the zones that are most relevant to the current price, past order block candles can also be identified visually with labels as well with translucent backgrounds color-coded for bullish or bearish bias. Overlapping backgrounds can identify an area that has been repeatedly been an area of support or resistance.
A detailed view of each order block can also be viewed the includes the following data points:
Bar Index
Timestamp
Consecutive Accumulated Volume
Consecutive Bars
Price Change over Consecutive Bars
Price/Volume Ratio Over Consecutive Bars
Mid Price of Order Block
High Price of Order Block
Low Price of Order Block
ATRs over Consecutive Bars
- Other Usage Notes and Limitations:
The calculations used only provide an estimated relationship or a close approximation, and are not exact.
It's important for traders to be aware of the limitations of any indicator and to use them as part of a broader, well-rounded trading strategy that includes risk management, fundamental analysis, and other tools that can help with reducing false signals, determining trend direction, and providing additional confirmation for a trade decision. Diversifying strategies and not relying solely on one type of indicator or analysis can help mitigate some of these risks.
Things to keep in mind. Longer timeframes don’t necessarily have a as many consecutive candle drops or gains as with shorter timeframes, so be sure to adjust your settings when moving to 1 hour, 1 day, or 1 week timeframes from 1 minute, 5 minute, or 15 minute timeframes.
Average True Range with Price MAATR with Price Moving Average Indicator
This custom indicator combines the Average True Range (ATR) with a Price Moving Average (MA) to help traders analyze market volatility in percent to the price.
Key Components:
Average True Range (ATR)
Price Moving Average (MA)
ATR/Price in Percent
ATR/Price in Percent
Purpose: This ratio helps traders understand the relative size of the ATR compared to the current price, providing a clearer sense of how significant the volatility is in proportion to the price level.
Calculation: ATR is divided by the current closing price and multiplied by 100 to express it as a percentage. This makes it easier to compare volatility across assets with different price ranges.
Plot: This is plotted as a percentage, making it easier to gauge whether the volatility is proportionally high or low compared to the asset's price.
Usage:
This indicator is designed to help identify the most volatile tokens, making it ideal for configuring a Grid Bot to maximize profit. By focusing on high-volatility assets, traders can capitalize on larger price swings within the grid, increasing the potential for more profitable trades.
Features:
Customizable Smoothing Method: Choose from RMA (Relative Moving Average), SMA (Simple Moving Average), EMA (Exponential Moving Average), or WMA (Weighted Moving Average) for both ATR and the Price Moving Average.
Dual Perspective: The indicator provides both volatility analysis (ATR) and trend analysis (Price MA) in a single view.
Proportional Volatility: The ATR/Price (%) ratio adds a layer of context by showing how volatile the asset is relative to its current price.

Volatility Trend Bands [UAlgo]The Volatility Trend Bands is a trend-following indicator that combines the concepts of volatility and trend detection. Built using the Average True Range (ATR) to measure volatility, this indicator dynamically adjusts upper and lower bands around price movements. The bands act as dynamic support and resistance levels, making it easier to identify trend shifts and potential entry and exit points.
With the ATR multiplier, this indicator effectively captures volatility-based shifts in the market. The use of midline values allows for accurate trend detection, which is displayed through color-coded signals on the chart. Additionally, this tool provides clear buy and sell signals, accompanied by intuitive graphical markers for ease of use.
The Volatility Trend Bands is ideal for traders seeking an adaptive trend-following method that responds to changing market conditions while maintaining robust volatility control.
🔶 Key Features
Dynamic Support and Resistance: The indicator utilizes volatility to create dynamic bands. The upper band acts as resistance, and the lower band acts as support for the price. Wider bands indicate higher volatility, while narrower bands indicate lower volatility.
Customizable Inputs
You can tailor the indicator to your strategy by adjusting the:
Price Source: Select the price data (e.g., closing price) used for calculations.
ATR Length: Define the lookback period for the Average True Range (ATR) volatility measure.
ATR Multiplier: This factor controls the width of the volatility bands relative to the ATR value.
Color Options: Choose colors for the bands and signal arrows for better visualization.
Visual Signals: Arrows ("▲" for buy, "▼" for sell) appear on the chart when the trend changes, providing clear entry point indications.
Alerts: Integrated alerts for both buy and sell conditions, allowing you to receive notifications for potential trade opportunities.
🔶 Interpreting Indicator
Upper and Lower Bands: The upper and lower bands are dynamic, adjusting based on market volatility using the ATR. These bands serve as adaptive support and resistance levels. When price breaks above the upper band, it indicates a potential bullish breakout, signaling a strong uptrend. Conversely, a break below the lower band signals a bearish breakout, indicating a downtrend.
Buy/Sell Signals: The indicator provides clear buy and sell signals at breakout points. A buy signal ("▲") is generated when the price breaks above the upper band, suggesting the start of a bullish trend. A sell signal ("▼") is triggered when the price breaks below the lower band, indicating the beginning of a bearish trend. These signals help traders identify potential entry and exit points at key breakout levels.
Color-Coded Bars: The bars on the chart change color based on the trend direction. Teal bars represent bullish momentum, while purple bars signify bearish momentum. This color coding provides a quick visual cue about the market's current direction.
🔶 Disclaimer
Use with Caution: This indicator is provided for educational and informational purposes only and should not be considered as financial advice. Users should exercise caution and perform their own analysis before making trading decisions based on the indicator's signals.
Not Financial Advice: The information provided by this indicator does not constitute financial advice, and the creator (UAlgo) shall not be held responsible for any trading losses incurred as a result of using this indicator.
Backtesting Recommended: Traders are encouraged to backtest the indicator thoroughly on historical data before using it in live trading to assess its performance and suitability for their trading strategies.
Risk Management: Trading involves inherent risks, and users should implement proper risk management strategies, including but not limited to stop-loss orders and position sizing, to mitigate potential losses.
No Guarantees: The accuracy and reliability of the indicator's signals cannot be guaranteed, as they are based on historical price data and past performance may not be indicative of future results.

ATR+Order Block IndicatorThe ATR+Order Block Indicator is a unique and comprehensive tool designed to combine volatility-based analysis with key price action levels to provide traders with reliable entry and exit points. This indicator merges the Average True Range (ATR) for dynamic trailing stop calculation with order block detection to identify significant support and resistance zones on the chart. This combination offers traders a powerful blend of trend-following and price level analysis for improved trading decisions.
How the Components Work Together:
1. ATR-Based Trailing Stop:
• The Average True Range (ATR) is a widely used volatility indicator that measures the degree of price movement over a specified period. In this indicator, the ATR is used to create a trailing stop that dynamically adjusts to market conditions.
• How It Works: The ATR value is multiplied by a user-defined multiplier (ATR Multiplier) to set the distance of the trailing stop from the current price. This trailing stop moves with the price:
• If the price moves upwards, the trailing stop adjusts higher, ensuring it only moves in the direction of the trade.
• If the price moves downwards, the trailing stop adjusts lower accordingly.
• Purpose: This trailing stop helps traders manage risk by automatically adjusting to market volatility, ensuring that stops are not too tight in volatile conditions or too wide in quieter markets. It also helps lock in profits while maintaining a position in the market’s direction.
2. Order Block Detection:
• Order blocks are areas on the chart where significant buying (accumulation) or selling (distribution) has occurred. These zones often act as potential support or resistance levels due to the presence of unfilled buy or sell orders by large institutions or traders.
• How It Works: The indicator identifies the highest high (seller order block) and the lowest low (buyer order block) within a user-defined lookback period. These are plotted on the chart:
• Buyer Order Block: Represents a potential support area where buying interest is likely to reappear.
• Seller Order Block: Represents a potential resistance area where selling interest may reemerge.
• Purpose: By identifying these order blocks, traders can anticipate potential price reversals or continuations, aligning their trades with key market levels where significant buying or selling has occurred.
Justification for Combining These Components:
1. Enhanced Signal Accuracy and Context:
• The combination of ATR-based trailing stops with order block detection provides a dual-layered approach to trade decisions:
• ATR Trailing Stop offers trend-following signals based on volatility, helping traders capture market momentum.
• Order Blocks provide context to these signals by highlighting critical price levels where market participants have previously shown strong interest.
• This fusion allows traders to filter signals more effectively, ensuring trades are aligned with both market trends and key support/resistance zones.
2. Dynamic Risk Management:
• Using the ATR to set a dynamic trailing stop ensures that the stop-loss level adapts to the changing volatility of the market. When combined with order block detection, traders gain an additional layer of risk management:
• Stop Loss Placement: Traders can place stops just outside identified order blocks to protect against sudden price reversals while maintaining a tight stop aligned with current market volatility.
3. Reducing Market Noise and Avoiding False Signals:
• The indicator includes a mechanism to avoid repetitive signals, requiring a minimum gap between signals. This reduces noise and helps traders avoid multiple false entries in choppy market conditions.
• Order Blocks provide additional validation: For example, a buy signal generated near a Buyer Order Block carries more weight, as it aligns both with the ATR-based momentum and a key support area.
4. Improving Entry and Exit Strategies:
• Entry Points: The indicator generates buy (long) signals when the price crosses above the ATR trailing stop and sell (short) signals when it crosses below. These signals are enhanced by considering their proximity to order blocks, ensuring trades are initiated at strategic price levels.
• Exit Points: The ATR trailing stop provides a dynamic exit strategy, allowing trades to run while adjusting to market volatility. Traders can also use order blocks as targets or potential reversal points to exit trades.
5. Providing a Comprehensive Trading Tool:
• This indicator is unique in its integration of volatility and price level analysis, offering a well-rounded approach to trading. It combines the best of both worlds: trend-following momentum with the ATR and price action sensitivity through order blocks, making it suitable for different market conditions and trading styles.
How to Use the Indicator:
• Set the Parameters:
• Choose an ATR Period (default is 10) to define the number of bars for ATR calculation.
• Set the ATR Multiplier (default is 1.5) to adjust the sensitivity of the trailing stop.
• Define the Order Block Lookback Period (default is 20) to determine how many bars back the script will search for order blocks. Recommended 50.
• Interpret the Signals:
• BUY Signal: When the price crosses above the ATR trailing stop, indicating upward momentum. Confirm this signal by checking if it is near a Buyer Order Block.
• SELL Signal: When the price crosses below the ATR trailing stop, indicating downward momentum. Look for proximity to a Seller Order Block for added confidence.
• Monitor and Manage Trades:
• Use the ATR trailing stop for dynamic stop-loss placement.
• Watch for price action around the order blocks to make informed decisions about taking profits or cutting losses.
Conclusion:
The ATR+Order Block Indicator combines volatility and price action analysis in a unique way that offers traders a comprehensive tool for making informed trading decisions. By leveraging the strengths of both ATR-based dynamic stops and order block detection, it provides a balanced approach to trend-following and support/resistance trading, enhancing overall trading effectiveness and confidence.

Intramarket Difference Index StrategyHi Traders !!
The IDI Strategy:
In layman’s terms this strategy compares two indicators across markets and exploits their differences.
note: it is best the two markets are correlated as then we know we are trading a short to long term deviation from both markets' general trend with the assumption both markets will trend again sometime in the future thereby exhausting our trading opportunity.
📍 Import Notes:
This Strategy calculates trade position size independently (i.e. risk per trade is controlled in the user inputs tab), this means that the ‘Order size’ input in the ‘Properties’ tab will have no effect on the strategy. Why ? because this allows us to define custom position size algorithms which we can use to improve our risk management and equity growth over time. Here we have the option to have fixed quantity or fixed percentage of equity ATR (Average True Range) based stops in addition to the turtle trading position size algorithm.
‘Pyramiding’ does not work for this strategy’, similar to the order size input togeling this input will have no effect on the strategy as the strategy explicitly defines the maximum order size to be 1.
This strategy is not perfect, and as of writing of this post I have not traded this algo.
Always take your time to backtests and debug the strategy.
🔷 The IDI Strategy:
By default this strategy pulls data from your current TV chart and then compares it to the base market, be default BINANCE:BTCUSD . The strategy pulls SMA and RSI data from either market (we call this the difference data), standardizes the data (solving the different unit problem across markets) such that it is comparable and then differentiates the data, calling the result of this transformation and difference the Intramarket Difference (ID). The formula for the the ID is
ID = market1_diff_data - market2_diff_data (1)
Where
market(i)_diff_data = diff_data / ATR(j)_market(i)^0.5,
where i = {1, 2} and j = the natural numbers excluding 0
Formula (1) interpretation is the following
When ID > 0: this means the current market outperforms the base market
When ID = 0: Markets are at long run equilibrium
When ID < 0: this means the current market underperforms the base market
To form the strategy we define one of two strategy type’s which are Trend and Mean Revesion respectively.
🔸 Trend Case:
Given the ‘‘Strategy Type’’ is equal to TREND we define a threshold for which if the ID crosses over we go long and if the ID crosses under the negative of the threshold we go short.
The motivating idea is that the ID is an indicator of the two symbols being out of sync, and given we know volatility clustering, momentum and mean reversion of anomalies to be a stylised fact of financial data we can construct a trading premise. Let's first talk more about this premise.
For some markets (cryptocurrency markets - synthetic symbols in TV) the stylised fact of momentum is true, this means that higher momentum is followed by higher momentum, and given we know momentum to be a vector quantity (with magnitude and direction) this momentum can be both positive and negative i.e. when the ID crosses above some threshold we make an assumption it will continue in that direction for some time before executing back to its long run equilibrium of 0 which is a reasonable assumption to make if the market are correlated. For example for the BTCUSD - ETHUSD pair, if the ID > +threshold (inputs for MA and RSI based ID thresholds are found under the ‘‘INTRAMARKET DIFFERENCE INDEX’’ group’), ETHUSD outperforms BTCUSD, we assume the momentum to continue so we go long ETHUSD.
In the standard case we would exit the market when the IDI returns to its long run equilibrium of 0 (for the positive case the ID may return to 0 because ETH’s difference data may have decreased or BTC’s difference data may have increased). However in this strategy we will not define this as our exit condition, why ?
This is because we want to ‘‘let our winners run’’, to achieve this we define a trailing Donchian Channel stop loss (along with a fixed ATR based stop as our volatility proxy). If we were too use the 0 exit the strategy may print a buy signal (ID > +threshold in the simple case, market regimes may be used), return to 0 and then print another buy signal, and this process can loop may times, this high trade frequency means we fail capture the entire market move lowering our profit, furthermore on lower time frames this high trade frequencies mean we pay more transaction costs (due to price slippage, commission and big-ask spread) which means less profit.
By capturing the sum of many momentum moves we are essentially following the trend hence the trend following strategy type.
Here we also print the IDI (with default strategy settings with the MA difference type), we can see that by letting our winners run we may catch many valid momentum moves, that results in a larger final pnl that if we would otherwise exit based on the equilibrium condition(Valid trades are denoted by solid green and red arrows respectively and all other valid trades which occur within the original signal are light green and red small arrows).
another example...
Note: if you would like to plot the IDI separately copy and paste the following code in a new Pine Script indicator template.
indicator("IDI")
// INTRAMARKET INDEX
var string g_idi = "intramarket diffirence index"
ui_index_1 = input.symbol("BINANCE:BTCUSD", title = "Base market", group = g_idi)
// ui_index_2 = input.symbol("BINANCE:ETHUSD", title = "Quote Market", group = g_idi)
type = input.string("MA", title = "Differrencing Series", options = , group = g_idi)
ui_ma_lkb = input.int(24, title = "lookback of ma and volatility scaling constant", group = g_idi)
ui_rsi_lkb = input.int(14, title = "Lookback of RSI", group = g_idi)
ui_atr_lkb = input.int(300, title = "ATR lookback - Normalising value", group = g_idi)
ui_ma_threshold = input.float(5, title = "Threshold of Upward/Downward Trend (MA)", group = g_idi)
ui_rsi_threshold = input.float(20, title = "Threshold of Upward/Downward Trend (RSI)", group = g_idi)
//>>+----------------------------------------------------------------+}
// CUSTOM FUNCTIONS |
//<<+----------------------------------------------------------------+{
// construct UDT (User defined type) containing the IDI (Intramarket Difference Index) source values
// UDT will hold many variables / functions grouped under the UDT
type functions
float Close // close price
float ma // ma of symbol
float rsi // rsi of the asset
float atr // atr of the asset
// the security data
getUDTdata(symbol, malookback, rsilookback, atrlookback) =>
indexHighTF = barstate.isrealtime ? 1 : 0
= request.security(symbol, timeframe = timeframe.period,
expression = [close , // Instentiate UDT variables
ta.sma(close, malookback) ,
ta.rsi(close, rsilookback) ,
ta.atr(atrlookback) ])
data = functions.new(close_, ma_, rsi_, atr_)
data
// Intramerket Difference Index
idi(type, symbol1, malookback, rsilookback, atrlookback, mathreshold, rsithreshold) =>
threshold = float(na)
index1 = getUDTdata(symbol1, malookback, rsilookback, atrlookback)
index2 = getUDTdata(syminfo.tickerid, malookback, rsilookback, atrlookback)
// declare difference variables for both base and quote symbols, conditional on which difference type is selected
var diffindex1 = 0.0, var diffindex2 = 0.0,
// declare Intramarket Difference Index based on series type, note
// if > 0, index 2 outpreforms index 1, buy index 2 (momentum based) until equalibrium
// if < 0, index 2 underpreforms index 1, sell index 1 (momentum based) until equalibrium
// for idi to be valid both series must be stationary and normalised so both series hae he same scale
intramarket_difference = 0.0
if type == "MA"
threshold := mathreshold
diffindex1 := (index1.Close - index1.ma) / math.pow(index1.atr*malookback, 0.5)
diffindex2 := (index2.Close - index2.ma) / math.pow(index2.atr*malookback, 0.5)
intramarket_difference := diffindex2 - diffindex1
else if type == "RSI"
threshold := rsilookback
diffindex1 := index1.rsi
diffindex2 := index2.rsi
intramarket_difference := diffindex2 - diffindex1
//>>+----------------------------------------------------------------+}
// STRATEGY FUNCTIONS CALLS |
//<<+----------------------------------------------------------------+{
// plot the intramarket difference
= idi(type,
ui_index_1,
ui_ma_lkb,
ui_rsi_lkb,
ui_atr_lkb,
ui_ma_threshold,
ui_rsi_threshold)
//>>+----------------------------------------------------------------+}
plot(intramarket_difference, color = color.orange)
hline(type == "MA" ? ui_ma_threshold : ui_rsi_threshold, color = color.green)
hline(type == "MA" ? -ui_ma_threshold : -ui_rsi_threshold, color = color.red)
hline(0)
Note it is possible that after printing a buy the strategy then prints many sell signals before returning to a buy, which again has the same implication (less profit. Potentially because we exit early only for price to continue upwards hence missing the larger "trend"). The image below showcases this cenario and again, by allowing our winner to run we may capture more profit (theoretically).
This should be clear...
🔸 Mean Reversion Case:
We stated prior that mean reversion of anomalies is an standerdies fact of financial data, how can we exploit this ?
We exploit this by normalizing the ID by applying the Ehlers fisher transformation. The transformed data is then assumed to be approximately normally distributed. To form the strategy we employ the same logic as for the z score, if the FT normalized ID > 2.5 (< -2.5) we buy (short). Our exit conditions remain unchanged (fixed ATR stop and trailing Donchian Trailing stop)
🔷 Position Sizing:
If ‘‘Fixed Risk From Initial Balance’’ is toggled true this means we risk a fixed percentage of our initial balance, if false we risk a fixed percentage of our equity (current balance).
Note we also employ a volatility adjusted position sizing formula, the turtle training method which is defined as follows.
Turtle position size = (1/ r * ATR * DV) * C
Where,
r = risk factor coefficient (default is 20)
ATR(j) = risk proxy, over j times steps
DV = Dollar Volatility, where DV = (1/Asset Price) * Capital at Risk
🔷 Risk Management:
Correct money management means we can limit risk and increase reward (theoretically). Here we employ
Max loss and gain per day
Max loss per trade
Max number of consecutive losing trades until trade skip
To read more see the tooltips (info circle).
🔷 Take Profit:
By defualt the script uses a Donchain Channel as a trailing stop and take profit, In addition to this the script defines a fixed ATR stop losses (by defualt, this covers cases where the DC range may be to wide making a fixed ATR stop usefull), ATR take profits however are defined but optional.
ATR SL and TP defined for all trades
🔷 Hurst Regime (Regime Filter):
The Hurst Exponent (H) aims to segment the market into three different states, Trending (H > 0.5), Random Geometric Brownian Motion (H = 0.5) and Mean Reverting / Contrarian (H < 0.5). In my interpretation this can be used as a trend filter that eliminates market noise.
We utilize the trending and mean reverting based states, as extra conditions required for valid trades for both strategy types respectively, in the process increasing our trade entry quality.
🔷 Example model Architecture:
Here is an example of one configuration of this strategy, combining all aspects discussed in this post.
Future Updates
- Automation integration (next update)

lib_no_delayLibrary "lib_no_delay"
This library contains modifications to standard functions that return na before reaching the bar of their 'length' parameter.
That is because they do not compromise speed at current time for correct results in the past. This is good for live trading in short timeframes but killing applications on Monthly / Weekly timeframes if instruments, like in crypto, do not have extensive history (why would you even trade the monthly on a meme coin ... not my decision).
Also, some functions rely on source (value at previous bar), which is not available on bar 1 and therefore cascading to a na value up to the last bar ... which in turn leads to a non displaying indicator and waste of time debugging this)
Anyway ... there you go, let me know if I should add more functions.
sma(source, length)
Parameters:
source (float) : Series of values to process.
length (simple int) : Number of bars (length).
Returns: Simple moving average of source for length bars back.
ema(source, length)
Parameters:
source (float) : Series of values to process.
length (simple int) : Number of bars (length).
Returns: (float) The exponentially weighted moving average of the source.
rma(source, length)
Parameters:
source (float) : Series of values to process.
length (simple int) : Number of bars (length).
Returns: Exponential moving average of source with alpha = 1 / length.
atr(length)
Function atr (average true range) returns the RMA of true range. True range is max(high - low, abs(high - close ), abs(low - close )). This adapted version extends ta.atr to start without delay at first bar and deliver usable data instead of na by averaging ta.tr(true) via manual SMA.
Parameters:
length (simple int) : Number of bars back (length).
Returns: Average true range.
rsi(source, length)
Relative strength index. It is calculated using the ta.rma() of upward and downward changes of source over the last length bars. This adapted version extends ta.rsi to start without delay at first bar and deliver usable data instead of na.
Parameters:
source (float) : Series of values to process.
length (simple int) : Number of bars back (length).
Returns: Relative Strength Index.

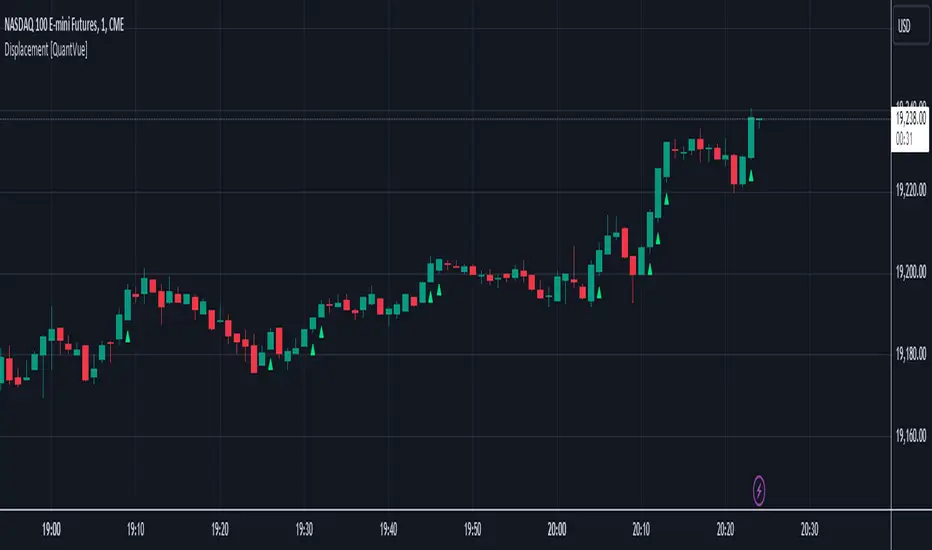
Displacement [QuantVue]Displacement refers to a significant and forceful price movement that indicates a potential shift in market sentiment or trend. Displacement is characterized by a strong push in price action, often seen after a period of consolidation or within a trending market. It is a key concept used to identify the strength of a move and to confirm the direction of the market.
The "Displacement" indicator does this by focusing on identifying strong, directional price movements by combining candlestick analysis with volatility (ATR).
Displacement often appears as a group of candles that are all positioned in the same direction, these candles typically have large bodies and short wicks.
How the indicator works:
Body Size Requirement: Ensures that only candles with a significant body size (relative to their total range) are considered, helping to identify strong market moves.
Consecutive Candle Analysis: Identifies shifts in market sentiment by requiring a series of consecutive bullish or bearish candles to confirm a potential change in trend.
ATR-Based Analysis: Uses the Average True Range (ATR) to gauge market volatility and filter out minor price fluctuations, focusing on substantial movements.
Once all of the requirements are met a triangle is plotted above or below the bar.
Trend Signals with TP & SL [UAlgo] StrategyThe "Trend Signals with TP & SL Strategy" is a trading strategy designed to capture trend continuation signals while incorporating sophisticated risk management techniques. This strategy is tailored for traders who wish to capitalize on trending market conditions with precise entry and exit points, automatically calculating Take Profit (TP) and Stop Loss (SL) levels based on either Average True Range (ATR) or percentage values. The strategy aims to enhance trade management by preventing multiple simultaneous positions and dynamically adapting to changing market conditions.
This strategy is highly configurable, allowing traders to adjust sensitivity, the ATR calculation method, and the cloud moving average length. Additionally, the strategy can display buy and sell signals directly on the chart, along with visual representation of entry points, stop losses, and take profits. It also features a cloud-based trend analysis using a MACD-driven color fill that indicates the strength and direction of the trend.
🔶 Key Features
Configurable Trend Continuation Signals:
Source Selection: The strategy uses the midpoint of the high-low range as the default source, but it is adjustable.
Sensitivity: The sensitivity of the trend signals can be adjusted using a multiplier, ranging from 0.5 to 5.
ATR Calculation: The strategy allows users to choose between two ATR calculation methods for better adaptability to different market conditions.
Cloud Moving Average: Traders can adjust the cloud moving average length, which is used in conjunction with MACD to provide a visual trend indication.
Take Profit & Stop Loss Management:
ATR-Based or Percent-Based: The strategy offers flexibility in setting TP and SL levels, allowing traders to choose between ATR-based multipliers or fixed percentage values.
Dynamic Adjustment: TP and SL levels are dynamically adjusted according to the selected method, ensuring trades are managed based on real-time market conditions.
Prevention of Multiple Positions:
Single Position Control: To reduce risk and enhance strategy reliability, the strategy includes an option to prevent multiple positions from being opened simultaneously.
Visual Trade Indicators:
Buy/Sell Signals: Clearly displays buy and sell signals on the chart for easy interpretation.
Entry, SL, and TP Lines: Draws lines for entry price, stop loss, and take profit directly on the chart, helping traders to monitor trades visually.
Trend Cloud: A color-filled cloud based on MACD and the cloud moving average provides a visual cue of the trend’s direction and strength.
Performance Summary Table:
In-Chart Statistics: A table in the top right of the chart displays key performance metrics, including total trades, wins, losses, and win rate percentage, offering a quick overview of the strategy’s effectiveness.
🔶 Interpreting the Indicator
Trend Signals: The strategy identifies trend continuation signals based on price action relative to an ATR-based threshold. A buy signal is generated when the price crosses above a key level, indicating an uptrend. Conversely, a sell signal occurs when the price crosses below a level, signaling a downtrend.
Cloud Visualization: The cloud, derived from MACD and moving averages, changes color to reflect the current trend. A positive cloud in aqua suggests an uptrend, while a red cloud indicates a downtrend. The transparency of the cloud offers further nuance, with more solid colors denoting stronger trends.
Entry and Exit Management: Once a trend signal is generated, the strategy automatically sets TP and SL levels based on your chosen method (ATR or percentage). The stop loss and take profit lines will appear on the chart, showing where the strategy will exit the trade. If the price reaches either the SL or TP, the trade is closed, and the respective line is deleted from the chart.
Performance Metrics: The strategy’s performance is tracked in real-time with an in-chart table. This table provides essential information about the number of trades executed, the win/loss ratio, and the overall win rate. This information helps traders assess the strategy's effectiveness and make necessary adjustments.
This strategy is designed for those who seek to engage with trending markets, offering robust tools for entry, exit, and overall trade management. By understanding and leveraging these features, traders can potentially improve their trading outcomes and risk management.
🔷 Related Script
🔶 Disclaimer
Use with Caution: This indicator is provided for educational and informational purposes only and should not be considered as financial advice. Users should exercise caution and perform their own analysis before making trading decisions based on the indicator's signals.
Not Financial Advice: The information provided by this indicator does not constitute financial advice, and the creator (UAlgo) shall not be held responsible for any trading losses incurred as a result of using this indicator.
Backtesting Recommended: Traders are encouraged to backtest the indicator thoroughly on historical data before using it in live trading to assess its performance and suitability for their trading strategies.
Risk Management: Trading involves inherent risks, and users should implement proper risk management strategies, including but not limited to stop-loss orders and position sizing, to mitigate potential losses.
No Guarantees: The accuracy and reliability of the indicator's signals cannot be guaranteed, as they are based on historical price data and past performance may not be indicative of future results.

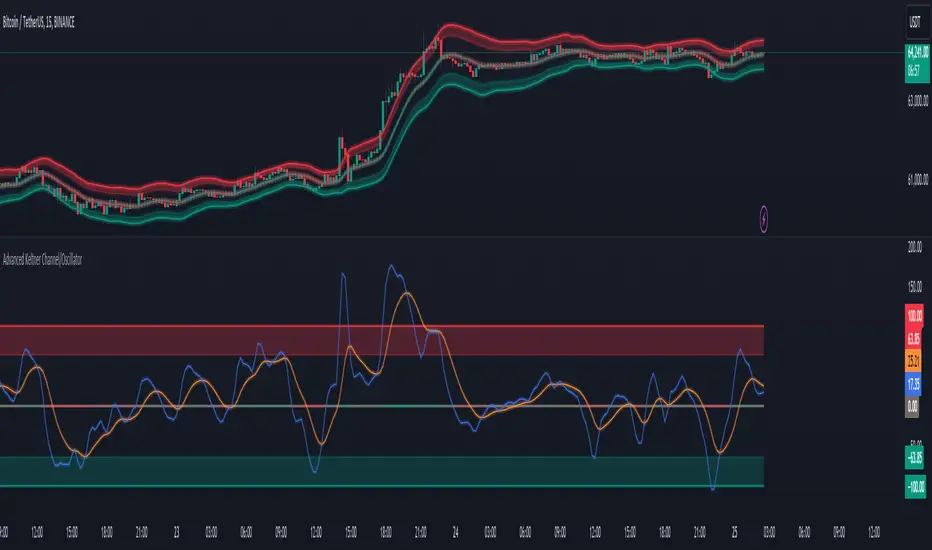
Advanced Keltner Channel/Oscillator [MyTradingCoder]This indicator combines a traditional Keltner Channel overlay with an oscillator, providing a comprehensive view of price action, trend, and momentum. The core of this indicator is its advanced ATR calculation, which uses statistical methods to provide a more robust measure of volatility.
Starting with the overlay component, the center line is created using a biquad low-pass filter applied to the chosen price source. This provides a smoother representation of price than a simple moving average. The upper and lower channel lines are then calculated using the statistically derived ATR, with an additional set of mid-lines between the center and outer lines. This creates a more nuanced view of price action within the channel.
The color coding of the center line provides an immediate visual cue of the current price momentum. As the price moves up relative to the ATR, the line shifts towards the bullish color, and vice versa for downward moves. This color gradient allows for quick assessment of the current market sentiment.
The oscillator component transforms the channel into a different perspective. It takes the price's position within the channel and maps it to either a normalized -100 to +100 scale or displays it in price units, depending on your settings. This oscillator essentially shows where the current price is in relation to the channel boundaries.
The oscillator includes two key lines: the main oscillator line and a signal line. The main line represents the current position within the channel, smoothed by an exponential moving average (EMA). The signal line is a further smoothed version of the oscillator line. The interaction between these two lines can provide trading signals, similar to how MACD is often used.
When the oscillator line crosses above the signal line, it might indicate bullish momentum, especially if this occurs in the lower half of the oscillator range. Conversely, the oscillator line crossing below the signal line could signal bearish momentum, particularly if it happens in the upper half of the range.
The oscillator's position relative to its own range is also informative. Values near the top of the range (close to 100 if normalized) suggest that price is near the upper Keltner Channel band, indicating potential overbought conditions. Values near the bottom of the range (close to -100 if normalized) suggest proximity to the lower band, potentially indicating oversold conditions.
One of the strengths of this indicator is how the overlay and oscillator work together. For example, if the price is touching the upper band on the overlay, you'd see the oscillator at or near its maximum value. This confluence of signals can provide stronger evidence of overbought conditions. Similarly, the oscillator hitting extremes can draw your attention to price action at the channel boundaries on the overlay.
The mid-lines on both the overlay and oscillator provide additional nuance. On the overlay, price action between the mid-line and outer line might suggest strong but not extreme momentum. On the oscillator, this would correspond to readings in the outer quartiles of the range.
The customizable visual settings allow you to adjust the indicator to your preferences. The glow effects and color coding can make it easier to quickly interpret the current market conditions at a glance.
Overlay Component:
The overlay displays Keltner Channel bands dynamically adapting to market conditions, providing clear visual cues for potential trend reversals, breakouts, and overbought/oversold zones.
The center line is a biquad low-pass filter applied to the chosen price source.
Upper and lower channel lines are calculated using a statistically derived ATR.
Includes mid-lines between the center and outer channel lines.
Color-coded based on price movement relative to the ATR.
Oscillator Component:
The oscillator component complements the overlay, highlighting momentum and potential turning points.
Normalized values make it easy to compare across different assets and timeframes.
Signal line crossovers generate potential buy/sell signals.
Advanced ATR Calculation:
Uses a unique method to compute ATR, incorporating concepts like root mean square (RMS) and z-score clamping.
Provides both an average and mode-based ATR value.
Customizable Visual Settings:
Adjustable colors for bullish and bearish moves, oscillator lines, and channel components.
Options for line width, transparency, and glow effects.
Ability to display overlay, oscillator, or both simultaneously.
Flexible Parameters:
Customizable inputs for channel width multiplier, ATR period, smoothing factors, and oscillator settings.
Adjustable Q factor for the biquad filter.
Key Advantages:
Advanced ATR Calculation: Utilizes a statistical method to generate ATR, ensuring greater responsiveness and accuracy in volatile markets.
Overlay and Oscillator: Provides a comprehensive view of price action, combining trend and momentum analysis.
Customizable: Adjust settings to fine-tune the indicator to your specific needs and trading style.
Visually Appealing: Clear and concise design for easy interpretation.
The ATR (Average True Range) in this indicator is derived using a sophisticated statistical method that differs from the traditional ATR calculation. It begins by calculating the True Range (TR) as the difference between the high and low of each bar. Instead of a simple moving average, it computes the Root Mean Square (RMS) of the TR over the specified period, giving more weight to larger price movements. The indicator then calculates a Z-score by dividing the TR by the RMS, which standardizes the TR relative to recent volatility. This Z-score is clamped to a maximum value (10 in this case) to prevent extreme outliers from skewing the results, and then rounded to a specified number of decimal places (2 in this script).
These rounded Z-scores are collected in an array, keeping track of how many times each value occurs. From this array, two key values are derived: the mode, which is the most frequently occurring Z-score, and the average, which is the weighted average of all Z-scores. These values are then scaled back to price units by multiplying by the RMS.
Now, let's examine how these values are used in the indicator. For the Keltner Channel lines, the mid lines (top and bottom) use the mode of the ATR, representing the most common volatility state. The max lines (top and bottom) use the average of the ATR, incorporating all volatility states, including less common but larger moves. By using the mode for the mid lines and the average for the max lines, the indicator provides a nuanced view of volatility. The mid lines represent the "typical" market state, while the max lines account for less frequent but significant price movements.
For the color coding of the center line, the mode of the ATR is used to normalize the price movement. The script calculates the difference between the current price and the price 'degree' bars ago (default is 2), and then divides this difference by the mode of the ATR. The resulting value is passed through an arctangent function and scaled to a 0-1 range. This scaled value is used to create a color gradient between the bearish and bullish colors.
Using the mode of the ATR for this color coding ensures that the color changes are based on the most typical volatility state of the market. This means that the color will change more quickly in low volatility environments and more slowly in high volatility environments, providing a consistent visual representation of price momentum relative to current market conditions.
Using a good IIR (Infinite Impulse Response) low-pass filter, such as the biquad filter implemented in this indicator, offers significant advantages over simpler moving averages like the EMA (Exponential Moving Average) or other basic moving averages.
At its core, an EMA is indeed a simple, single-pole IIR filter, but it has limitations in terms of its frequency response and phase delay characteristics. The biquad filter, on the other hand, is a two-pole, two-zero filter that provides superior control over the frequency response curve. This allows for a much sharper cutoff between the passband and stopband, meaning it can more effectively separate the signal (in this case, the underlying price trend) from the noise (short-term price fluctuations).
The improved frequency response of a well-designed biquad filter means it can achieve a better balance between smoothness and responsiveness. While an EMA might need a longer period to sufficiently smooth out price noise, potentially leading to more lag, a biquad filter can achieve similar or better smoothing with less lag. This is crucial in financial markets where timely information is vital for making trading decisions.
Moreover, the biquad filter allows for independent control of the cutoff frequency and the Q factor. The Q factor, in particular, is a powerful parameter that affects the filter's resonance at the cutoff frequency. By adjusting the Q factor, users can fine-tune the filter's behavior to suit different market conditions or trading styles. This level of control is simply not available with basic moving averages.
Another advantage of the biquad filter is its superior phase response. In the context of financial data, this translates to more consistent lag across different frequency components of the price action. This can lead to more reliable signals, especially when it comes to identifying trend changes or price reversals.
The computational efficiency of biquad filters is also worth noting. Despite their more complex mathematical foundation, biquad filters can be implemented very efficiently, often requiring only a few operations per sample. This makes them suitable for real-time applications and high-frequency trading scenarios.
Furthermore, the use of a more sophisticated filter like the biquad can help in reducing false signals. The improved noise rejection capabilities mean that minor price fluctuations are less likely to cause unnecessary crossovers or indicator movements, potentially leading to fewer false breakouts or reversal signals.
In the specific context of a Keltner Channel, using a biquad filter for the center line can provide a more stable and reliable basis for the entire indicator. It can help in better defining the overall trend, which is crucial since the Keltner Channel is often used for trend-following strategies. The smoother, yet more responsive center line can lead to more accurate channel boundaries, potentially improving the reliability of overbought/oversold signals and breakout indications.
In conclusion, this advanced Keltner Channel indicator represents a significant evolution in technical analysis tools, combining the power of traditional Keltner Channels with modern statistical methods and signal processing techniques. By integrating a sophisticated ATR calculation, a biquad low-pass filter, and a complementary oscillator component, this indicator offers traders a comprehensive and nuanced view of market dynamics.
The indicator's strength lies in its ability to adapt to varying market conditions, providing clear visual cues for trend identification, momentum assessment, and potential reversal points. The use of statistically derived ATR values for channel construction and the implementation of a biquad filter for the center line result in a more responsive and accurate representation of price action compared to traditional methods.
Furthermore, the dual nature of this indicator – functioning as both an overlay and an oscillator – allows traders to simultaneously analyze price trends and momentum from different perspectives. This multifaceted approach can lead to more informed decision-making and potentially more reliable trading signals.
The high degree of customization available in the indicator's settings enables traders to fine-tune its performance to suit their specific trading styles and market preferences. From adjustable visual elements to flexible parameter inputs, users can optimize the indicator for various trading scenarios and time frames.
Ultimately, while no indicator can predict market movements with certainty, this advanced Keltner Channel provides traders with a powerful tool for market analysis. By offering a more sophisticated approach to measuring volatility, trend, and momentum, it equips traders with valuable insights to navigate the complex world of financial markets. As with any trading tool, it should be used in conjunction with other forms of analysis and within a well-defined risk management framework to maximize its potential benefits.
Uptrick: MultiTrend Squeeze System**Uptrick: MultiTrend Squeeze System Indicator: The Ultimate Trading Tool for Precision and Versatility 📈🔥**
### Introduction
The MultiTrend Squeeze System is a powerful, multi-faceted trading indicator designed to provide traders with precise buy and sell signals by combining the strengths of multiple technical analysis tools. This script isn't just an indicator; it's a comprehensive trading system that merges the power of SuperTrend, RSI, Volume Filtering, and Squeeze Momentum to give you an unparalleled edge in the market. Whether you're a day trader looking for short-term opportunities or a swing trader aiming to catch longer-term trends, this indicator is tailored to meet your needs.
### Key Features and Unique Aspects
1. **SuperTrend with Dynamic Adjustments 📊**
- **Adaptive SuperTrend Calculation:** The SuperTrend is a popular trend-following indicator that adjusts dynamically based on market conditions. It uses the Average True Range (ATR) to calculate upper and lower bands, which shift according to market volatility. This script takes it further by combining it with the RSI and Volume filtering to provide more accurate signals.
- **Direction Sensitivity:** The SuperTrend here is not static. It adjusts based on the direction of the previous SuperTrend value, ensuring that the indicator remains relevant even in choppy markets.
2. **RSI Integration for Overbought/Oversold Conditions 💹**
- **RSI Calculation:** The Relative Strength Index (RSI) is incorporated to identify overbought and oversold conditions, adding an extra layer of precision. This helps in filtering out false signals and ensuring that trades are taken only in optimal conditions.
- **Customizable RSI Settings:** The RSI settings are fully customizable, allowing traders to adjust the RSI length and the overbought/oversold levels according to their trading style and market.
3. **Volume Filtering for Enhanced Signal Confirmation 📉**
- **Volume Multiplier:** This unique feature integrates volume analysis, ensuring that signals are only generated when there is sufficient market participation. The Volume Multiplier can be adjusted to filter out weak signals that occur during low-volume periods.
- **Optional Volume Filtering:** Traders have the flexibility to turn the volume filter on or off, depending on their preference or market conditions. This makes the indicator versatile, allowing it to be used across different asset classes and market conditions.
4. **Squeeze Momentum Indicator (SMI) for Market Pressure Analysis 💥**
- **Squeeze Detection:** The Squeeze Momentum Indicator detects periods of market compression and expansion. This script goes beyond the traditional Bollinger Bands and Keltner Channels by incorporating true range calculations, offering a more nuanced view of market momentum.
- **Customizable Squeeze Settings:** The lengths and multipliers for both Bollinger Bands and Keltner Channels are customizable, giving traders the flexibility to fine-tune the indicator based on their specific needs.
5. **Visual and Aesthetic Customization 🎨**
- **Color-Coding for Clarity:** The indicator is color-coded to make it easy to interpret signals. Bullish trends are marked with a vibrant green color, while bearish trends are highlighted in red. Neutral or unconfirmed signals are displayed in softer tones to reduce noise.
- **Histogram Visualization:** The primary trend direction and strength are displayed as a histogram, making it easy to visualize the market's momentum at a glance. The height and color of the bars provide immediate feedback on the strength and direction of the trend.
6. **Alerts for Real-Time Trading 🚨**
- **Custom Alerts:** The script is equipped with custom alerts that notify traders when a buy or sell signal is generated. These alerts can be configured to send notifications through various channels, including email, SMS, or directly to the trading platform.
- **Immediate Reaction:** The alerts are triggered based on the confluence of SuperTrend, RSI, and Volume signals, ensuring that traders are notified only when the most robust trading opportunities arise.
7. **Comprehensive Input Customization ⚙️**
- **SuperTrend Settings:** Adjust the ATR length and factor to control the sensitivity of the SuperTrend. This allows you to adapt the indicator to different market conditions, whether you're trading a volatile cryptocurrency or a more stable stock.
- **RSI Settings:** Customize the RSI length and thresholds for overbought and oversold conditions, enabling you to tailor the indicator to your specific trading strategy.
- **Volume Settings:** The Volume Multiplier and the option to toggle the volume filter provide an additional layer of customization, allowing you to fine-tune the indicator based on market liquidity and participation.
- **Squeeze Momentum Settings:** The lengths and multipliers for Bollinger Bands and Keltner Channels can be adjusted to detect different levels of market compression, providing flexibility for both short-term and long-term traders.
### How It Works: A Deep Dive Into the Mechanics 🛠️
1. **SuperTrend Calculation:**
- The SuperTrend is calculated using the ATR, which measures market volatility. The indicator creates upper and lower bands around the price, adjusting these bands based on the current level of market volatility. The direction of the trend is determined by the position of the price relative to these bands.
- The script enhances the standard SuperTrend by ensuring that the bands do not flip-flop too quickly, reducing the chances of false signals in a choppy market. The direction is confirmed by checking the position of the close relative to the previous band, making the trend detection more reliable.
2. **RSI Integration:**
- The RSI is calculated over a customizable length and compared to user-defined overbought and oversold levels. When the RSI crosses below the oversold level, and the SuperTrend indicates a bullish trend, a buy signal is generated. Conversely, when the RSI crosses above the overbought level, and the SuperTrend indicates a bearish trend, a sell signal is triggered.
- The combination of RSI with SuperTrend ensures that trades are only taken when there is a strong confluence of signals, reducing the chances of entering trades during weak or indecisive market phases.
3. **Volume Filtering:**
- The script calculates the average volume over a 20-period simple moving average. The volume filter ensures that buy and sell signals are only valid when the current volume exceeds a multiple of this average, which can be adjusted by the user. This feature helps filter out weak signals that might occur during low-volume periods, such as just before a major news event or during after-hours trading.
- The volume filter is particularly useful in markets where volume spikes are common, as it ensures that signals are only generated when there is significant market interest in the direction of the trend.
4. **Squeeze Momentum:**
- The Squeeze Momentum Indicator (SMI) adds a layer of market pressure analysis. The script calculates Bollinger Bands and Keltner Channels, detecting when the market is in a "squeeze" — a period of low volatility that typically precedes a significant price move.
- When the Bollinger Bands are inside the Keltner Channels, the market is in a squeeze (compression phase). This is often a precursor to a breakout or breakdown. The script colors the histogram bars black during this phase, indicating a potential for a strong move. Once the squeeze is released, the bars are colored according to the direction of the SuperTrend, signaling a potential entry point.
5. **Integration and Signal Generation:**
- The script brings together the SuperTrend, RSI, Volume, and Squeeze Momentum to generate highly accurate buy and sell signals. A buy signal is triggered when the SuperTrend is bullish, the RSI indicates oversold conditions, and the volume filter confirms strong market participation. Similarly, a sell signal is generated when the SuperTrend is bearish, the RSI indicates overbought conditions, and the volume filter is met.
- The combination of these elements ensures that the signals are robust, reducing the likelihood of entering trades during weak or indecisive market conditions.
### Practical Applications: How to Use the MultiTrend Squeeze System 📅
1. **Day Trading:**
- For day traders, this indicator provides quick and reliable signals that can be used to enter and exit trades multiple times within a day. The volume filter ensures that you are trading during the most liquid times of the day, increasing the chances of successful trades. The Squeeze Momentum aspect helps you catch breakouts or breakdowns, which are common in intraday trading.
2. **Swing Trading:**
- Swing traders can use the MultiTrend Squeeze System to identify longer-term trends. By adjusting the ATR length and factor, you can make the SuperTrend more sensitive to catch longer-term moves. The RSI and Squeeze Momentum aspects help you time your entries and exits, ensuring that you get in early on a trend and exit before it reverses.
3. **Scalping:**
- For scalpers, the quick signals provided by this system, especially in combination with the volume filter, make it easier to take small profits repeatedly. The histogram bars give you a clear visual cue of the market's momentum, making it easier to scalp effectively.
4. **Position Trading:**
- Even position traders can benefit from this indicator by using it to confirm long-term trends. By adjusting the settings to less sensitive parameters, you can ensure that you are only entering trades when a strong trend is confirmed. The Squeeze Momentum indicator will help you stay in the trade during periods of consolidation, waiting for the next big move.
### Conclusion: Why the MultiTrend Squeeze System is a Game-Changer 🚀
The MultiTrend Squeeze System is not just another trading indicator; it’s a comprehensive trading strategy encapsulated within a single script. By combining the power
of SuperTrend, RSI, Volume Filtering, and Squeeze Momentum, this indicator provides a robust and versatile tool that can be adapted to various trading styles and market conditions.
**Why is it Unique?**
- **Multi-Dimensional Analysis:** Unlike many other indicators that rely on a single data point or calculation, this script incorporates multiple layers of analysis, ensuring that signals are based on a confluence of factors, which increases their reliability.
- **Customizability:** The vast range of input settings allows traders to tailor the indicator to their specific needs, whether they are trading forex, stocks, cryptocurrencies, or commodities.
- **Visual Clarity:** The color-coded bars, labels, and signals make it easy to interpret the market conditions at a glance, reducing the time needed to make trading decisions.
Whether you are a novice trader or an experienced market participant, the MultiTrend Squeeze System offers a powerful toolset to enhance your trading strategy, reduce risk, and maximize your potential returns. With its combination of trend analysis, momentum detection, and volume filtering, this indicator is designed to help you trade with confidence and precision in any market condition.

Wedge Pop & Drop [QuantVue]A "Wedge Pop" is a trading pattern popularized by Oliver Kell, a notable trader who won the 2020 US Investing Championship with a remarkable return of 941%. This pattern, often referred to as "The Money Pattern" in his trading strategy, serves as a critical signal indicating the beginning of a new uptrend in a stock.
A Wedge Pop occurs when a stock first trades up through the moving averages after reaching a downside extension. Conversely, a Wedge Drop refers to the first time a stock trades down through the moving averages after reaching an upside extension.
How the Indicator Works:
The indicator uses the Average True Range (ATR) and the 10-period Exponential Moving Average (10 EMA) to identify upside and downside extensions. An upside extension occurs when the low of the current bar is greater than 1.5 (default) times the ATR above the moving average. A downside extension occurs when the high of the current bar is less than 1.5 times the ATR below the moving average.
Once an extension has been reached, the first time the security trades back through the moving averages, it triggers a Wedge Pop/Drop.
Give this indicator a BOOST and COMMENT your thoughts below!
We hope you enjoy.
Cheers!

Fibonacci-Only StrategyFibonacci-Only Strategy
This script is a custom trading strategy designed for traders who leverage Fibonacci retracement levels to identify potential trade entries and exits. The strategy is versatile, allowing users to trade across multiple timeframes, with built-in options for dynamic stop loss, trailing stops, and take profit levels.
Key Features:
Custom Fibonacci Levels:
This strategy calculates three specific Fibonacci retracement levels: 19%, 82.56%, and the reverse 19% level. These levels are used to identify potential areas of support and resistance where price reversals or breaks might occur.
The Fibonacci levels are calculated based on the highest and lowest prices within a 100-bar period, making them dynamic and responsive to recent market conditions.
Dynamic Entry Conditions:
Touch Entry: The script enters long or short positions when the price touches specific Fibonacci levels and confirms the move with a bullish (for long) or bearish (for short) candle.
Break Entry (Optional): If the "Use Break Strategy" option is enabled, the script can also enter positions when the price breaks through Fibonacci levels, providing more aggressive entry opportunities.
Stop Loss Management:
The script offers flexible stop loss settings. Users can choose between a fixed percentage stop loss or an ATR-based stop loss, which adjusts based on market volatility.
The ATR (Average True Range) stop loss is multiplied by a user-defined factor, allowing for tailored risk management based on market conditions.
Trailing Stop Mechanism:
The script includes an optional trailing stop feature, which adjusts the stop loss level as the market moves in favor of the trade. This helps lock in profits while allowing the trade to run if the trend continues.
The trailing stop is calculated as a percentage of the difference between the entry price and the current market price.
Multiple Take Profit Levels:
The strategy calculates seven take profit levels, each at incremental percentages above (for long trades) or below (for short trades) the entry price. This allows for gradual profit-taking as the market moves in the trade's favor.
Each take profit level can be customized in terms of the percentage of the position to be closed, providing precise control over exit strategies.
Strategy Backtesting and Results:
Realistic Backtesting:
The script has been backtested with realistic account sizes, commission rates, and slippage settings to ensure that the results are applicable to actual trading scenarios.
The backtesting covers various timeframes and markets to ensure the strategy's robustness across different trading environments.
Default Settings:
The script is published with default settings that have been optimized for general use. These settings include a 15-minute timeframe, a 1.0% stop loss, a 2.0 ATR multiplier for stop loss, and a 1.5% trailing stop.
Users can adjust these settings to better fit their specific trading style or the market they are trading.
How It Works:
Long Entry Conditions:
The strategy enters a long position when the price touches the 19% Fibonacci level (from high to low) or the reverse 19% level (from low to high) and confirms the move with a bullish candle.
If the "Use Break Strategy" option is enabled, the script will also enter a long position when the price breaks below the 19% Fibonacci level and then moves back up, confirming the break with a bullish candle.
Short Entry Conditions:
The strategy enters a short position when the price touches the 82.56% Fibonacci level and confirms the move with a bearish candle.
If the "Use Break Strategy" option is enabled, the script will also enter a short position when the price breaks above the 82.56% Fibonacci level and then moves back down, confirming the break with a bearish candle.
Stop Loss and Take Profit Logic:
The stop loss for each trade is calculated based on the selected method (fixed percentage or ATR-based). The strategy then manages the trade by either trailing the stop or taking profit at predefined levels.
The take profit levels are set at increments of 0.5% above or below the entry price, depending on whether the position is long or short. The script gradually exits the trade as these levels are hit, securing profits while minimizing risk.
Usage:
For Fibonacci Traders:
This script is ideal for traders who rely on Fibonacci retracement levels to find potential trade entries and exits. The script automates the process, allowing traders to focus on market analysis and decision-making.
For Trend and Swing Traders:
The strategy's flexibility in handling both touch and break entries makes it suitable for trend-following and swing trading strategies. The multiple take profit levels allow traders to capture profits in trending markets while managing risk.
Important Notes:
Originality: This script uniquely combines Fibonacci retracement levels with dynamic stop loss management and multiple take profit levels. It is not just a combination of existing indicators but a thoughtful integration designed to enhance trading performance.
Disclaimer: Trading involves risk, and it is crucial to test this script in a demo account or through backtesting before applying it to live trading. Users should ensure that the settings align with their individual risk tolerance and trading strategy.

MACD Trail | Flux Charts💎 GENERAL OVERVIEW
Introducing our new MACD Trail indicator! Moving average convergence/divergence (MACD) is a well-known indicator among traders. It's a trend-following indicator that uses the relationship between two exponential moving averages (EMAs). This indicator aims to use MACD to generate a trail that follows the current price of the ticker, which can act as a support / resistance zone. More info about the process in the "How Does It Work" section.
Features of the new MACD Trail Indicator :
A Trail Generated Using MACD Calculation
Customizable Algorithm
Customizable Styling
📌 HOW DOES IT WORK ?
First of all, this indicator calculates the current MACD of the ticker using the user's input as settings. Let X = MACD Length setting ;
MACD ~= X Period EMA - (X * 2) Period EMA
Then, two MACD Trails are generated, one being bullish and other being bearish. Let ATR = 30 period ATR (Average True Range)
Bullish MACD Trail = Current Price + MACD - (ATR * 1.75)
Bearish MACD Trail = Current Price + MACD + (ATR * 1.75)
The indicator starts by rendering only the Bullish MACD Trail. Then if it's invalidated (candlestick closes below the trail) it switches to Bearish MACD Trail. The MACD trail switches between bullish & bearish as they get invalidated.
The trail type may give a hint about the current trend of the price action. The trail itself also can act as a support / resistance zone, here is an example :
🚩 UNIQUENESS
While MACD is one of the most used indicators among traders, this indicator aims to add another functionality to it by rendering a trail based on it. This trail may act as a support / resistance zone as described above, and gives a glimpse about the current trend. The indicator also has custom MACD Length and smoothing options, as well as various style options.
⚙️ SETTINGS
1. General Configuration
MACD Length -> This setting adjusts the EMA periods used in MACD calculation. Increasing this setting will make MACD more responseive to longer trends, while decreasing it may help with detection of shorter trends.
Smoothing -> The smoothing of the MACD Trail. Increasing this setting will help smoothen out the MACD Trail line, but it can also make it less responsive to the latest changes.

Double CCI Confirmed Hull Moving Average Reversal StrategyOverview
The Double CCI Confirmed Hull Moving Average Strategy utilizes hull moving average (HMA) in conjunction with two commodity channel index (CCI) indicators: the slow and fast to increase the probability of entering when the short and mid-term uptrend confirmed. The main idea is to wait until the price breaks the HMA while both CCI are showing that the uptrend has likely been already started. Moreover, strategy uses exponential moving average (EMA) to trail the price when it reaches the specific level. The strategy opens only long trades.
Unique Features
Dynamic stop-loss system: Instead of fixed stop-loss level strategy utilizes average true range (ATR) multiplied by user given number subtracted from the position entry price as a dynamic stop loss level.
Configurable Trading Periods: Users can tailor the strategy to specific market windows, adapting to different market conditions.
Double trade setup confirmation: Strategy utilizes two different period CCI indicators to confirm the breakouts of HMA.
Trailing take profit level: After reaching the trailing profit activation level scrip activate the trailing of long trade using EMA. More information in methodology.
Methodology
The strategy opens long trade when the following price met the conditions:
Short-term period CCI indicator shall be above 0.
Long-term period CCI indicator shall be above 0.
Price shall cross the HMA and candle close above it with the same candle
When long trade is executed, strategy set the stop-loss level at the price ATR multiplied by user-given value below the entry price. This level is recalculated on every next candle close, adjusting to the current market volatility.
At the same time strategy set up the trailing stop validation level. When the price crosses the level equals entry price plus ATR multiplied by user-given value script starts to trail the price with EMA. If price closes below EMA long trade is closed. When the trailing starts, script prints the label “Trailing Activated”.
Strategy settings
In the inputs window user can setup the following strategy settings:
ATR Stop Loss (by default = 1.75)
ATR Trailing Profit Activation Level (by default = 2.25)
CCI Fast Length (by default = 25, used for calculation short term period CCI
CCI Slow Length (by default = 50, used for calculation long term period CCI)
Hull MA Length (by default = 34, period of HMA, which shall be broken to open trade)
Trailing EMA Length (by default = 20)
User can choose the optimal parameters during backtesting on certain price chart.
Justification of Methodology
Before understanding why this particular combination of indicator has been chosen let's briefly explain what is CCI and HMA.
The Commodity Channel Index (CCI) is a momentum-based technical indicator used in trading to measure a security's price relative to its average price over a given period. Developed by Donald Lambert in 1980, the CCI is primarily used to identify cyclical trends in a security, helping traders to spot potential buying or selling opportunities.
The CCI formula is:
CCI = (Typical Price − SMA) / (0.015 × Mean Deviation)
Typical Price (TP): This is calculated as the average of the high, low, and closing prices for the period.
Simple Moving Average (SMA): This is the average of the Typical Prices over a specific number of periods.
Mean Deviation: This is the average of the absolute differences between the Typical Price and the SMA.
The result is a value that typically fluctuates between +100 and -100, though it is not bounded and can go higher or lower depending on the price movement.
The Hull Moving Average (HMA) is a type of moving average that was developed by Alan Hull to improve upon the traditional moving averages by reducing lag while maintaining smoothness. The goal of the HMA is to create an indicator that is both quick to respond to price changes and less prone to whipsaws (false signals).
How the Hull Moving Average is Calculated?
The Hull Moving Average is calculated using the following steps:
Weighted Moving Average (WMA): The HMA starts by calculating the Weighted Moving Average (WMA) of the price data over a period square root of n (sqrt(n))
Speed Adjustment: A WMA is then calculated for half of the period n/2, and this is multiplied by 2 to give more weight to recent prices.
Lag Reduction: The WMA of the full period n is subtracted from the doubled n/2 WMA.
Final Smoothing: To smooth the result and reduce noise, a WMA is calculated for the square root of the period n.
The formula can be represented as:
HMA(n) = WMA(WMA(n/2) × 2 − WMA(n), sqrt(n))
The Weighted Moving Average (WMA) is a type of moving average that gives more weight to recent data points, making it more responsive to recent price changes than a Simple Moving Average (SMA). In a WMA, each data point within the selected period is multiplied by a weight, with the most recent data receiving the highest weight. The sum of these weighted values is then divided by the sum of the weights to produce the WMA.
This strategy leverages HMA of user given period as a critical level which shall be broken to say that probability of trend change to the upside increased. HMA reacts faster than EMA or SMA to the price change, that’s why it increases chances to enter new trade earlier. Long-term period CCI helps to have an approximation of mid-term trend. If it’s above 0 the probability of uptrend increases. Short-period CCI allows to have an approximation of short-term trend reversal from down to uptrend. This approach increases chances to have a long trade setup in the direction of mid-term trend when the short-term trend starts to reverse.
ATR is used to adjust the strategy risk management to the current market volatility. If volatility is low, we don’t need the large stop loss to understand the there is a high probability that we made a mistake opening the trade. User can setup the settings ATR Stop Loss and ATR Trailing Profit Activation Level to realize his own risk to reward preferences, but the unique feature of a strategy is that after reaching trailing profit activation level strategy is trying to follow the trend until it is likely to be finished instead of using fixed risk management settings. It allows sometimes to be involved in the large movements. It’s also important to make a note, that script uses HMA to enter the trade, but for trailing it leverages EMA. It’s used because EMA has no such fast reaction to price move which increases probability not to be stopped out from any significant uptrend move.
Backtest Results
Operating window: Date range of backtests is 2022.07.01 - 2024.08.01. It is chosen to let the strategy to close all opened positions.
Commission and Slippage: Includes a standard Binance commission of 0.1% and accounts for possible slippage over 5 ticks.
Initial capital: 10000 USDT
Percent of capital used in every trade: 100%
Maximum Single Position Loss: -4.67%
Maximum Single Profit: +19.66%
Net Profit: +14897.94 USDT (+148.98%)
Total Trades: 104 (36.54% win rate)
Profit Factor: 2.312
Maximum Accumulated Loss: 1302.66 USDT (-9.58%)
Average Profit per Trade: 143.25 USDT (+0.96%)
Average Trade Duration: 34 hours
These results are obtained with realistic parameters representing trading conditions observed at major exchanges such as Binance and with realistic trading portfolio usage parameters.
How to Use
Add the script to favorites for easy access.
Apply to the desired timeframe and chart (optimal performance observed on 2h BTC/USDT).
Configure settings using the dropdown choice list in the built-in menu.
Set up alerts to automate strategy positions through web hook with the text: {{strategy.order.alert_message}}
Disclaimer:
Educational and informational tool reflecting Skyrex commitment to informed trading. Past performance does not guarantee future results. Test strategies in a simulated environment before live implementation

Trend Strength | Flux Charts💎 GENERAL OVERVIEW
Introducing the new Trend Strength indicator! Latest trends and their strengths play an important role for traders. This indicator aims to make trend and strength detection much easier by coloring candlesticks based on the current strength of trend. More info about the process in the "How Does It Work" section.
Features of the new Trend Strength Indicator :
3 Trend Detection Algorithms Combined (RSI, Supertrend & EMA Cross)
Fully Customizable Algorithm
Strength Labels
Customizable Colors For Bullish, Neutral & Bearish Trends
📌 HOW DOES IT WORK ?
This indicator uses three different methods of trend detection and combines them all into one value. First, the RSI is calculated. The RSI outputs a value between 0 & 100, which this indicator maps into -100 <-> 100. Let this value be named RSI. Then, the Supertrend is calculated. Let SPR be -1 if the calculated Supertrend is bearish, and 1 if it's bullish. After that, latest EMA Cross is calculated. This is done by checking the distance between the two EMA's adjusted by the user. Let EMADiff = EMA1 - EMA2. Then EMADiff is mapped from -ATR * 2 <-> ATR * 2 to -100 <-> 100.
Then a Total Strength (TS) is calculated by given formula : RSI * 0.5 + SPR * 0.2 + EMADiff * 0.3
The TS value is between -100 <-> 100, -100 being fully bearish, 0 being true neutral and 100 being fully bullish.
Then the Total Strength is converted into a color adjusted by the user. The candlesticks in the chart will be presented with the calculated color.
If the Labels setting is enabled, each time the trend changes direction a label will appear indicating the new direction. The latest candlestick will always show the current trend with a label.
EMA = Exponential Moving Average
RSI = Relative Strength Index
ATR = Average True Range
🚩 UNIQUENESS
The main point that differentiates this indicator from others is it's simplicity and customization options. The indicator interprets trend and strength detection in it's own way, combining 3 different well-known trend detection methods: RSI, Supertrend & EMA Cross into one simple method. The algorithm is fully customizable and all styling options are adjustable for the user's liking.
⚙️ SETTINGS
1. General Configuration
Detection Length -> This setting determines the amount of candlesticks the indicator will look for trend detection. Higher settings may help the indicator find longer trends, while lower settings will help with finding smaller trends.
Smoothing -> Higher settings will result in longer periods of time required for trend to change direction from bullish to bearish and vice versa.
EMA Lengths -> You can enter two EMA Lengths here, the second one must be longer than the first one. When the shorter one crosses under the longer one, this will be a bearish sign, and if it crosses above it will be a bullish sign for the indicator.
Labels -> Enables / Disables trend strength labels.

Bollinger Bands Enhanced StrategyOverview
The common practice of using Bollinger bands is to use it for building mean reversion or squeeze momentum strategies. In the current script Bollinger Bands Enhanced Strategy we are trying to combine the strengths of both strategies types. It utilizes Bollinger Bands indicator to buy the local dip and activates trailing profit system after reaching the user given number of Average True Ranges (ATR). Also it uses 200 period EMA to filter trades only in the direction of a trend. Strategy can execute only long trades.
Unique Features
Trailing Profit System: Strategy uses user given number of ATR to activate trailing take profit. If price has already reached the trailing profit activation level, scrip will close long trade if price closes below Bollinger Bands middle line.
Configurable Trading Periods: Users can tailor the strategy to specific market windows, adapting to different market conditions.
Major Trend Filter: Strategy utilizes 100 period EMA to take trades only in the direction of a trend.
Flexible Risk Management: Users can choose number of ATR as a stop loss (by default = 1.75) for trades. This is flexible approach because ATR is recalculated on every candle, therefore stop-loss readjusted to the current volatility.
Methodology
First of all, script checks if currently price is above the 200-period exponential moving average EMA. EMA is used to establish the current trend. Script will take long trades on if this filtering system showing us the uptrend. Then the strategy executes the long trade if candle’s low below the lower Bollinger band. To calculate the middle Bollinger line, we use the standard 20-period simple moving average (SMA), lower band is calculated by the substruction from middle line the standard deviation multiplied by user given value (by default = 2).
When long trade executed, script places stop-loss at the price level below the entry price by user defined number of ATR (by default = 1.75). This stop-loss level recalculates at every candle while trade is open according to the current candle ATR value. Also strategy set the trailing profit activation level at the price above the position average price by user given number of ATR (by default = 2.25). It is also recalculated every candle according to ATR value. When price hit this level script plotted the triangle with the label “Strong Uptrend” and start trail the price at the middle Bollinger line. It also started to be plotted as a green line.
When price close below this trailing level script closes the long trade and search for the next trade opportunity.
Risk Management
The strategy employs a combined and flexible approach to risk management:
It allows positions to ride the trend as long as the price continues to move favorably, aiming to capture significant price movements. It features a user-defined ATR stop loss parameter to mitigate risks based on individual risk tolerance. By default, this stop-loss is set to a 1.75*ATR drop from the entry point, but it can be adjusted according to the trader's preferences.
There is no fixed take profit, but strategy allows user to define user the ATR trailing profit activation parameter. By default, this stop-loss is set to a 2.25*ATR growth from the entry point, but it can be adjusted according to the trader's preferences.
Justification of Methodology
This strategy leverages Bollinger bangs indicator to open long trades in the local dips. If price reached the lower band there is a high probability of bounce. Here is an issue: during the strong downtrend price can constantly goes down without any significant correction. That’s why we decided to use 200-period EMA as a trend filter to increase the probability of opening long trades during major uptrend only.
Usually, Bollinger Bands indicator is using for mean reversion or breakout strategies. Both of them have the disadvantages. The mean reversion buys the dip, but closes on the return to some mean value. Therefore, it usually misses the major trend moves. The breakout strategies usually have the issue with too high buy price because to have the breakout confirmation price shall break some price level. Therefore, in such strategies traders need to set the large stop-loss, which decreases potential reward to risk ratio.
In this strategy we are trying to combine the best features of both types of strategies. Script utilizes ate ATR to setup the stop-loss and trailing profit activation levels. ATR takes into account the current volatility. Therefore, when we setup stop-loss with the user-given number of ATR we increase the probability to decrease the number of false stop outs. The trailing profit concept is trying to add the beat feature from breakout strategies and increase probability to stay in trade while uptrend is developing. When price hit the trailing profit activation level, script started to trail the price with middle line if Bollinger bands indicator. Only when candle closes below the middle line script closes the long trade.
Backtest Results
Operating window: Date range of backtests is 2020.10.01 - 2024.07.01. It is chosen to let the strategy to close all opened positions.
Commission and Slippage: Includes a standard Binance commission of 0.1% and accounts for possible slippage over 5 ticks.
Initial capital: 10000 USDT
Percent of capital used in every trade: 30%
Maximum Single Position Loss: -9.78%
Maximum Single Profit: +25.62%
Net Profit: +6778.11 USDT (+67.78%)
Total Trades: 111 (48.65% win rate)
Profit Factor: 2.065
Maximum Accumulated Loss: 853.56 USDT (-6.60%)
Average Profit per Trade: 61.06 USDT (+1.62%)
Average Trade Duration: 76 hours
These results are obtained with realistic parameters representing trading conditions observed at major exchanges such as Binance and with realistic trading portfolio usage parameters.
How to Use
Add the script to favorites for easy access.
Apply to the desired timeframe and chart (optimal performance observed on 4h BTC/USDT).
Configure settings using the dropdown choice list in the built-in menu.
Set up alerts to automate strategy positions through web hook with the text: {{strategy.order.alert_message}}
Disclaimer:
Educational and informational tool reflecting Skyrex commitment to informed trading. Past performance does not guarantee future results. Test strategies in a simulated environment before live implementation

Volumetric Volatility Blocks [UAlgo]The Volumetric Volatility Blocks indicator is designed to identify significant volatility blocks based on price and volume data. It utilizes a combination of the Average True Range (ATR) and Simple Moving Average (SMA) to determine the volatility level and identify periods of heightened market activity. The indicator highlights these volatility blocks, providing traders with visual cues for potential trading opportunities. It differentiates between bullish and bearish volatility by analyzing price movement and volume, offering a nuanced view of market sentiment. This tool is particularly useful for traders looking to capitalize on periods of high volatility and momentum shifts.
🔶 Key Features
Volatility Measurement Length: Controls the period used to calculate the ATR.
Smooth Length of Volatility: Defines the period for the SMA used to smooth the ATR.
Multiplier of SMA: Sets the minimum threshold for the ATR to be considered a "high volatility" block.
Show Last X Volatility Blocks: Determines how many of the most recent volatility blocks are displayed on the chart.
Mitigation Method: Choose between "Close" or "Wick" price to filter volatility blocks based on price action. This helps avoid highlighting blocks broken by the chosen price level.
Volume Info: Displaying the volume associated with each block.
Up/Down Block Color: Sets the color for bullish and bearish volatility blocks.
🔶 Usage
The Volumetric Volatility Blocks indicator visually represents periods of high volatility with blocks on the chart. Green blocks indicate bullish volatility, while red blocks indicate bearish volatility.
Bullish Volatility Blocks: When the ATR surpasses the smoothed ATR multiplied by the set multiplier, and the price closes higher than it opened, a bullish block is formed. These blocks are generally used to identify potential buying opportunities as they indicate upward momentum.
Bearish Volatility Blocks: Conversely, bearish blocks form under the same conditions, but when the price closes lower than it opened. These blocks can signal potential selling opportunities as they highlight downward momentum.
Volume Information: Each block can display volume data, providing insight into the strength of the market movement. The percentage shown on the block indicates the relative volume contribution of that block, helping traders assess the significance of the volatility.
The volume percentages in the Volumetric Volatility Blocks indicator are calculated based on the total volume of the most recent volatility blocks. For each of the most recent volatility blocks, the percentage of the total volume is calculated by dividing the block's volume by the total volume:
🔶 Disclaimer
Use with Caution: This indicator is provided for educational and informational purposes only and should not be considered as financial advice. Users should exercise caution and perform their own analysis before making trading decisions based on the indicator's signals.
Not Financial Advice: The information provided by this indicator does not constitute financial advice, and the creator (UAlgo) shall not be held responsible for any trading losses incurred as a result of using this indicator.
Backtesting Recommended: Traders are encouraged to backtest the indicator thoroughly on historical data before using it in live trading to assess its performance and suitability for their trading strategies.
Risk Management: Trading involves inherent risks, and users should implement proper risk management strategies, including but not limited to stop-loss orders and position sizing, to mitigate potential losses.
No Guarantees: The accuracy and reliability of the indicator's signals cannot be guaranteed, as they are based on historical price data and past performance may not be indicative of future results.

Market Cycle Phases IndicatorOverview
The Market Cycle Phases Indicator is a powerful tool designed to help traders identify and visualize the different phases of market cycles. By distinguishing between Accumulation, Uptrend, Distribution, and Downtrend phases, this indicator provides a clear and color-coded representation of market conditions, aiding in better decision-making and strategy development. It is especially useful for long-term investors to observe and understand market cycles over extended periods. The phases are color-coded for easy identification: Green for Accumulation, Blue for Uptrend, Yellow for Distribution, and Red for Downtrend.
Key Features
Identifies four key market phases: Accumulation, Uptrend, Distribution, and Downtrend
Uses a combination of moving averages and volatility measures
Color-coded background for easy visualization of market phases
Adjustable parameters for moving average length, volatility length, and volatility threshold
Plots the moving average and Average True Range (ATR) for reference
Suitable for both short-term trading and long-term investing
Concepts Underlying the Calculations
The calculations behind the Market Cycle Phases Indicator are straightforward, combining the principles of moving averages and volatility measures:
Moving Average (MA): A simple moving average is used to determine the overall trend direction.
Average True Range (ATR): This measures market volatility over a specified period.
Volatility Threshold: A multiplier is applied to the ATR to distinguish between high and low volatility conditions.
How It Works
The indicator first calculates a moving average (MA) of the closing prices and the Average True Range (ATR) to measure market volatility. Based on the position of the price relative to the MA and the current volatility level, the indicator determines the current market phase:
Accumulation Phase: Price is below the MA, and volatility is low (Green background). This phase often indicates a period of consolidation and potential buying interest before an uptrend.
Uptrend Phase: Price is above the MA, and volatility is high (Blue background). This phase represents a strong upward movement in price, often driven by increased buying activity.
Distribution Phase: Price is above the MA, and volatility is low (Yellow background). This phase suggests a period of consolidation at the top of an uptrend, where selling interest may start to increase.
Downtrend Phase: Price is below the MA, and volatility is high (Red background). This phase indicates a strong downward movement in price, often driven by increased selling activity.
How Traders Can Use It
Traders can use the Market Cycle Phases Indicator to:
Identify potential entry and exit points based on market phase transitions.
Confirm trends and avoid false signals by considering both trend direction and volatility.
Develop and refine trading strategies tailored to specific market conditions.
Enhance risk management by recognizing periods of high and low volatility.
Observe long-term market cycles to make informed investment decisions.
Example Usage Instructions
Add the Market Cycle Phases Indicator to your chart.
Adjust the input parameters as needed:
Base Length: Default is 50.
Volatility Length: Default is 14.
Volatility Threshold: Default is 1.5.
Observe the color-coded background to identify the current market phase
Use the identified phases to inform your trading decisions:
Consider buying during the Accumulation or Uptrend phases.
Consider selling or shorting during the Distribution or Downtrend phases.
Combine with other indicators and analysis techniques for comprehensive market insights.
By incorporating the Market Cycle Phases Indicator into your trading toolkit, you can gain a clearer understanding of market dynamics and enhance your ability to navigate different market conditions, making it a valuable asset for long-term investing.

Multi-Regression StrategyIntroducing the "Multi-Regression Strategy" (MRS) , an advanced technical analysis tool designed to provide flexible and robust market analysis across various financial instruments.
This strategy offers users the ability to select from multiple regression techniques and risk management measures, allowing for customized analysis tailored to specific market conditions and trading styles.
Core Components:
Regression Techniques:
Users can choose one of three regression methods:
1 - Linear Regression: Provides a straightforward trend line, suitable for steady markets.
2 - Ridge Regression: Offers a more stable trend estimation in volatile markets by introducing a regularization parameter (lambda).
3 - LOESS (Locally Estimated Scatterplot Smoothing): Adapts to non-linear trends, useful for complex market behaviors.
Each regression method calculates a trend line that serves as the basis for trading decisions.
Risk Management Measures:
The strategy includes nine different volatility and trend strength measures. Users select one to define the trading bands:
1 - ATR (Average True Range)
2 - Standard Deviation
3 - Bollinger Bands Width
4 - Keltner Channel Width
5 - Chaikin Volatility
6 - Historical Volatility
7 - Ulcer Index
8 - ATRP (ATR Percentage)
9 - KAMA Efficiency Ratio
The chosen measure determines the width of the bands around the regression line, adapting to market volatility.
How It Works:
Regression Calculation:
The selected regression method (Linear, Ridge, or LOESS) calculates the main trend line.
For Ridge Regression, users can adjust the lambda parameter for regularization.
LOESS allows customization of the point span, adaptiveness, and exponent for local weighting.
Risk Band Calculation:
The chosen risk measure is calculated and normalized.
A user-defined risk multiplier is applied to adjust the sensitivity.
Upper and lower bounds are created around the regression line based on this risk measure.
Trading Signals:
Long entries are triggered when the price crosses above the regression line.
Short entries occur when the price crosses below the regression line.
Optional stop-loss and take-profit mechanisms use the calculated risk bands.
Customization and Flexibility:
Users can switch between regression methods to adapt to different market trends (linear, regularized, or non-linear).
The choice of risk measure allows adaptation to various market volatility conditions.
Adjustable parameters (e.g., regression length, risk multiplier) enable fine-tuning of the strategy.
Unique Aspects:
Comprehensive Regression Options:
Unlike many indicators that rely on a single regression method, MRS offers three distinct techniques, each suitable for different market conditions.
Diverse Risk Measures: The strategy incorporates a wide range of volatility and trend strength measures, going beyond traditional indicators to provide a more nuanced view of market dynamics.
Unified Framework:
By combining advanced regression techniques with various risk measures, MRS offers a cohesive approach to trend identification and risk management.
Adaptability:
The strategy can be easily adjusted to suit different trading styles, timeframes, and market conditions through its various input options.
How to Use:
Select a regression method based on your analysis of the current market trend (linear, need for regularization, or non-linear).
Choose a risk measure that aligns with your trading style and the market's current volatility characteristics.
Adjust the length parameter to match your preferred timeframe for analysis.
Fine-tune the risk multiplier to set the desired sensitivity of the trading bands.
Optionally enable stop-loss and take-profit mechanisms using the calculated risk bands.
Monitor the regression line for potential trend changes and the risk bands for entry/exit signals.
By offering this level of customization within a unified framework, the Multi-Regression Strategy provides traders with a powerful tool for market analysis and trading decision support. It combines the robustness of regression analysis with the adaptability of various risk measures, allowing for a more comprehensive and flexible approach to technical trading.

Market Structure Break Targets [UAlgo]The "Market Structure Break Targets " indicator is designed to identify and visualize key market structure points such as Market Structure Breaks (MSBs) and Break of Structures (BoS). These points are crucial for understanding market trends and potential reversal zones. By plotting these structures on the chart, traders can easily spot significant support and resistance levels, as well as potential entry and exit points.
This indicator uses a combination of swing highs and lows to determine market structures and calculates targets based on user-defined percentages or Average True Range (ATR) multipliers. It provides visual cues in the form of lines, labels, and boxes to help traders quickly interpret market conditions.
🔶 Key Features
Customizable Swing Length: Users can set the swing length to identify the pivot highs and lows, which are crucial for determining market structure.
Target Duration Bars: Defines the maximum duration (in bars) for which the targets will be considered valid.
Target Calculation Methods: The target levels are crucial for setting potential price objectives. The calculation can be based on a percentage move from the identified pivot or using the ATR to factor in market volatility. These targets help in setting realistic profit-taking levels or identifying stop-loss placements.
Bullish and Bearish Market Structure Break (MSB): Detects and highlights bullish and bearish market structure breaks with customizable colors and target percentages.
Bullish MSB
When the price closes above a significant pivot high, a bullish MSB is identified. The indicator will draw a line at this level and calculate a target based on the chosen method (percentage or ATR). The target is visualized with a dotted line, and a label "MSB" is displayed. Additionally, an order block is created at the level of the bullish MSB. This order block is highlighted with a semi-transparent box, representing a potential area where price might find support in the future.
Bearish MSB
Conversely, when the price closes below a significant pivot low, a bearish MSB is marked. Similar to bullish MSBs, targets are calculated and displayed on the chart. An order block is also generated at the level of the bearish MSB, visualized with a semi-transparent box. This box highlights a potential resistance area where price might face selling pressure.
Bullish and Bearish Break of Structure (BoS): Identifies break of structures for both bullish and bearish scenarios, providing additional target levels.
Bullish BoS
If the price continues to rise and breaks another significant level, a bullish BoS is detected. This break is also marked with lines and labels, providing additional target levels for traders. An order block is created at the BoS level, serving as a potential support zone.
Bearish BoS
If the price falls further after a bearish MSB, a bearish BoS is identified and visualized similarly. The indicator creates an order block at the BoS level, which acts as a potential resistance zone.
🔶 Disclaimer:
Use with Caution: This indicator is provided for educational and informational purposes only and should not be considered as financial advice. Users should exercise caution and perform their own analysis before making trading decisions based on the indicator's signals.
Not Financial Advice: The information provided by this indicator does not constitute financial advice, and the creator (UAlgo) shall not be held responsible for any trading losses incurred as a result of using this indicator.
Backtesting Recommended: Traders are encouraged to backtest the indicator thoroughly on historical data before using it in live trading to assess its performance and suitability for their trading strategies.
Risk Management: Trading involves inherent risks, and users should implement proper risk management strategies, including but not limited to stop-loss orders and position sizing, to mitigate potential losses.
No Guarantees: The accuracy and reliability of the indicator's signals cannot be guaranteed, as they are based on historical price data and past performance may not be indicative of future results.
