Sun Ingress ZodiacHi Traders,
Astrological signs of the tropical zodiac remain fixed relative to seasonal markers, such as the equinox and solstice points on the sky’s dome.
The zodiac used for the calculations does not correspond to the astronomical zodiac, but to 12 zones of 30 degrees along the ecliptic, measured from the position of the Sun at the spring equinox. The ecliptic is the plane of the Earth’s orbit around the Sun.
This script allows you see how Sun Ingress Zodiac can affect the Crypto, Stock, Indices & Commodity market.
The objectives of this script are:
1. you can see the Zodiac schedules in certain periods (earthsky.org)
2. you can see the correlation between Sun Ingress Zodiac and market reaction (is it turning or is it a swing high/ low? )
Those Dates are the Zodiac schedule (history & future), so when the Zodiac dates arrived, we can forecast the turning or swing high/low in the market (crypto, stocks, commodities & indices), the turning or swing high/low is +/- 1 day.
Those lines are just a simply vertical lines that can help us backtesting easily, hopefully we can take profit from this..
Here are some examples of the specific Zodiac affect:
Sun Ingress Aries
Sun Ingress Taurus
Sun Ingress Gemini
Sun Ingress Cancer
Sun Ingress Leo
Sun Ingress Virgo
Sun Ingress Libra
Sun Ingress Scorpio
Sun Ingress Sagittarius
Sun Ingress Capricorn
Sun Ingress Aquarius
Sun Ingress Pisces
PS:
when you subscribe, you will get:
1. Planetary Aspects & Transits (9 Planetary Ruler)
2. Retrogrades
3. Moon Phase, Moon Eclipse & 4 seasons
4. Easy Aspects (Trine & Sextile)
5. Hard Aspects (Opposition, Square & Conjunction)
6. Gann Seasonal Dates
7. Sun Ingress Zodiac
Astrology

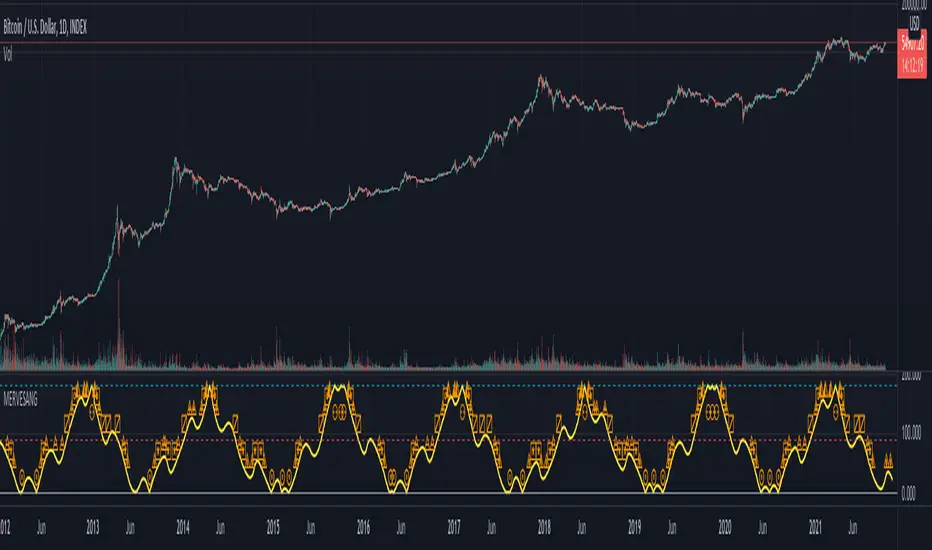
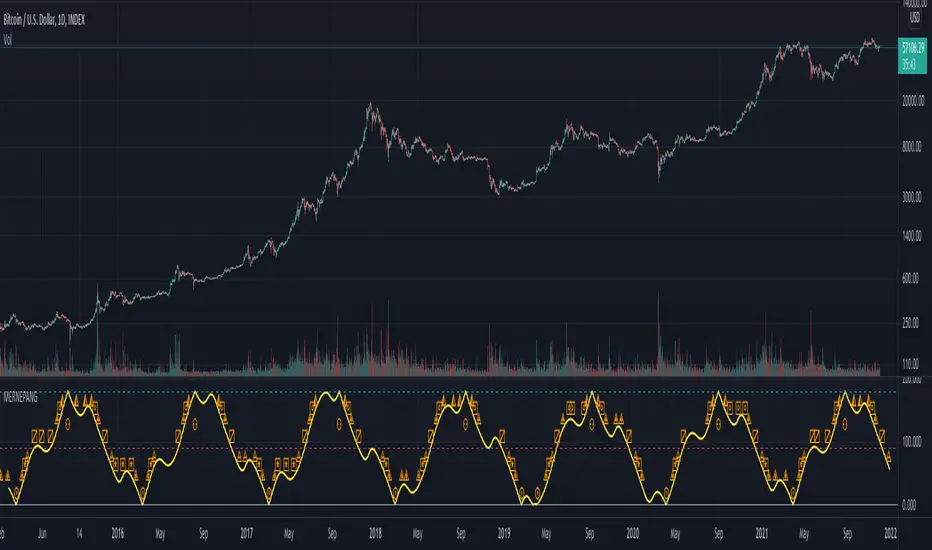
Moon Phases Strategy with CCI EXTRIME TPHELLO TO ALL ASTROLGY TRADING LOVERS
***im not a native english speaker and im not going to google translte it so soory for mastakes ****
this is an amzing script of moon cycle strategy
for long -
price need to be above MA
it will buy in full moon and will sell at new moon
i added an extrime CCI TP that if cci is over bought above 200 line it will close position- it cant be edited out so enjoy it.
for short-
price need to be below MA
it will short when new moon and buy back when fullmoon
i added an extrime CCI tp that if cci is oversold under -200 line it will close position - it cant be edited out so enjoy it.
just edit the new moon Reference date by your UTC TIME!!! ׂ( GOOGLE 'NEW MOON DATE')
לכל אוהבי האסטרולוגיה ומסחר בכוכבים
סקריפט פשוט מעולה!
ללונג- האסטרטגיה קונה כאשר המחיר מעל הממוצע ויש ירח מלא-היא מוכרת כאשר יש ירח חדש או כאשרס.ס.י חוצה את קו ה200
בשורט היא עושה ההפך ומוכרת כאשר יש ירח חדש והמחיר מתחת לממוצע-היא סוגרת את הפוזציה כאשר יש ירח מלא או כאשר ס.ס.י חוצה מטה את רמת המינוס 200
אנא ערכו את התאריך רפרנס לירח לפי אזור הזמן שלכם חפשו בגוגל ''תאריך ירח חדש'.
BACKTEST RETURNS SOOOOOO GOOOOD !
הבאק טסטים חוזרים מושלמים
trade with the stars and rip markets

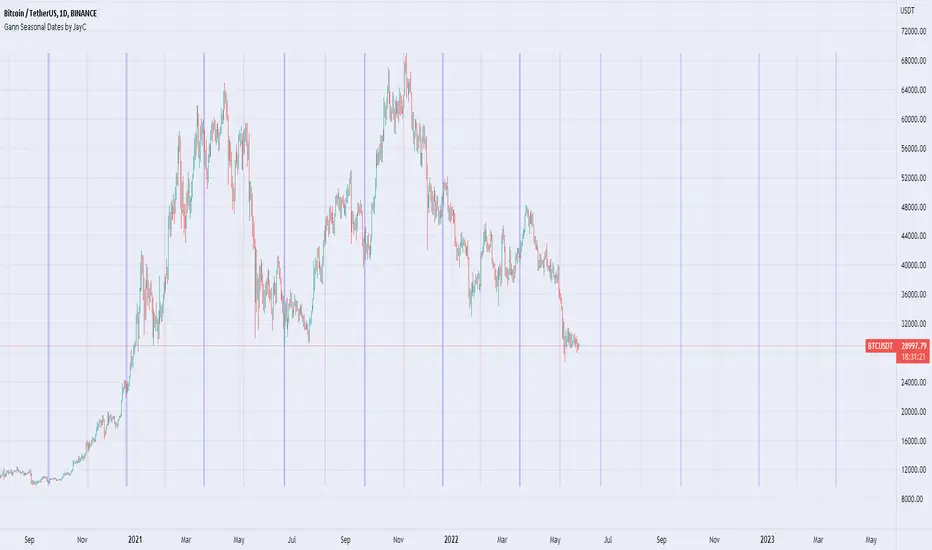
Gann Seasonal Dates by JayCThis script marks important seasonal dates with a vertical line that Gann used to watch for Trend changes.
March 21st
June 22nd
September 23rd
December 22nd
And 50% Levels - Minor seasonal dates.
February 4th
May 6th
August 8th
November 7th
In the settings you can change line colors and toggle the Offset. Offset is the way the script draws lines to show future dates, I offset by 365 so it will show incorrectly at some points in back testing.
Planetary Signs█ OVERVIEW
This script is designed to highlight planetary signs. All 12 signs on all planets going from Mercury to Pluto on both Geocentric and Heliocentric settings.
If you are an astrology trader or if you do trade cycles, this script might be great for you because it highlights all these cycles automatically.
You can select one sign or multiple signs at once, you are also able to change the color of the cycle. It should work on all time frame but with future dates it's only set to daily resolution at the moment. Current time is in sync perfectly to the minute when the sign change.
█ Future Plans and upgrades to this script may include :
1. Increase future resolution; it's set to 120 days into the future with daily resolution.
2. More styling and labeling options
And more! Feel free to contact me with any feature that you would like to see in this script
█ How to use :
1. Open the settings.
2. Select the planet.
3. Enable your favorite sign or signs.
Then Press OK & give the script a few seconds and you should be set. You can add this script to your chart more than once!
This script is coded as an addon to the Gann ToolBox package/scripts.

Easy AspectsHi Traders,
Planetary Aspects divided into 2 parts, Hard (Square and Opposition) & Easy (Trine and Sextile) Aspects, the Conjunction is depending on the planets.
This Easy Aspects script, contains:
1. Trine is an angle of 120°, which is 1/3 of the 360° ecliptic
2. Sextile is an angle of 60°, which is 1/6 of the 360° ecliptic or 1/2 a trine (120°)
The objectives of this script are:
1. you can see the Hard Aspects schedule in certain periods, history and future.. (you can double check it in horoscopes.astro-seek.com )
2. this script allows you see based on specific aspect view, you can observe the correlation between the hard aspects and market reaction (is it turning or is it a swinghigh/ low?
Here are some examples;
TRINE
Sextile
Hard Aspects Hi Traders,
Planetary Aspects divided into 2 parts, Hard (Square and Opposition) & Easy (Trine and Sextile) Aspects, the Conjunction is depending on the planets.
This Hard Aspects script, contains:
1. Square is an angle of 90°, which is 1/4 of the 360° ecliptic or 1/2 an opposition (180°)
2. Opposition is an angle of 180°, which is 1/2 of the 360° ecliptic
3. Conjunction is an angle of approximately (~) 0–10°. Typically, an orb of ~10° is considered to be a Conjunction ( I include Opposition in this script).
The objectives of this script are:
1. you can see the Hard Aspects schedule in certain periods, history and future.. (you can double check it in horoscopes.astro-seek.com )
2. this script allows you see based on specific aspect view, you can observe the correlation between the hard aspects and market reaction (is it turning or is it a swinghigh/ low?
Here are some examples;
SQUARE:
OPPOSITION
CONJUNCTION

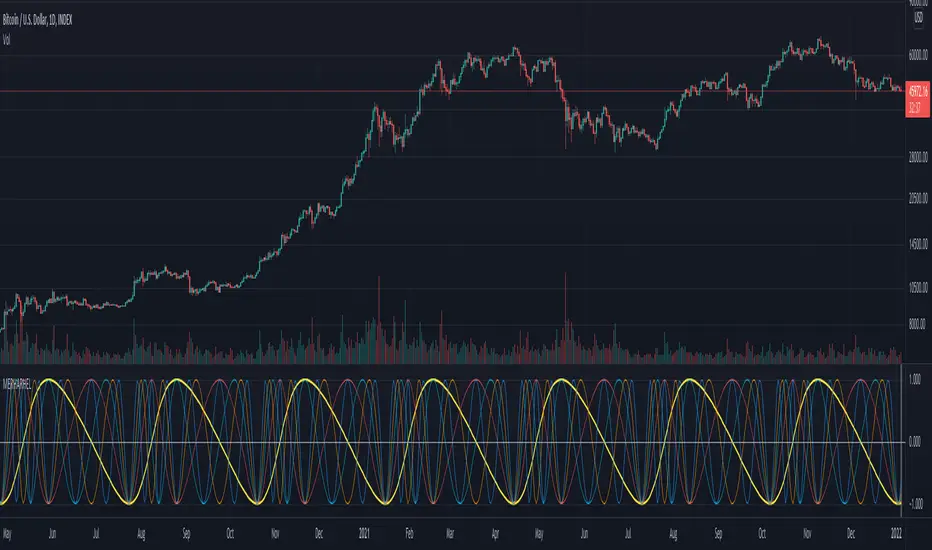
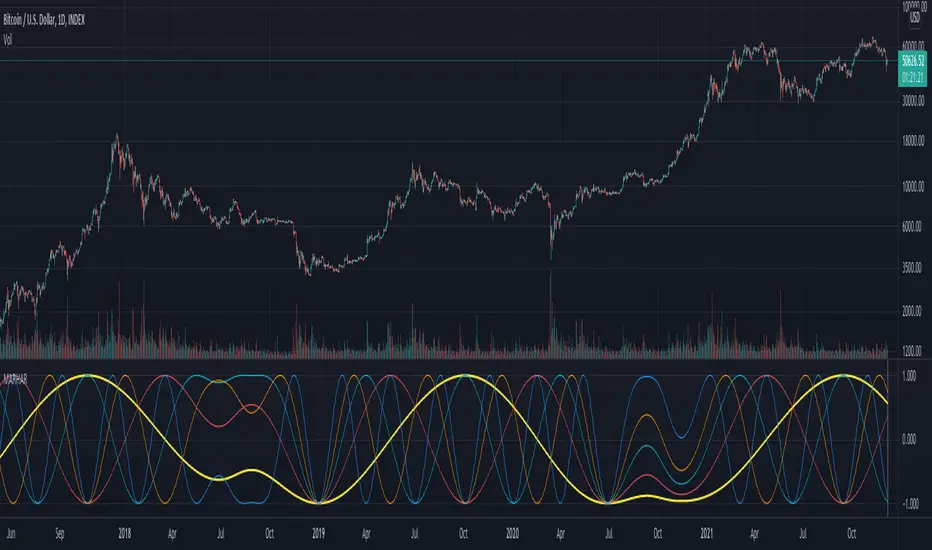
Financial Astrology Venus Helio HarmonicsVenus Helio Harmonics indicator represent the tropical zodiac energy forces that develop through the course of Venus in the heliocentric zodiac wheel. The waves indicates the strength of cardinal energy (initiator) and theirs harmonics. In Financial Astrology, Venus rules speculation, bets, entertainment (gamblers traders) and fashion.
Note: The Venus Helio Harmonics indicator is based on an ephemeris array that covers years 2010 to 2030, prior or after this years the data is not available, this daily ephemeris are based on UTC time so in order to align properly with the price bars times you should set UTC as your chart timezone.

Financial Astrology Mercury Helio HarmonicsMercury Helio Harmonics indicator represent the tropical zodiac energy forces that develop through the course of Mercury in the heliocentric zodiac wheel. The waves indicates the strength of cardinal energy (initiator) and it's harmonics. In Financial Astrology, Mercury represents the commerce, negotiations, transactions and trading, is very important cycle for trading.
Note: The Mercury Helio Harmonics indicator is based on an ephemeris array that covers years 2010 to 2030, prior or after this years the data is not available, this daily ephemeris are based on UTC time so in order to align properly with the price bars times you should set UTC as your chart timezone.
Financial Astrology Pluto HarmonicsPluto Harmonics indicator represent the tropical zodiac energy forces that develop through the course of Pluto in the tropical zodiac wheel. The waves indicates the strength of cardinal energy (initiator) and this forces seems to correlate well with the most relevant pivot points. In Financial Astrology, Pluto rules the transformations, intense actions (no limits), issues with control and power, excess, destruction.
Note: The Pluto Harmonics indicator is based on an ephemeris array that covers years 2010 to 2030, prior or after this years the data is not available, this daily ephemeris are based on UTC time so in order to align properly with the price bars times you should set UTC as your chart timezone.

Financial Astrology Neptune HarmonicsNeptune Harmonics indicator represent the tropical zodiac energy forces that develop through the course of Neptune in the tropical zodiac wheel. The waves indicates the strength of cardinal energy (initiator) and this forces seems to correlate well with the most relevant pivot points. In Financial Astrology, Neptune rules charity, confusion, imagination, waste, crime, intuition, occult, scandal, illusion, financial bubbles, scams, and dreams.
Note: The Neptune Harmonics indicator is based on an ephemeris array that covers years 2010 to 2030, prior or after this years the data is not available, this daily ephemeris are based on UTC time so in order to align properly with the price bars times you should set UTC as your chart timezone.

Financial Astrology Vesta HarmonicsVesta (asteroid) Harmonics indicator represent the tropical zodiac energy forces that develop through the course of Vesta in the tropical zodiac wheel. The waves indicates the strength of cardinal energy (initiator) and this forces seems to correlate well with the most relevant pivot points. In Financial Astrology, Vesta rules the creative energy, aspirations, goals and security business
Note: The Vesta Harmonics indicator is based on an ephemeris array that covers years 2010 to 2030, prior or after this years the data is not available, this daily ephemeris are based on UTC time so in order to align properly with the price bars times you should set UTC as your chart timezone.

Financial Astrology Ceres HarmonicsCeres Harmonics indicator represent the tropical zodiac energy forces that develop through the course of Ceres in the tropical zodiac wheel. The waves indicates the strength of cardinal energy (initiator) and this forces seems to correlate well with the most relevant pivot points. In Financial Astrology, Ceres rules growing, nutrition, food, farming and prosperity.
Note: The Ceres Harmonics indicator is based on an ephemeris array that covers years 2010 to 2030, prior or after this years the data is not available, this daily ephemeris are based on UTC time so in order to align properly with the price bars times you should set UTC as your chart timezone.

Financial Astrology Uranus HarmonicsUranus Harmonics indicator represent the tropical zodiac energy forces that develop through the course of Uranus in the tropical zodiac wheel. The waves indicates the strength of cardinal energy (initiator) and this forces seems to correlate well with the most relevant pivot points. In Financial Astrology, Uranus rules change, innovation, disruption, inventions, revolutions and technology.
Note: The Uranus Harmonics indicator is based on an ephemeris array that covers years 2010 to 2030, prior or after this years the data is not available, this daily ephemeris are based on UTC time so in order to align properly with the price bars times you should set UTC as your chart timezone.

Financial Astrology Saturn HarmonicsSaturn Harmonics indicator represent the tropical zodiac energy forces that develop through the course of Saturn in the tropical zodiac wheel. The waves indicates the strength of cardinal energy (initiator) and this forces seems to correlate well with the most relevant pivot points. In Financial Astrology, Saturn rules temperance, rectitude, constancy, greed, fear and pessimism.
Note: The Saturn Harmonics indicator is based on an ephemeris array that covers years 2010 to 2030, prior or after this years the data is not available, this daily ephemeris are based on UTC time so in order to align properly with the price bars times you should set UTC as your chart timezone.

Financial Astrology Jupiter HarmonicsJupiter Harmonics indicator represent the tropical zodiac energy forces that develop through the course of Jupiter in the tropical zodiac wheel. The waves indicates the strength of cardinal energy (initiator) and this forces seems to correlate well with the most relevant pivot points . In Financial Astrology, Jupiter rules expansion, optimism, enthusiasm, joviality and devotion.
Note: The Jupiter Harmonics indicator is based on an ephemeris array that covers years 2010 to 2030, prior or after this years the data is not available, this daily ephemeris are based on UTC time so in order to align properly with the price bars times you should set UTC as your chart timezone.

Financial Astrology Mars HarmonicsMars Harmonics indicator represent the tropical zodiac energy forces that develop through the course of Mars in the tropical zodiac wheel. The waves indicates the strength of cardinal energy (initiator) and this forces seems to correlate well with the most relevant pivot points. In Financial Astrology, Mars rules impulsive/risky action, entrepreneurship, aggression, explosion and passion. Observe carefully the waves cycles in your favourite instruments.
Note: The Mars Harmonics indicator is based on an ephemeris array that covers years 2010 to 2030, prior or after this years the data is not available, this daily ephemeris are based on UTC time so in order to align properly with the price bars times you should set UTC as your chart timezone.
Financial Astrology Moon HarmonicsMoon Harmonics indicator represent the tropical zodiac energy forces that develop through the course of Moon in the tropical zodiac wheel. The waves indicates the strength of cardinal energy (initiator) and this forces seems to correlate well with the most relevant pivot points. Consider that Moon rules the emotions, instinctive reactions, the flow of the energy from our inner to the outer world.
Note: The Moon Harmonics indicator is based on an ephemeris array that covers years 2010 to 2030, prior or after this years the data is not available, this daily ephemeris are based on UTC time so in order to align properly with the price bars times you should set UTC as your chart timezone.

Financial Astrology Mercury-Pluto Longitude AngleMercury-Pluto angle indicator represent the geocentric longitude angular distance between Mercury and Pluto with labels on the angles that indicate the astrological aspects used by financial astrologers to determine the energy trigger points. In financial astrology, Mercury rules trading, market transactions, commerce and negotiation. Pluto rules the transformations, intense actions (no limits), issues with control and power, excess, destruction.
For any Mercury aspects indicator we recommend to use 4H resolution to locate the exact aspect culmination, this is because Mercury moves at an average geocentric speed of 1.6 degrees per day.
Due to the limited UTF (Unicode Transformation Format) support of classical astrology aspects symbols, we needed to use a custom subset to represent the aspects:
⊚ = 0 degrees angle (conjuction)
⧌ = 30 degrees angle (semi-sextile)
⧆ = 45 degrees angle (semi-square)
⨺ = 60 degrees angle (sextile)
⧄ = 90 degrees angle (square)
⨹ = 120 degrees angle (trine)
⧇ = 135 degrees angle (sesqui-square)
◭ = 150 degrees angle (quincunx or inconjunct)
⚇ = 180 degrees angle (opposition)
Note: The Mercury-Pluto longitude angle indicator is based on an ephemeris array that covers years 2010 to 2030, prior or after this years the data is not available, this daily ephemeris are based on UTC time so in order to align properly with the price bars times you should set UTC as your chart timezone.

Financial Astrology Mercury-Neptune Longitude AngleMercury-Neptune angle indicator represent the geocentric longitude angular distance between Mercury and Neptune with labels on the angles that indicate the astrological aspects used by financial astrologers to determine the energy trigger points. In financial astrology, Mercury rules trading, market transactions, commerce and negotiation. Neptune rules charity, confusion, imagination, waste, crime, intuition, occult, scandal, illusion, financial bubbles, scams, and dreams.
For any Mercury aspects indicator we recommend to use 4H resolution to locate the exact aspect culmination, this is because Mercury moves at an average geocentric speed of 1.6 degrees per day.
Due to the limited UTF (Unicode Transformation Format) support of classical astrology aspects symbols, we needed to use a custom subset to represent the aspects:
⊚ = 0 degrees angle (conjuction)
⧌ = 30 degrees angle (semi-sextile)
⧆ = 45 degrees angle (semi-square)
⨺ = 60 degrees angle (sextile)
⧄ = 90 degrees angle (square)
⨹ = 120 degrees angle (trine)
⧇ = 135 degrees angle (sesqui-square)
◭ = 150 degrees angle (quincunx or inconjunct)
⚇ = 180 degrees angle (opposition)
Note: The Mercury-Neptune longitude angle indicator is based on an ephemeris array that covers years 2010 to 2030, prior or after this years the data is not available, this daily ephemeris are based on UTC time so in order to align properly with the price bars times you should set UTC as your chart timezone.
Financial Astrology Mercury-Uranus Longitude AngleMercury-Uranus angle indicator represent the geocentric longitude angular distance between Mercury and Uranus with labels on the angles that indicate the astrological aspects used by financial astrologers to determine the energy trigger points. In financial astrology, Mercury rules trading, market transactions, commerce and negotiation. Uranus rules change, innovation, disruption, inventions, revolutions and technology.
For any Mercury aspects indicator we recommend to use 4H resolution to locate the exact aspect culmination, this is because Mercury moves at an average geocentric speed of 1.6 degrees per day.
Due to the limited UTF (Unicode Transformation Format) support of classical astrology aspects symbols, we needed to use a custom subset to represent the aspects:
⊚ = 0 degrees angle (conjuction)
⧌ = 30 degrees angle (semi-sextile)
⧆ = 45 degrees angle (semi-square)
⨺ = 60 degrees angle (sextile)
⧄ = 90 degrees angle (square)
⨹ = 120 degrees angle (trine)
⧇ = 135 degrees angle (sesqui-square)
◭ = 150 degrees angle (quincunx or inconjunct)
⚇ = 180 degrees angle (opposition)
Note: The Mercury-Uranus longitude angle indicator is based on an ephemeris array that covers years 2010 to 2030, prior or after this years the data is not available, this daily ephemeris are based on UTC time so in order to align properly with the price bars times you should set UTC as your chart timezone.

Financial Astrology Mercury-Saturn Longitude AngleMercury-Saturn angle indicator represent the geocentric longitude angular distance between Mercury and Saturn with labels on the angles that indicate the astrological aspects used by financial astrologers to determine the energy trigger points. In financial astrology, Mercury rules trading, market transactions, commerce and negotiation. Saturn rules temperance, rectitude, constancy, greed, fear and pessimism.
For any Mercury aspects indicator we recommend to use 4H resolution to locate the exact aspect culmination, this is because Mercury moves at an average geocentric speed of 1.6 degrees per day.
Due to the limited UTF (Unicode Transformation Format) support of classical astrology aspects symbols, we needed to use a custom subset to represent the aspects:
⊚ = 0 degrees angle (conjuction)
⧌ = 30 degrees angle (semi-sextile)
⧆ = 45 degrees angle (semi-square)
⨺ = 60 degrees angle (sextile)
⧄ = 90 degrees angle (square)
⨹ = 120 degrees angle (trine)
⧇ = 135 degrees angle (sesqui-square)
◭ = 150 degrees angle (quincunx or inconjunct)
⚇ = 180 degrees angle (opposition)
Note: The Mercury-Saturn longitude angle indicator is based on an ephemeris array that covers years 2010 to 2030, prior or after this years the data is not available, this daily ephemeris are based on UTC time so in order to align properly with the price bars times you should set UTC as your chart timezone.

Financial Astrology Mercury-Jupiter Longitude AngleMercury-Jupiter angle indicator represent the geocentric longitude angular distance between Mercury and Jupiter with labels on the angles that indicate the astrological aspects used by financial astrologers to determine the energy trigger points. In financial astrology, Mercury rules trading, market transactions, commerce and negotiation. Jupiter rules expansion, optimism, enthusiasm, joviality and devotion.
For any Mercury aspects indicator we recommend to use 4H resolution to locate the exact aspect culmination, this is because Mercury moves at an average geocentric speed of 1.6 degrees per day.
Due to the limited UTF (Unicode Transformation Format) support of classical astrology aspects symbols, we needed to use a custom subset to represent the aspects:
⊚ = 0 degrees angle (conjuction)
⧌ = 30 degrees angle (semi-sextile)
⧆ = 45 degrees angle (semi-square)
⨺ = 60 degrees angle (sextile)
⧄ = 90 degrees angle (square)
⨹ = 120 degrees angle (trine)
⧇ = 135 degrees angle (sesqui-square)
◭ = 150 degrees angle (quincunx or inconjunct)
⚇ = 180 degrees angle (opposition)
Note: The Mercury-Jupiter longitude angle indicator is based on an ephemeris array that covers years 2010 to 2030, prior or after this years the data is not available, this daily ephemeris are based on UTC time so in order to align properly with the price bars times you should set UTC as your chart timezone.

Financial Astrology Mercury-Vesta Longitude AngleMercury-Vesta angle indicator represent the geocentric longitude angular distance between Mercury and Vesta with labels on the angles that indicate the astrological aspects used by financial astrologers to determine the energy trigger points. In financial astrology, Mercury rules trading, market transactions, commerce and negotiation. Vesta rules the creative energy, aspirations, goals and security business.
For any Mercury aspects indicator we recommend to use 4H resolution to locate the exact aspect culmination, this is because Mercury moves at an average geocentric speed of 1.6 degrees per day.
Due to the limited UTF (Unicode Transformation Format) support of classical astrology aspects symbols, we needed to use a custom subset to represent the aspects:
⊚ = 0 degrees angle (conjuction)
⧌ = 30 degrees angle (semi-sextile)
⧆ = 45 degrees angle (semi-square)
⨺ = 60 degrees angle (sextile)
⧄ = 90 degrees angle (square)
⨹ = 120 degrees angle (trine)
⧇ = 135 degrees angle (sesqui-square)
◭ = 150 degrees angle (quincunx or inconjunct)
⚇ = 180 degrees angle (opposition)
Note: The Mercury-Vesta longitude angle indicator is based on an ephemeris array that covers years 2010 to 2030, prior or after this years the data is not available, this daily ephemeris are based on UTC time so in order to align properly with the price bars times you should set UTC as your chart timezone.