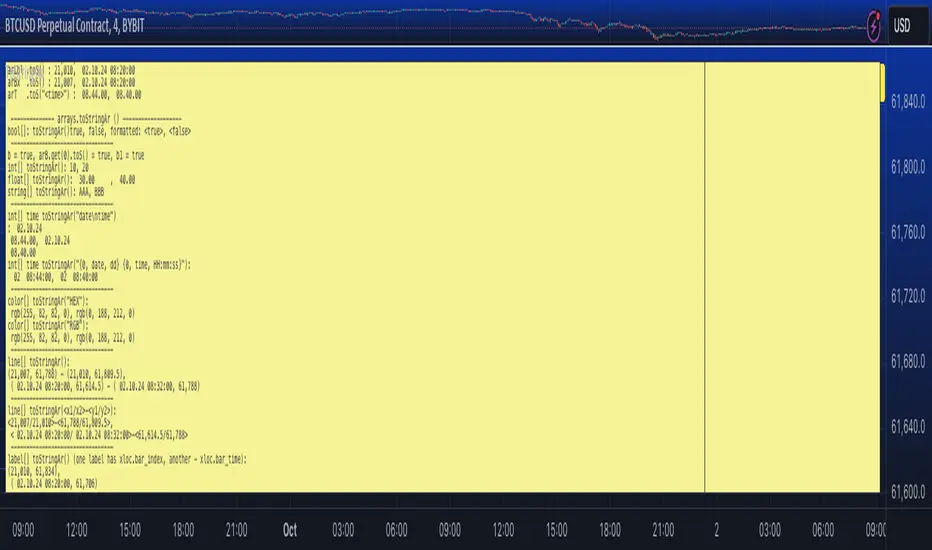
ToStringAr█ OVERVIEW
Contains to string conversion methods arrays of int/float/bool/string/line/label/box types
- toS() - method works like array.join() with more flexibility and
- toStringAr() - converts array to string on a per item basis and returns the resulting string array
Conversion of each item to string is made using toS() function from moebius1977/ToS/1 library.
█ GENERAL DESCRIPTION OF LIBRARY FUNCTIONS
All toS(array) methods have same parameters. The only difference will be in format parameter as explained below.
method toS(this, index_from, index_to, separator, showIDs, format, truncate_left, size_limit, nz)
Like array.join() but with string length limit. Joins elements into readable string (length capped at 4000, truncating the end or beg)
Parameters:
this (array) : array to be converted to string
index_from (int) : index_from (int) (Optional) Start from this id (starting from 0, in insertion order). If omitted - start from the first item.
index_to (int) : index_to (int) (Optional) End with this pair (inclusive, in insertion order). If omitted - to last item.
separator (string) : separator (string) (Optional) String to be inserted between pairs. Default: `", "`
showIDs (bool) : showIDs (bool) (Optional) If true item's id is added in the form `id: value`.
format (string) : format (string) (Optional) Format string fo toS(). If omitted default format is used depending in the type.
truncate_left (bool) : truncate_left (bool) (Optional) Truncate from left or right. Default: false.
size_limit (int) : size_limit (int) (Optional) Max output string length. Default: 4000.
nz (string) : nz (string) (Optional) A string used to represent na (na values are substituted with this string).
format parameter depends on the type:
For toS(bool/int/float ...) format parameter works in the same way as `str.format()` (i.e. you can use same format strings as with `str.format()` with `{0}` as a placeholder for the value) with some shorthand "format" options available:
--- number ---
- "" => "{0}"
- "number" => "{0}"
- "0" => "{0, number, 0 }"
- "0.0" => "{0, number, 0.0 }"
- "0.00" => "{0, number, 0.00 }"
- "0.000" => "{0, number, 0.000 }"
- "0.0000" => "{0, number, 0.0000 }"
- "0.00000" => "{0, number, 0.00000 }"
- "0.000000" => "{0, number, 0.000000 }"
- "0.0000000" => "{0, number, 0.0000000}"
--- date ---
- "... ... " in any place is substituted with "{0, date, dd.MM.YY}" (e.g. " " results in "{0, date, dd.MM.YY\} {0, time, HH.mm.ss}")
- "date" => "{0, date, dd.MM.YY}"
- "date : time" => "{0, date, dd.MM.YY} : {0, time, HH.mm.ss}"
- "dd.MM" => "{0, date, dd:MM}"
- "dd" => "{0, date, dd}"
--- time ---
- "... ... " in any place is substituted with "{0, time, HH.mm.ss}" (e.g. " " results in "{0, date, dd.MM.YY\} {0, time, HH.mm.ss}")
- "time" => "{0, time, HH:mm:ss}"
- "HH:mm" => "{0, time, HH:mm}"
- "mm:ss" => "{0, time, mm:ss}"
- "date time" => "{0, date, dd.MM.YY\} {0, time, HH.mm.ss}"
- "date, time" => "{0, date, dd.MM.YY\}, {0, time, HH.mm.ss}"
- "date,time" => "{0, date, dd.MM.YY\},{0, time, HH.mm.ss}"
- "date time" => "{0, date, dd.MM.YY\} {0, time, HH.mm.ss}"
For toS(line ...):
format (string) : (string) (Optional) Use `x1` as placeholder for `x1` and so on. E.g. default format is `"(x1, y1) - (x2, y2)"`.
For toS(label ...) :
format (string) : (string) (Optional) Use `x1` as placeholder for `x`, `y1 - for `y` and `txt` for label's text. E.g. default format is `(x1, y1): "txt"` if ptint_text is true and `(x1, y1)` if false.
For toS(box ... ) :
format (string) : (string) (Optional) Use `x1` as placeholder for `x`, `y1 - for `y` etc. E.g. default format is "(x1, y1) - (x2, y2)".
For toS(color] ... ) :
format (string) : (string) (Optional) Options are "HEX" (e.g. "#FFFFFF33") or "RGB" (e.g. "rgb(122,122,122,23)"). Default is "HEX".
All toStringAr() methods just convert each item to string using toS with same format options as described above.
Parameters:
arr (array) : Array to be converted to a string array.
format (string) : Format string.
nz (string) : Placeholder for na items.
█ FULL OF FUNCTIONS AND PARAMETERS
Library "ToStringAr"
Contains toString/toS conversion methods for int/float/bool/string/line/label/box and arrays and matrices thereof. Also contains a string wraping function.
method toS(this, index_from, index_to, separator, showIDs, format, truncate_left, size_limit, nz)
Namespace types: array
Parameters:
this (array)
index_from (int)
index_to (int)
separator (string)
showIDs (bool)
format (string)
truncate_left (bool)
size_limit (int)
nz (string)
method toS(this, index_from, index_to, separator, showIDs, format, truncate_left, size_limit, nz)
Namespace types: array
Parameters:
this (array)
index_from (int)
index_to (int)
separator (string)
showIDs (bool)
format (string)
truncate_left (bool)
size_limit (int)
nz (string)
method toS(this, index_from, index_to, separator, showIDs, format, truncate_left, size_limit, nz)
Namespace types: array
Parameters:
this (array)
index_from (int)
index_to (int)
separator (string)
showIDs (bool)
format (string)
truncate_left (bool)
size_limit (int)
nz (string)
method toS(this, index_from, index_to, separator, showIDs, format, truncate_left, size_limit, nz)
Namespace types: array
Parameters:
this (array)
index_from (int)
index_to (int)
separator (string)
showIDs (bool)
format (string)
truncate_left (bool)
size_limit (int)
nz (string)
method toS(this, index_from, index_to, separator, showIDs, format, truncate_left, size_limit, nz)
Namespace types: array
Parameters:
this (array)
index_from (int)
index_to (int)
separator (string)
showIDs (bool)
format (string)
truncate_left (bool)
size_limit (int)
nz (string)
method toS(this, index_from, index_to, separator, showIDs, format, truncate_left, size_limit, nz)
Namespace types: array
Parameters:
this (array)
index_from (int)
index_to (int)
separator (string)
showIDs (bool)
format (string)
truncate_left (bool)
size_limit (int)
nz (string)
method toS(this, index_from, index_to, separator, showIDs, format, truncate_left, size_limit, nz)
Namespace types: array
Parameters:
this (array)
index_from (int)
index_to (int)
separator (string)
showIDs (bool)
format (string)
truncate_left (bool)
size_limit (int)
nz (string)
method toS(this, index_from, index_to, separator, showIDs, format, truncate_left, size_limit, nz)
Namespace types: array
Parameters:
this (array)
index_from (int)
index_to (int)
separator (string)
showIDs (bool)
format (string)
truncate_left (bool)
size_limit (int)
nz (string)
method toStringAr(arr, format, nz)
Namespace types: array
Parameters:
arr (array)
format (string)
nz (string)
method toStringAr(arr, format, nz)
Namespace types: array
Parameters:
arr (array)
format (string)
nz (string)
method toStringAr(arr, format, nz)
Namespace types: array
Parameters:
arr (array)
format (string)
nz (string)
method toStringAr(arr, format, nz)
Namespace types: array
Parameters:
arr (array)
format (string)
nz (string)
method toStringAr(arr, format, nz)
Namespace types: array
Parameters:
arr (array)
format (string)
nz (string)
method toStringAr(arr, format, nz)
Namespace types: array
Parameters:
arr (array)
format (string)
nz (string)
method toStringAr(arr, format, nz)
Namespace types: array
Parameters:
arr (array)
format (string)
nz (string)
method toStringAr(arr, format, nz)
Namespace types: array
Parameters:
arr (array)
format (string)
nz (string)
Array
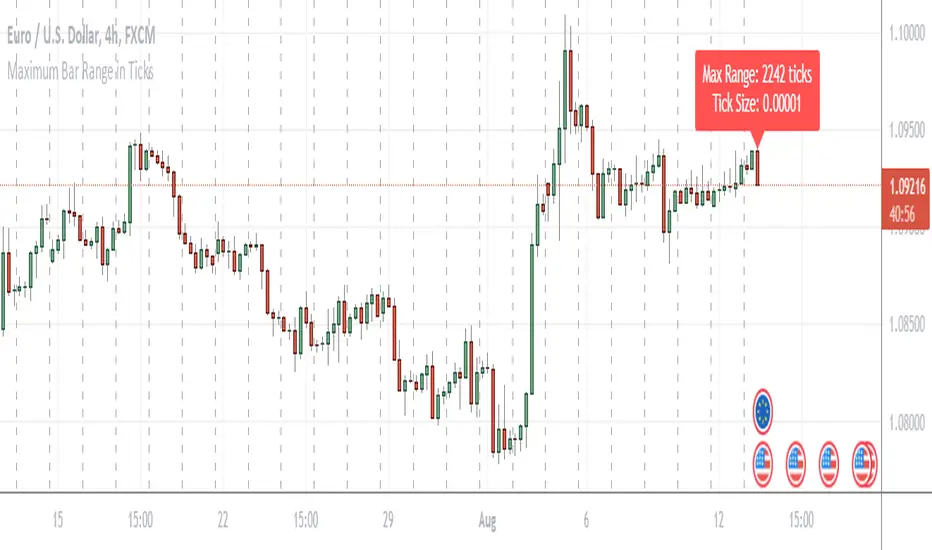
Maximum Bar Range in TicksThis is a simple indicator that gives the maximum range of any bar on the chart in ticks. I found it useful when sizing arrays and it might also be valuable when working out risk parameters.
Gartley Harmonic Pattern [TradingFinder] Harmonic Chart patterns🔵 Introduction
Research by H.M. Gartley and Scott Carney emphasizes the importance of harmonic patterns in technical analysis for predicting market movements. Gartley's work, particularly the Gartley 222 pattern, is detailed in his book "Profits in the Stock Market" and relies on the specific placement of points X, A, B, C, and D.
🟣 Defining the Gartley Pattern
The Gartley pattern is a powerful technical analysis tool often seen at the end of a trend, signaling a potential reversal. Ideally, it forms during the first and second waves of Elliott Wave theory, with wave XA representing wave 1 and the entire ABCD correction representing wave 2.
While patterns outside this structure are also valid, the key points of the Gartley pattern align closely with Fibonacci retracement levels. Specifically, point B corrects wave XA to the 61.8% level, point C lies between 38% and 79% of wave AB, and point D extends between 113% and 162% of wave BC.
The bullish Gartley pattern, shown below, forms at the end of a downtrend and signals a potential buying opportunity.
Bullish :
Bearish :
🔵 How to Use
🟣 Bullish Gartley Pattern
To spot a bullish Gartley pattern, follow these rules: the move from point X to point A (the first leg) must be upward. The subsequent move from point A to point B is downward, followed by an upward move from point B to point C.
Finally, the move from point C to point D is downward. On a chart, this pattern resembles the letter M. After the final leg of this pattern, prices are expected to rise from point D.
🟣 Bearish Gartley Pattern
A bearish Gartley pattern forms similarly to the bullish one but in reverse. The initial move from point X to point A should be downward. The next move from point A to point B is upward, followed by a downward move from point B to point C.
The final leg moves upward from point C to point D. This pattern appears as a W on charts, indicating that prices are likely to fall from point D after the final move.
By understanding and identifying Gartley patterns, traders can enhance their technical analysis and improve their decision-making in financial markets. These patterns, when correctly identified, offer significant insights into potential market reversals and continuation patterns.
🔵 Setting
🟣 Logical Setting
ZigZag Pivot Period : You can adjust the period so that the harmonic patterns are adjusted according to the pivot period you want. This factor is the most important parameter in pattern recognition.
Show Valid Format : If this parameter is on "On" mode, only patterns will be displayed that they have exact format and no noise can be seen in them. If "Off" is, the patterns displayed that maybe are noisy and do not exactly correspond to the original pattern
Show Formation Last Pivot Confirm : if Turned on, you can see this ability of patterns when their last pivot is formed. If this feature is off, it will see the patterns as soon as they are formed. The advantage of this option being clear is less formation of fielded patterns, and it is accompanied by the latest pattern seeing and a sharp reduction in reward to risk.
Period of Formation Last Pivot : Using this parameter you can determine that the last pivot is based on Pivot period.
🟣 Genaral Setting
Show : Enter "On" to display the template and "Off" to not display the template.
Color : Enter the desired color to draw the pattern in this parameter.
LineWidth : You can enter the number 1 or numbers higher than one to adjust the thickness of the drawing lines. This number must be an integer and increases with increasing thickness.
LabelSize : You can adjust the size of the labels by using the "size.auto", "size.tiny", "size.smal", "size.normal", "size.large" or "size.huge" entries.
🟣 Alert Setting
Alert : On / Off
Message Frequency : This string parameter defines the announcement frequency. Choices include: "All" (activates the alert every time the function is called), "Once Per Bar" (activates the alert only on the first call within the bar), and "Once Per Bar Close" (the alert is activated only by a call at the last script execution of the real-time bar upon closing). The default setting is "Once per Bar".
Show Alert Time by Time Zone : The date, hour, and minute you receive in alert messages can be based on any time zone you choose. For example, if you want New York time, you should enter "UTC-4". This input is set to the time zone "UTC" by default.

series_collectionLibrary "series_collection"
A personal collection of commonly used series types like moving averages that are supported directly by
the pinescript library ('ALMA', 'DEMA', 'EMA', 'HMA', 'RMA', 'SMA', 'SWMA', 'VWMA', 'WMA'), highest and lowest source,
median and pivots. One single function (with overloads) that can be configured easily by the user input and can be
used as a core piece of functionality for many user cases. This library was created to abstract away and re-use this
commonly used functionality in my "Two MA Signal Indicator" script and the "Template Trailing Strategy" script. Both
of them use the "two_ma_logic" for defining entry and exit signals. While this piece of work does not contain any
novel mathematical expressions and just adds a convinient (and configurable) way to do things, I hope that might add
value to other scripts as well and future projects.
cust_series(length, seriesType, source)
cust_series - Calculate the custom series of the given source for the given length and type
Parameters:
length (simple int) : - The length of the custom series
seriesType (simple string) : - The type of the custom series
source (float) : - The source of the values
Returns: - The resulting value of the calculations of the custom series
cust_series(length, seriesType, source)
cust_series - Calculate the custom series of the given source for the given length and type
Parameters:
length (simple float) : - The length of the custom series (ceiled)
seriesType (simple string) : - The type of the custom series
source (float) : - The source of the values
Returns: - The resulting value of the calculations of the custom series

RSI Radar Multi Time FrameHello All!
First of all many Thanks to Tradingview and Pine Team for developing Pine Language all the time! Now we have a new feature and it's called Polylines and I developed RSI Radar Multi Time Frame . This script is an example and experimental work, you can use it as you wish.
The scripts gets RSI values from 6 different time frames, it doesn't matter the time frame you choose is higher/lower or chart time frame. it means that the script can get RSI values from higher or lower time frames than chart time frame.
It's designed to show RSI Radar all the time on the chart even if you zoom in/out or scroll left/right.
You can set OB/OS or RSI line colors. Also RSI polyline is shown as Curved/Hexagon optionally.
Some screenshots here:
Doesn't matter if you zoom out, it can show RSI radar in the visible area:
Another example:
You can change the colors, or see the RSI as Hexagon:
Time frames from seconds to 1Day in this example while chart time frame is any ( 30mins here )
Enjoy!

multidataLibrary "multidata"
A library for multi-dimensional data arrays.
Full documentation: faiyaz7283.github.io
This library is designed to enhance data storage capabilities in Pine Script, enabling users to work with two separate data structures: data2d (key -> main-value | alternate-value) and data3d (primary key -> data key-> main-value | alternate-value). These structures facilitate storing key-value pairs in a flexible and efficient manner, offering various methods for manipulation and retrieval of data. Please check out the full documentation at faiyaz7283.github.io .

debugLibrary "debug"
Show Array or Matrix Elements In Table
Use anytime you want to see the elements in an array or a matrix displayed.
Effective debugger, particularly for strategies and complex logic structures.
Look in code to find instructions. Reach out if you need assistance.
Functionality includes:
Viewing the contents of an array or matrix on screen.
Track variables and variable updates using debug()
Track if and when local scopes fire using debugs()
Types Allowed:
string
float
int
string
debug(_col, _row, _name, _value, _msg, _ip)
Debug Variables in Matrix
Parameters:
_col (int) : (int) Assign Column
_row (int) : (int) Assign Row
_name (matrix) : (simple matrix) Matrix Name
_value (string) : (string) Assign variable as a string (str.tostring())
_msg (string)
_ip (int) : (int) (default 1) 1 for continuous updates. 2 for barstate.isnew updates. 3 for barstate.isconfirmed updates. -1 to only add once
Returns: Returns Variable _value output and _msg formatted as '_msg: variableOutput' in designated column and row
debug(_col, _row, _name, _value, _msg, _ip)
Parameters:
_col (int)
_row (int)
_name (matrix)
_value (float)
_msg (string)
_ip (int)
debug(_col, _row, _name, _value, _msg, _ip)
Parameters:
_col (int)
_row (int)
_name (matrix)
_value (int)
_msg (string)
_ip (int)
debug(_col, _row, _name, _value, _msg, _ip)
Parameters:
_col (int)
_row (int)
_name (matrix)
_value (bool)
_msg (string)
_ip (int)
debugs(_col, _row, _name, _msg)
Debug Scope in Matrix - Identify When Scope Is Accessed
Parameters:
_col (int) : (int) Column Number
_row (int) : (int) Row Number
_name (matrix) : (simple matrix) Matrix Name
_msg (string) : (string) Message
Returns: Message appears in debug panel using _col/_row as the identifier
viewArray(_arrayName, _pos, _txtSize, _tRows, s_index, s_border, _rowCol, bCol, _fillCond, _offset)
Array Element Display (Supports float , int , string , and bool )
Parameters:
_arrayName (float ) : ID of Array to be Displayed
_pos (string) : Position for Table
_txtSize (string) : Size of Table Cell Text
_tRows (int) : Number of Rows to Display Data In (columns will be calculated accordingly)
s_index (bool) : (Optional. Default True.) Show/Hide Index Numbers
s_border (bool) : (Optional. Default False.) Show/Hide Border
_rowCol (string)
bCol (color) : = (Optional. Default Black.) Frame/Border Color.
_fillCond (bool) : (Optional) Conditional statement. Function displays array only when true. For instances where size is not immediately known or indices are na. Default = true, indicating array size is set at bar_index 0.
_offset (int) : (Optional) Use to view historical array states. Default = 0, displaying realtime bar.
Returns: A Display of Array Values in a Table
viewArray(_arrayName, _pos, _txtSize, _tRows, s_index, s_border, _rowCol, bCol, _fillCond, _offset)
Parameters:
_arrayName (int )
_pos (string)
_txtSize (string)
_tRows (int)
s_index (bool)
s_border (bool)
_rowCol (string)
bCol (color)
_fillCond (bool)
_offset (int)
viewArray(_arrayName, _pos, _txtSize, _tRows, s_index, s_border, _rowCol, bCol, _fillCond, _offset)
Parameters:
_arrayName (string )
_pos (string)
_txtSize (string)
_tRows (int)
s_index (bool)
s_border (bool)
_rowCol (string)
bCol (color)
_fillCond (bool)
_offset (int)
viewArray(_arrayName, _pos, _txtSize, _tRows, s_index, s_border, _rowCol, bCol, _fillCond, _offset)
Parameters:
_arrayName (bool )
_pos (string)
_txtSize (string)
_tRows (int)
s_index (bool)
s_border (bool)
_rowCol (string)
bCol (color)
_fillCond (bool)
_offset (int)
viewMatrix(_matrixName, _pos, _txtSize, s_index, _resetIdx, s_border, bCol, _fillCond, _offset)
Matrix Element Display (Supports , , , and )
Parameters:
_matrixName (matrix) : ID of Matrix to be Displayed
_pos (string) : Position for Table
_txtSize (string) : Size of Table Cell Text
s_index (bool) : (Optional. Default True.) Show/Hide Index Numbers
_resetIdx (bool)
s_border (bool) : (Optional. Default False.) Show/Hide Border
bCol (color) : = (Optional. Default Black.) Frame/Border Color.
_fillCond (bool) : (Optional) Conditional statement. Function displays matrix only when true. For instances where size is not immediately known or indices are na. Default = true, indicating matrix size is set at bar_index 0.
_offset (int) : (Optional) Use to view historical matrix states. Default = 0, displaying realtime bar.
Returns: A Display of Matrix Values in a Table
viewMatrix(_matrixName, _pos, _txtSize, s_index, _resetIdx, s_border, bCol, _fillCond, _offset)
Parameters:
_matrixName (matrix)
_pos (string)
_txtSize (string)
s_index (bool)
_resetIdx (bool)
s_border (bool)
bCol (color)
_fillCond (bool)
_offset (int)
viewMatrix(_matrixName, _pos, _txtSize, s_index, _resetIdx, s_border, bCol, _fillCond, _offset)
Parameters:
_matrixName (matrix)
_pos (string)
_txtSize (string)
s_index (bool)
_resetIdx (bool)
s_border (bool)
bCol (color)
_fillCond (bool)
_offset (int)
viewMatrix(_matrixName, _pos, _txtSize, s_index, _resetIdx, s_border, bCol, _fillCond, _offset)
Parameters:
_matrixName (matrix)
_pos (string)
_txtSize (string)
s_index (bool)
_resetIdx (bool)
s_border (bool)
bCol (color)
_fillCond (bool)
_offset (int)

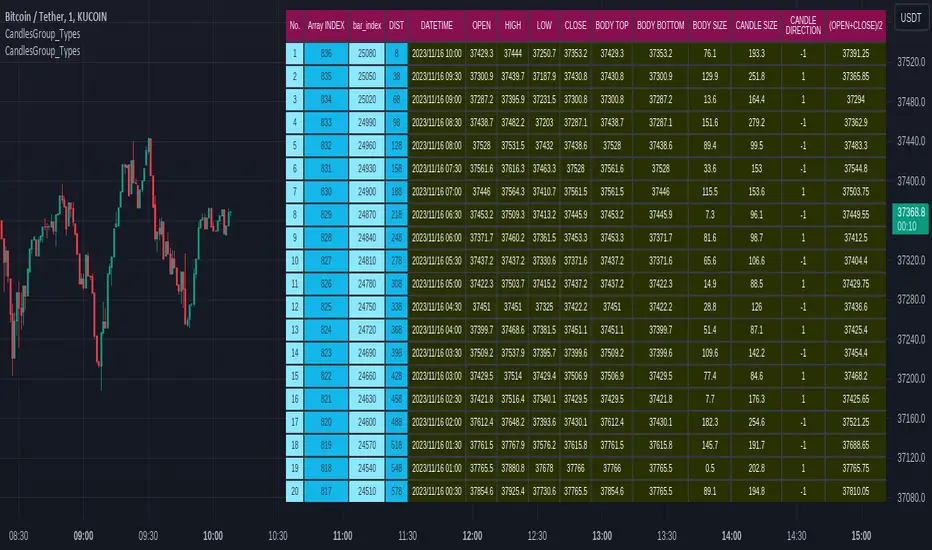
CandlesGroup_TypesLibrary "CandlesGroup_Types"
CandlesGroup Type allows you to efficiently store and access properties of all the candles in your chart.
You can easily manipulate large datasets, work with multiple timeframes, or analyze multiple symbols simultaneously. By encapsulating the properties of each candle within a CandlesGroup object, you gain a convenient and organized way to handle complex candlestick patterns and data.
For usage instructions and detailed examples, please refer to the comments and examples provided in the source code.
method init(_self)
Namespace types: CandlesGroup
Parameters:
_self (CandlesGroup)
method init(_self, propertyNames)
Namespace types: CandlesGroup
Parameters:
_self (CandlesGroup)
propertyNames (string )
method get(_self, key)
get values array from a given property name
Namespace types: CandlesGroup
Parameters:
_self (CandlesGroup) : : CandlesGroup object
key (string) : : key name of selected property. Default is "index"
Returns: values array
method size(_self)
get size of values array. By default it equals to current bar_index
Namespace types: CandlesGroup
Parameters:
_self (CandlesGroup) : : CandlesGroup object
Returns: size of values array
method push(_self, key, value)
push single value to specific property
Namespace types: CandlesGroup
Parameters:
_self (CandlesGroup) : : CandlesGroup object
key (string) : : key name of selected property
value (float) : : property value
Returns: CandlesGroup object
method push(_self, arr)
Namespace types: CandlesGroup
Parameters:
_self (CandlesGroup)
arr (float )
method populate(_self, ohlc)
populate ohlc to CandlesGroup
Namespace types: CandlesGroup
Parameters:
_self (CandlesGroup) : : CandlesGroup object
ohlc (float ) : : array of ohlc
Returns: CandlesGroup object
method populate(_self, values, propertiesNames)
populate values base on given properties Names
Namespace types: CandlesGroup
Parameters:
_self (CandlesGroup) : : CandlesGroup object
values (float ) : : array of property values
propertiesNames (string ) : : an array stores property names. Use as keys to get values
Returns: CandlesGroup object
method populate(_self)
populate values (default setup)
Namespace types: CandlesGroup
Parameters:
_self (CandlesGroup) : : CandlesGroup object
Returns: CandlesGroup object
method lookback(arr, bars_lookback)
get property value on previous candles. For current candle, use *.lookback()
Namespace types: float
Parameters:
arr (float ) : : array of selected property values
bars_lookback (int) : : number of candles lookback. 0 = current candle. Default is 0
Returns: single property value
method highest_within_bars(_self, hiSource, start, end, useIndex)
get the highest property value between specific candles
Namespace types: CandlesGroup
Parameters:
_self (CandlesGroup) : : CandlesGroup object
hiSource (string) : : key name of selected property
start (int) : : start bar for calculation. Default is candles lookback value from current candle. 'index' value is used if 'useIndex' = true
end (int) : : end bar for calculation. Default is candles lookback value from current candle. 'index' value is used if 'useIndex' = true. Default is 0
useIndex (bool) : : use index instead of lookback value. Default = false
Returns: the highest value within candles
method highest_within_bars(_self, returnWithIndex, hiSource, start, end, useIndex)
get the highest property value and bar index between specific candles
Namespace types: CandlesGroup
Parameters:
_self (CandlesGroup) : : CandlesGroup object
returnWithIndex (bool) : : the function only applicable when it is true
hiSource (string) : : key name of selected property
start (int) : : start bar for calculation. Default is candles lookback value from current candle. 'index' value is used if 'useIndex' = true
end (int) : : end bar for calculation. Default is candles lookback value from current candle. 'index' value is used if 'useIndex' = true. Default is 0
useIndex (bool) : : use index instead of lookback value. Default = false
Returns:
method highest_point_within_bars(_self, hiSource, start, end, useIndex)
get a Point object which contains highest property value between specific candles
Namespace types: CandlesGroup
Parameters:
_self (CandlesGroup) : : CandlesGroup object
hiSource (string) : : key name of selected property
start (int) : : start bar for calculation. Default is candles lookback value from current candle. 'index' value is used if 'useIndex' = true
end (int) : : end bar for calculation. Default is candles lookback value from current candle. 'index' value is used if 'useIndex' = true. Default is 0
useIndex (bool) : : use index instead of lookback value. Default = false
Returns: Point object contains highest property value
method lowest_within_bars(_self, loSource, start, end, useIndex)
get the lowest property value between specific candles
Namespace types: CandlesGroup
Parameters:
_self (CandlesGroup) : : CandlesGroup object
loSource (string) : : key name of selected property
start (int) : : start bar for calculation. Default is candles lookback value from current candle. 'index' value is used if 'useIndex' = true
end (int) : : end bar for calculation. Default is candles lookback value from current candle. 'index' value is used if 'useIndex' = true. Default is 0
useIndex (bool) : : use index instead of lookback value. Default = false
Returns: the lowest value within candles
method lowest_within_bars(_self, returnWithIndex, loSource, start, end, useIndex)
get the lowest property value and bar index between specific candles
Namespace types: CandlesGroup
Parameters:
_self (CandlesGroup) : : CandlesGroup object
returnWithIndex (bool) : : the function only applicable when it is true
loSource (string) : : key name of selected property
start (int) : : start bar for calculation. Default is candles lookback value from current candle. 'index' value is used if 'useIndex' = true
end (int) : : end bar for calculation. Default is candles lookback value from current candle. 'index' value is used if 'useIndex' = true. Default is 0
useIndex (bool) : : use index instead of lookback value. Default = false
Returns:
method lowest_point_within_bars(_self, loSource, start, end, useIndex)
get a Point object which contains lowest property value between specific candles
Namespace types: CandlesGroup
Parameters:
_self (CandlesGroup) : : CandlesGroup object
loSource (string) : : key name of selected property
start (int) : : start bar for calculation. Default is candles lookback value from current candle. 'index' value is used if 'useIndex' = true
end (int) : : end bar for calculation. Default is candles lookback value from current candle. 'index' value is used if 'useIndex' = true. Default is 0
useIndex (bool) : : use index instead of lookback value. Default = false
Returns: Point object contains lowest property value
method time2bar(_self, t)
Convert UNIX time to bar index of active chart
Namespace types: CandlesGroup
Parameters:
_self (CandlesGroup) : : CandlesGroup object
t (int) : : UNIX time
Returns: bar index
method time2bar(_self, timezone, YYYY, MMM, DD, hh, mm, ss)
Convert timestamp to bar index of active chart. User defined timezone required
Namespace types: CandlesGroup
Parameters:
_self (CandlesGroup) : : CandlesGroup object
timezone (string) : : User defined timezone
YYYY (int) : : Year
MMM (int) : : Month
DD (int) : : Day
hh (int) : : Hour. Default is 0
mm (int) : : Minute. Default is 0
ss (int) : : Second. Default is 0
Returns: bar index
method time2bar(_self, YYYY, MMM, DD, hh, mm, ss)
Convert timestamp to bar index of active chart
Namespace types: CandlesGroup
Parameters:
_self (CandlesGroup) : : CandlesGroup object
YYYY (int) : : Year
MMM (int) : : Month
DD (int) : : Day
hh (int) : : Hour. Default is 0
mm (int) : : Minute. Default is 0
ss (int) : : Second. Default is 0
Returns: bar index
method get_prop_from_time(_self, key, t)
get single property value from UNIX time
Namespace types: CandlesGroup
Parameters:
_self (CandlesGroup) : : CandlesGroup object
key (string) : : key name of selected property
t (int) : : UNIX time
Returns: single property value
method get_prop_from_time(_self, key, timezone, YYYY, MMM, DD, hh, mm, ss)
get single property value from timestamp. User defined timezone required
Namespace types: CandlesGroup
Parameters:
_self (CandlesGroup) : : CandlesGroup object
key (string) : : key name of selected property
timezone (string) : : User defined timezone
YYYY (int) : : Year
MMM (int) : : Month
DD (int) : : Day
hh (int) : : Hour. Default is 0
mm (int) : : Minute. Default is 0
ss (int) : : Second. Default is 0
Returns: single property value
method get_prop_from_time(_self, key, YYYY, MMM, DD, hh, mm, ss)
get single property value from timestamp
Namespace types: CandlesGroup
Parameters:
_self (CandlesGroup) : : CandlesGroup object
key (string) : : key name of selected property
YYYY (int) : : Year
MMM (int) : : Month
DD (int) : : Day
hh (int) : : Hour. Default is 0
mm (int) : : Minute. Default is 0
ss (int) : : Second. Default is 0
Returns: single property value
method bar2time(_self, index)
Convert bar index of active chart to UNIX time
Namespace types: CandlesGroup
Parameters:
_self (CandlesGroup) : : CandlesGroup object
index (int) : : bar index
Returns: UNIX time
Point
A point on chart
Fields:
price (series float) : : price value
bar (series int) : : bar index
bartime (series int) : : time in UNIX format of bar
Property
Property object which contains values of all candles
Fields:
name (series string) : : name of property
values (float ) : : an array stores values of all candles. Size of array = bar_index
CandlesGroup
Candles Group object which contains properties of all candles
Fields:
propertyNames (string ) : : an array stores property names. Use as keys to get values
properties (Property ) : : array of Property objects
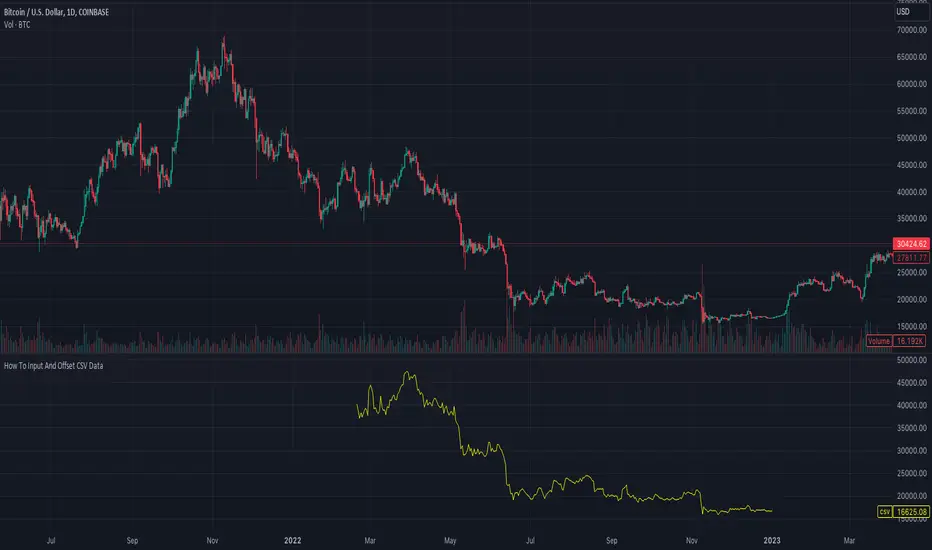
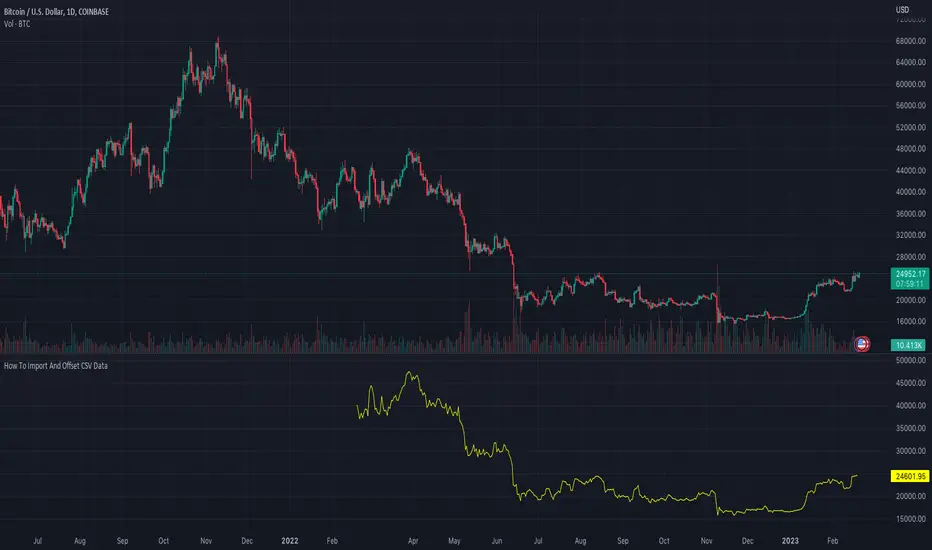
How To Input And Offset CSV DataExample method of how to use an input text area to import, offset, and plot CSV data using an array. Note that when using this method there is a limit of 4096 total characters per input.
For working with data sets larger than 4096 total characters an alternative method of pasting CSV data directly within the script can be seen below :
NOTICE: This is an example script and not meant to be used as an actual strategy. By using this script or any portion thereof, you acknowledge that you have read and understood that this is for research purposes only and I am not responsible for any financial losses you may incur by using this script!
TooltipLibrary "Tooltip"
This library helps creating and managing nice looking data (key/value) tooltips that you can use for
labels. The tooltips data key/value will align automatically. It is optional to convert the data to a values only string too.
method addSpacesToKey(this)
Calculates the amount of spaces needed after the key to make it the key least 4 characters wide.
Namespace types: Data
Parameters:
this (Data) : (Data) The Data.
method addTabs(this, longestKeyLength)
Calculates the amount of tabs to be used.
Namespace types: Data
Parameters:
this (Data) : (Data) The Data.
longestKeyLength (int)
method longestKeyLength(this)
Returns the length of the longest key string in the array.
Namespace types: Data
Parameters:
this (Data ) : (Tooltip) The object to work with.
@return (int) The length of the key.
method toString(tooltips, withKey)
Helper function for the tooltip.
Namespace types: Data
Parameters:
tooltips (Data )
withKey (bool) : (bool) Wether to create a string with keys in it.
@return (string) The string
new()
Creates a new array to store tooltip data in
@return (Data) The data array.
Data
Key/Value pair for tooltips
Fields:
key (series string)
value (series string)
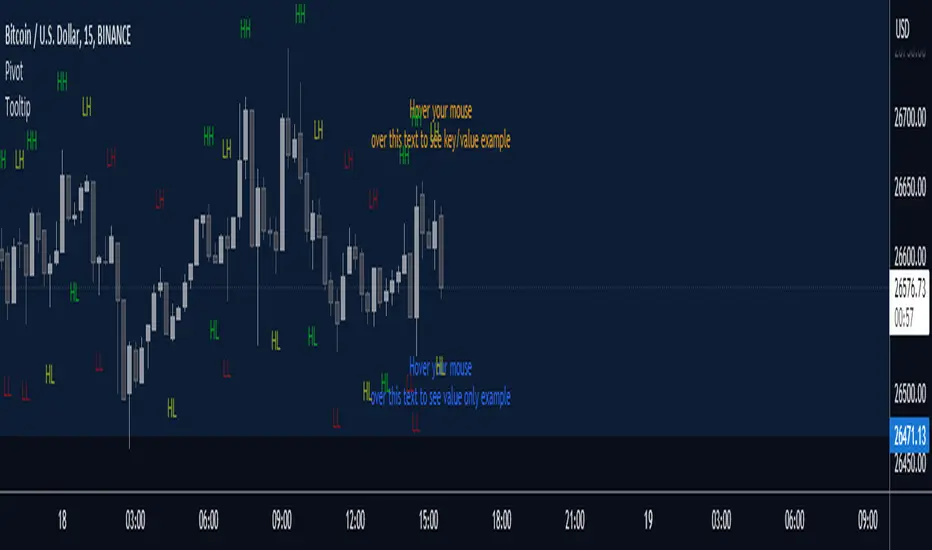
.print()
You don't need to initialize anything..
After you import the library you can use .print() as easy as that..!
Hope this helps
* use a unique ID for each .print() call
let me know if you run into any bugs
by trying to make it as user friendly as possible i had to do
some not ideal things so there's a chance it could present some bugs with
a lot of labels present on the chart
and if you use label.all to parse and manipulate the labels on the chart..
most likely it will cause an issue but not a lot of people use this so
I don't think that will be a problem.
thanks,
FFriZz | frizlabz
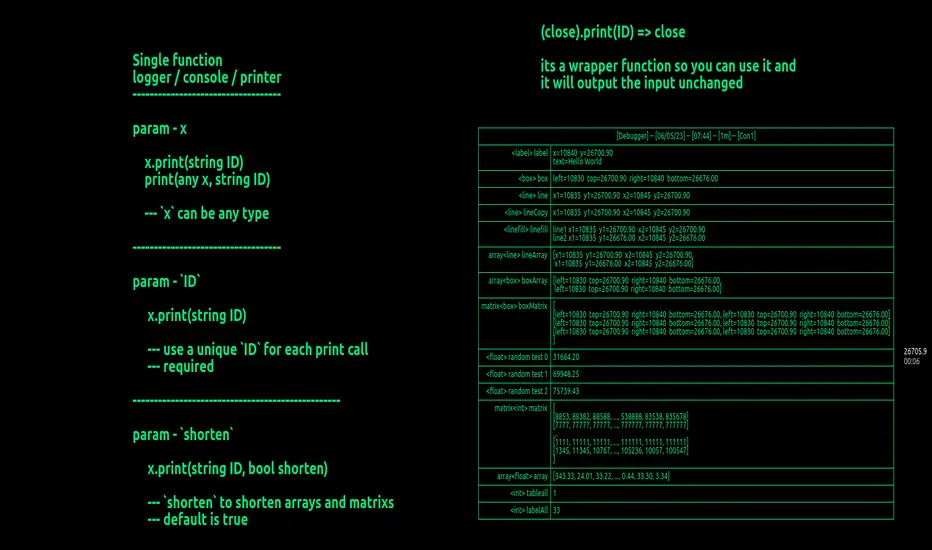
Library "print"
Single function to print any type to console
method str(inp)
`method` convert all types to string
```
(overload)
*.str(any inp) => string
```
Namespace types: series string, simple string, input string, const string
Parameters:
inp (string) : `any` - desc | Required
Returns: `string` formatted string
method str(inp)
Namespace types: series int, simple int, input int, const int
Parameters:
inp (int)
method str(inp)
Namespace types: series float, simple float, input float, const float
Parameters:
inp (float)
method str(inp)
Namespace types: series bool, simple bool, input bool, const bool
Parameters:
inp (bool)
method str(inp)
Namespace types: series linefill
Parameters:
inp (linefill)
method str(inp)
Namespace types: series line
Parameters:
inp (line)
method str(inp)
Namespace types: series box
Parameters:
inp (box)
method str(inp)
Namespace types: series label
Parameters:
inp (label)
method str(inp)
Namespace types: matrix
Parameters:
inp (matrix)
method str(inp)
Namespace types: matrix
Parameters:
inp (matrix)
method str(inp)
Namespace types: matrix
Parameters:
inp (matrix)
method str(inp)
Namespace types: matrix
Parameters:
inp (matrix)
method str(inp)
Namespace types: matrix
Parameters:
inp (matrix)
method str(inp)
Namespace types: matrix
Parameters:
inp (matrix)
method str(inp)
Namespace types: matrix
Parameters:
inp (matrix)
method str(inp)
Namespace types: matrix
Parameters:
inp (matrix)
method str(inp)
Namespace types: linefill
Parameters:
inp (linefill )
method str(inp)
Namespace types: line
Parameters:
inp (line )
method str(inp)
Namespace types: box
Parameters:
inp (box )
method str(inp)
Namespace types: label
Parameters:
inp (label )
method str(inp)
Namespace types: string
Parameters:
inp (string )
method str(inp)
Namespace types: int
Parameters:
inp (int )
method str(inp)
Namespace types: float
Parameters:
inp (float )
method str(inp)
Namespace types: bool
Parameters:
inp (bool )
method arrayShorten(str)
arrayShorten
Namespace types: series string, simple string, input string, const string
Parameters:
str (string) : `string` - the string to shorten | Required
Returns: `string` - a shortened version of the input string if it is an array with more than 7 elements, otherwise the original string
method matrixShorten(str)
matrixShorten
Namespace types: series string, simple string, input string, const string
Parameters:
str (string) : `string` - the string to shorten | Required
Returns: `string` - the shortened matrix string if the input is a matrix, otherwise returns the input string as is
method print(x, ID)
print all types to theh same console with just this `method/function`
```
(overload)
*.print(any x, string ID, bool shorten=true?) => console
"param 'shorten' - only for arrays and matrixs" | true
```
Namespace types: series string, simple string, input string, const string
Parameters:
x (string) : - `any` input to convert
ID (string) : - `string` unique id for label on console `MUST BE UNIQUE`
Returns: adds the `ID` and the `inp` to the console on the chart
method print(x, ID)
Namespace types: series float, simple float, input float, const float
Parameters:
x (float)
ID (string)
method print(x, ID)
Namespace types: series int, simple int, input int, const int
Parameters:
x (int)
ID (string)
method print(x, ID)
Namespace types: series box
Parameters:
x (box)
ID (string)
method print(x, ID)
Namespace types: series bool, simple bool, input bool, const bool
Parameters:
x (bool)
ID (string)
method print(x, ID)
Namespace types: series label
Parameters:
x (label)
ID (string)
method print(x, ID)
Namespace types: series line
Parameters:
x (line)
ID (string)
method print(x, ID)
Namespace types: series linefill
Parameters:
x (linefill)
ID (string)
method print(x, ID, shorten)
Namespace types: string
Parameters:
x (string )
ID (string)
shorten (bool)
method print(x, ID, shorten)
Namespace types: float
Parameters:
x (float )
ID (string)
shorten (bool)
method print(x, ID, shorten)
Namespace types: int
Parameters:
x (int )
ID (string)
shorten (bool)
method print(x, ID, shorten)
Namespace types: box
Parameters:
x (box )
ID (string)
shorten (bool)
method print(x, ID, shorten)
Namespace types: bool
Parameters:
x (bool )
ID (string)
shorten (bool)
method print(x, ID, shorten)
Namespace types: label
Parameters:
x (label )
ID (string)
shorten (bool)
method print(x, ID, shorten)
Namespace types: line
Parameters:
x (line )
ID (string)
shorten (bool)
method print(x, ID, shorten)
Namespace types: linefill
Parameters:
x (linefill )
ID (string)
shorten (bool)
method print(x, ID, shorten)
Namespace types: matrix
Parameters:
x (matrix)
ID (string)
shorten (bool)
method print(x, ID, shorten)
Namespace types: matrix
Parameters:
x (matrix)
ID (string)
shorten (bool)
method print(x, ID, shorten)
Namespace types: matrix
Parameters:
x (matrix)
ID (string)
shorten (bool)
method print(x, ID, shorten)
Namespace types: matrix
Parameters:
x (matrix)
ID (string)
shorten (bool)
method print(x, ID, shorten)
Namespace types: matrix
Parameters:
x (matrix)
ID (string)
shorten (bool)
method print(x, ID, shorten)
Namespace types: matrix
Parameters:
x (matrix)
ID (string)
shorten (bool)
method print(x, ID, shorten)
Namespace types: matrix
Parameters:
x (matrix)
ID (string)
shorten (bool)
method print(x, ID, shorten)
Namespace types: matrix
Parameters:
x (matrix)
ID (string)
shorten (bool)
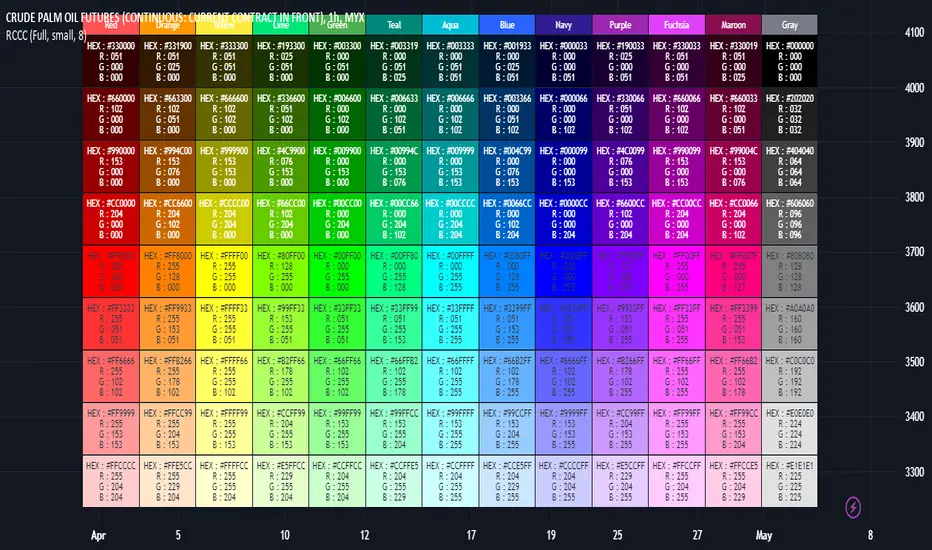
RGB Color Codes Chart█ OVERVIEW
This indicator is an educational indicator to make pine coders easier to input color code.
Color code displayed either in hex or rgb code or both.
█ INSPIRATIONS
RGB Color Codes Chart
Table Color For Pairing Black And White
█ FEATURES
Hover table cell to see all properties of color such as Hex code and RGB code via tooltip.
Cell can be show either Full, HEX, RGB, R, G, B or na.
█ LIMITATION
This code does not consider usage of color.new()
█ CONSIDERATION
Code consideration to be used such as color.r(), color.g(), color.b() and color.rgb()
█ EXAMPLE OF USAGE / EXPLAINATION
toolsLibrary "tools"
A library of many helper methods, plus a comprehensive print method and a printer object.
This is a newer version of the helpers library. This script uses pinescripts v5 latest objects and methods.

Zigzag Array ExperimentalThis is experimental script for zigzag which uses type, method and array. Not recommend for actual usage, for pine script study maybe useful.
In this experiment, I use type as coded below. It seems have limitation as specially when push as array. As Trading View recommendation, pushing float and int into array especially for type not guarantee to work. I agree with that. Preferred to push array as line or label especially for types.
// @type Used for point especially for array
// @field x int value for bar_index
// @field y float value for price
// @field sty label style
// @field col color for text label
// @field str high or low string
type point
int x = na
float y = na
string sty = na
color col = na
string str = na
I simulate the arrays as below.
var dirLine = array.new()
var dirLabel = array.new()
var dirPoint = array.new()
....
dirPoint.unshift(zigzag.createPoint(0))
dirLabel.unshift(zigzag.createLabel(fontSize, 0, true))
dirLine.unshift(zigzag.createLine(width, switchLine, 0, true))
Here are some results.

Vector2ArrayLibrary "Vector2Array"
functions to handle vector2 Array operations.
.
references:
docs.unity3d.com
gist.github.com
github.com
gist.github.com
gist.github.com
gist.github.com
.
from(source, prop_sep, vect_sep)
Generate array of vector2 from string.
Parameters:
source : string Source string of the vectors.
prop_sep : string Separator character of the vector properties (x`,`y).
vect_sep : string Separator character of the vectors ((x,y)`;`(x,y)).
Returns: array.
max(vectors)
Combination of the highest elements in column of a array of vectors.
Parameters:
vectors : array, Array of Vector2 objects.
Returns: Vector2.Vector2, Vector2 object.
-> usage:
`a = Vector2.from(1.0) , b = Vector2.from(2.0), c = Vector2.from(3.0), d = max(array.from(a, b, c)) , plot(d.x)`
min(vectors)
Combination of the lowest elements in column of a array of vectors.
Parameters:
vectors : array, Array of Vector2 objects.
Returns: Vector2.Vector2, Vector2 object.
-> usage:
`a = Vector2.from(1.0) , b = Vector2.from(2.0), c = Vector2.from(3.0), d = min(array.from(a, b, c)) , plot(d.x)`
sum(vectors)
Total sum of all vectors.
Parameters:
vectors : array, ID of the vector2 array.
Returns: Vector2.Vector2, vector2 object.
-> usage:
`a = Vector2.from(1.0) , b = Vector2.from(2.0), c = Vector2.from(3.0), d = sum(array.from(a, b, c)) , plot(d.x)`
center(vectors)
Finds the vector center of the array.
Parameters:
vectors : array, ID of the vector2 array.
Returns: Vector2.Vector2, vector2 object.
-> usage:
`a = Vector2.from(1.0) , b = Vector2.from(2.0), c = Vector2.from(3.0), d = center(array.from(a, b, c)) , plot(d.x)`
rotate(vectors, center, degree)
Rotate Array vectors around origin vector by a angle.
Parameters:
vectors : array, ID of the vector2 array.
center : Vector2.Vector2 , Vector2 object. Center of the rotation.
degree : float , Angle value.
Returns: rotated points array.
-> usage:
`a = Vector2.from(1.0) , b = Vector2.from(2.0), c = Vector2.from(3.0), d = rotate(array.from(a, b, c), b, 45.0)`
scale(vectors, center, rate)
Scale Array vectors based on a origin vector perspective.
Parameters:
vectors : array, ID of the vector2 array.
center : Vector2.Vector2 , Vector2 object. Origin center of the transformation.
rate : float , Rate to apply transformation.
Returns: rotated points array.
-> usage:
`a = Vector2.from(1.0) , b = Vector2.from(2.0), c = Vector2.from(3.0), d = scale(array.from(a, b, c), b, 1.25)`
move(vectors, center, rate)
Move Array vectors by a rate of the distance to center position (LERP).
Parameters:
vectors : array, ID of the vector2 array.
center
rate
Returns: Moved points array.
-> usage:
`a = Vector2.from(1.0) , b = Vector2.from(2.0), c = Vector2.from(3.0), d = move(array.from(a, b, c), b, 1.25)`
to_string(id, separator)
Reads a array of vectors into a string, of the form ` `.
Parameters:
id : array, ID of the vector2 array.
separator : string separator for cell splitting.
Returns: string Translated complex array into string.
-> usage:
`a = Vector2.from(1.0) , b = Vector2.from(2.0), c = Vector2.from(3.0), d = to_string(array.from(a, b, c))`
to_string(id, format, separator)
Reads a array of vectors into a string, of the form ` `.
Parameters:
id : array, ID of the vector2 array.
format : string , Format to apply transformation.
separator : string , Separator for cell splitting.
Returns: string Translated complex array into string.
-> usage:
`a = Vector2.from(1.234) , b = Vector2.from(2.23), c = Vector2.from(3.1234), d = to_string(array.from(a, b, c), "#.##")`

How To Import And Offset CSV DataExample method of how to import, offset, and plot CSV data using an array.
NOTICE: This is an example script and not meant to be used as an actual strategy. By using this script or any portion thereof, you acknowledge that you have read and understood that this is for research purposes only and I am not responsible for any financial losses you may incur by using this script!
Simple Zigzag UDT█ OVERVIEW
This indicator displays zigzag based on high and low, which is using user-defined types (UDT) or objects .
█ CREDITS
LonesomeTheBlue
█ FEATURES
1. Label can be resized.
2. Label can be display either short (Eg : HH, LL, H, L, etc) and long (Eg : Higher Low, etc)
3. Color can be customized either contrast color of chart background, trend color or customized color.
█ EXAMPLES / USAGES

PSv5 3D Array/Matrix Super Hack"In a world of ever pervasive and universal deceit, telling a simple truth is considered a revolutionary act."
INTRO:
First, how about a little bit of philosophic poetry with another dimension applied to it?
The "matrix of control" is everywhere...
It is all around us, even now in the very place you reside. You can see it when you look at your digitized window outwards into the world, or when you turn on regularly scheduled television "programs" to watch news narratives and movies that subliminally influence your thoughts, feelings, and emotions. You have felt it every time you have clocked into dead end job workplaces... when you unknowingly worshiped on the conformancy alter to cultish ideologies... and when you pay your taxes to a godvernment that is poisoning you softly and quietly by injecting your mind and body with (psyOps + toxicCompounds). It is a fictitiously generated world view that has been pulled over your eyes to blindfold, censor, and mentally prostrate you from spiritually hearing the real truth.
What TRUTH you must wonder? That you are cognitively enslaved, like everyone else. You were born into mental bondage, born into an illusory societal prison complex that you are entirely incapable of smelling, tasting, or touching. Its a contrived monetary prison enterprise for your mind and eternal soul, built by pretending politicians, corporate CONartists, and NonGoverning parasitic Organizations deploying any means of infiltration and deception by using every tactic unimaginable. You are slowly being convinced into becoming a genetically altered cyborg by acclimation, socially engineered and chipped to eventually no longer be 100% human.
Unfortunately no one can be told eloquently enough in words what the matrix of control truly is. You have to experience it and witness it for yourself. This is your chance to program a future paradigm that doesn't yet exist. After visiting here, there is absolutely no turning back. You can continually take the blue pill BIGpharmacide wants you to repeatedly intake. The story ends if you continually sleep walk through a 2D hologram life, believing whatever you wish to believe until you cease to exist. OR, you can take the red pill challenge, explore "question every single thing" wonderland, program your arse off with 3D capabilities, ultimately ascertaining a new mathematical empyrean. Only then can you fully awaken to discover how deep the rabbit hole state of affairs transpire worldwide with a genuine open mind.
Remember, all I'm offering is a mathematical truth, nothing more...
PURPOSE:
With that being said above, it is now time for advanced developers to start creating their own matrix constructs in 3D, in Pine, just as the universe is created spatially. For those of you who instantly know what this script's potential is easily capable of, you already know what you have to do with it. While this is simplistically just a 3D array for either integers or floats, additional companion functions can in the future be constructed by other members to provide a more complete matrix/array library for millions of folks on TV. I do encourage the most courageous of mathemagicians on TV to do so. I have been employing very large 2D/3D array structures for quite some time, and their utility seems to be of great benefit. Discovering that for myself, I fully realized that Pine is incomplete and must be provided with this agility to process complex datasets that traders WILL use in the future. Mark my words!
CONCEPTION:
While I have long realized and theorized this code for a great duration of time, I was finally able to turn it into a Pine reality with the assistance and training of an "artificially intuitive" program while probing its aptitude. Even though it knows virtually nothing about Pine Script 4.0 or 5.0 syntax, functions, and behavior, I was able to conjure code into an identity similar to what you see now within a few minutes. Close enough for me! Many manual edits later for pine compliance, and I had it in chart, presto!
While most people consider the service to be an "AI", it didn't pass my Pine Turing test. I did have to repeatedly correct it, suffered through numerous apologies from it, was forced to use specifically tailored words, and also rationally debate AND argued with it. It is a handy helper but beware of generating Pine code from it, trust me on this one. However... this artificially intuitive service is currently available in its infancy as version 3. Version 4 most likely will have more diversity to enhance my algorithmic expertise of Pine wizardry. I do have to thank E.M. and his developers for an eye opening experience, or NONE of this code below would be available as you now witness it today.
LIMITATIONS:
As of this initial release, Pine only supports 100,000 array elements maximum. For example, when using this code, a 50x50x40 element configuration will exceed this limit, but 50x50x39 will work. You will always have to keep that in mind during development. Running that size of an array structure on every single bar will most likely time out within 20-40 seconds. This is not the most efficient method compared to a real native 3D array in action. Ehlers adepts, this might not be 100% of what you require to "move forward". You can try, but head room with a low ceiling currently will be challenging to walk in for now, even with extremely optimized Pine code.
A few common functions are provided, but this can be extended extensively later if you choose to undertake that endeavor. Use the code as is and/or however you deem necessary. Any TV member is granted absolute freedom to do what they wish as they please. I ultimately wish to eventually see a fully equipped library version for both matrix3D AND array3D created by collaborative efforts that will probably require many Pine poets testing collectively. This is just a bare bones prototype until that day arrives. Considerably more computational server power will be required also. Anyways, I hope you shall find this code somewhat useful.
Notice: Unfortunately, I will not provide any integration support into members projects at all. I have my own projects that require too much of my time already.
POTENTIAL APPLICATIONS:
The creation of very large coefficient 3D caches/buffers specifically at bar_index==0 can dramatically increase runtime agility for thousands of bars onwards. Generating 1000s of values once and just accessing those generated values is much faster. Also, when running dozens of algorithms simultaneously, a record of performance statistics can be kept, self-analyzed, and visually presented to the developer/user. And, everything else under the sun can be created beyond a developers wildest dreams...
EPILOGUE:
Free your mind!!! And unleash weapons of mass financial creation upon the earth for all to utilize via the "Power of Pine". Flying monkeys and minions are waging economic sabotage upon humanity, decimating markets and exchanges. You can always see it your market charts when things go horribly wrong. This is going to be an astronomical technical challenge to continually navigate very choppy financial markets that are increasingly becoming more and more unstable and volatile. Ordinary one plot algorithms simply are not enough anymore. Statistics and analysis sits above everything imagined. This includes banking, godvernment, corporations, REAL science, technology, health, medicine, transportation, energy, food, etc... We have a unique perspective of the world that most people will never get to see, depending on where you look. With an ever increasingly complex world in constant dynamic flux, novel ways to process data intricately MUST emerge into existence in order to tackle phenomenal tasks required in the future. Achieving data analysis in 3D forms is just one lonely step of many more to come.
At this time the WesternEconomicFraudsters and the WorldHealthOrders are attempting to destroy/reset the world's financial status in order to rain in chaos upon most nations, causing asset devaluation and hyper-inflation. Every form of deception, infiltration, and theft is occurring with a result of destroyed wealth in preparation to consolidate it. Open discussions, available to the public, by world leaders/moguls are fantasizing about new dystopian system as a one size fits all nations solution of digitalID combined with programmableDemonicCurrencies to usher in a new form of obedient servitude to a unipolar digitized hegemony of monetary vampires. If they do succeed with economic conquest, as they have publicly stated, people will be converted into human cattle, herded within smart cities, you will own nothing, eat bugs for breakfast/lunch/dinner, live without heat during severe winter conditions, and be happy. They clearly haven't done the math, as they are far outnumbered by a ratio of 1 to millions. Sith Lords do not own planet Earth! The new world disorder of human exploitation will FAIL. History, my "greatest teacher" for decades reminds us over, and over, and over again, and what are time series for anyways? They are for an intense mathematical analysis of prior historical values/conditions in relation to today's values/conditions... I imagine one day we will be able to ask an all-seeing AI, "WHO IS TO BLAME AND WHY AND WHEN?" comprised of 300 pages in great detail with images, charts, and statistics.
What are the true costs of malignant lies? I will tell you... 64bit numbers are NOT even capable of calculating the extreme cost of pernicious lies and deceit. That's how gigantic this monstrous globalization problem has become and how awful the "matrix of control" truly is now. ALL nations need a monumental revision of its CODE OF ETHICS, and that's definitely a multi-dimensional problem that needs solved sooner than later. If it was up to me, economies and technology would be developed so extensively to eliminate scarcity and increase the standard of living so high, that the notion of war and conflict would be considered irrelevant and extremely appalling to the future generations of humanity, our grandchildren born and unborn. The future will not be owned and operated by geriatric robber barons destined to expire quickly. The future will most likely be intensely "guided" by intelligent open source algorithms that youthful generations will inherit as their birth right.
P.S. Don't give me that politco-my-diction crap speech below in comments. If they weren't meddling with economics mucking up 100% of our chart results in 100% of tickers, I wouldn't have any cause to analyze any effects generated by them, nor provide this script's code. I am performing my analytical homework, but have you? Do you you know WHY international affairs are in dire jeopardy? Without why, the "Power of Pine" would have never existed as it specifically does today. I'm giving away much of my mental power generously to TV members so you are specifically empowered beyond most mathematical agilities commonly existing. I'm just a messenger of profound ideas. Loving and loathing of words is ALWAYS in the eye of beholders, and that's why the freedom of speech is enshrined as #1 in the constitutional code of the USA. Without it, this entire site might not have been allowed to exist from its founder's inceptions.
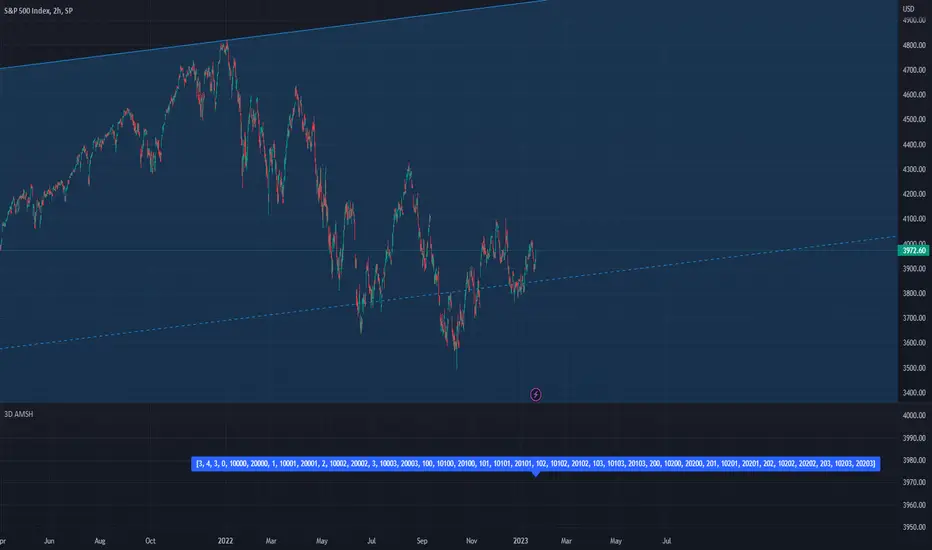
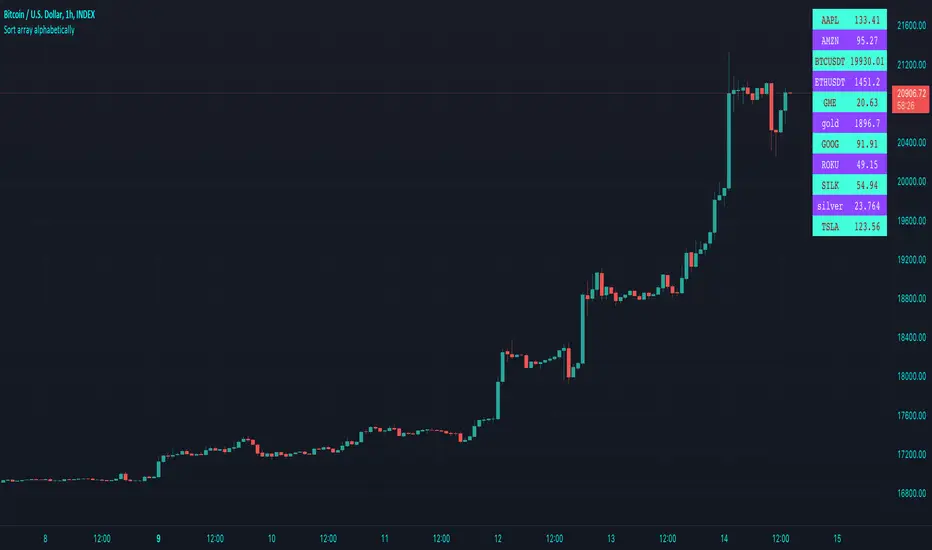
Sort array alphabetically - educational🔶 OVERVIEW
• This educational script will sort an array of tickers alphabetically and place these values in an table , together with the according current price value next to each ticker .
🔶 SORT ALPHABETICALLY
🔹 I. We make a User Defined Type (UDT) obj , with:
· ticker - the string name of the ticker
· price - the current price (close)
• From this UDT we make an object obj.new() for each ticker
🔹 II. 2 array's are made:
• array of objects aObj , containing obj type obj.new() for every ticker
• array of strings sort , the ticker part of each object obj.new()
🔹 III. Now we make an object of each ticker with the createObject(sym ) function
object_1 = createObject("TICKER")
• the object object_1 consists off:
· ticker -> "TICKER"
· price -> current Daily close through request.security("TICKER") (non-repainting)
• object_1 will be added to the aObj array
• "TICKER" ( string ticker part of object ) will be added to the sort array
🔹 IV. The latter array is sorted alphabetically by using array.sort_indices()
EXAMPLE
originalArray = array.from("B", "A", "C")
indicesArray = // sorted indices
array.get(originalArray, 1) -> "A"
array.get(originalArray, 0) -> "B"
array.get(originalArray, 2) -> "C"
IMPORTANT
Alphabetically sorting is case sensitive , just like Java compareTo(String anotherString) !
• The comparison is based on the Unicode value of each character in the string, the lowest "Dec" values are sorted first in line.
• Comparing the "Dec" values at unicodelookup explains why default CAPITAL lettres will be sorted first,
• Default you would get this (A= 65, B= 66, a= 97, b= 98)
Aa
Ba
ab
bb
• Adding str.lower(string) in the toLowerCase() function will result to the following:
Aa
ab
Ba
bb
• (A= 65 is transformed to a= 97, ...)
• As a side note, should you write "AMZN" as "ÀMZN" this would be placed at the end, even after transforming to lower case the "Dec" values are higher (À= 192, à= 224).
• You can toggle "To Lower Case" to verify.
🔹 V. Values are placed in a table , using these sorted indices.
• With the usage of UDTs and objects , the current price has the same index in the aObj as their ticker ,
giving the advantage it is fairly easy to place every value correctly next to each other.
• The same can be done by make 2 separate arrays , 1 for the current price , the other for "TICKER" .
🔶 OTHER TECHNIQUES USED
• Alternative technique for adding comment
Instead of
// this is a comment
You can also do this:
_=" this is a comment "
• Alternate colour
· During a loop , alternate colour when i is even or odd , using the modulo operation (%) .
· This is the remainder when dividing.
EXAMPLE
· 3 % 2 = 1 -> 3 / 2 -> 1 * 2, 1 left (remainder)
· 4 % 2 = 0 -> 4 / 2 -> 2 * 2, 0 left (remainder)
· 5 % 2 = 1 -> 5 / 2 -> 2 * 2, 1 left (remainder)
for i = 0 to 10
even = i % 2 == 0
col = even ? thisColor : otherColor
• Adjust colour in script by using colour picker
Cheers!
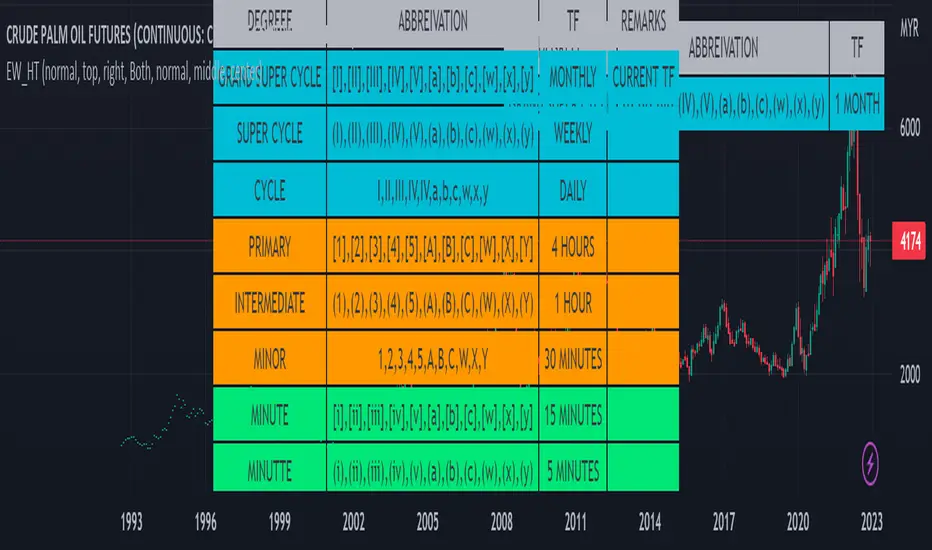
Elliot Wave Helper Table█ OVERVIEW
This indicator is intend to be helper to help Elliot Wave user to properly Elliot Wave tools according to correct degree such as 12345 or ABCWXY. The abbreviation changes according to timeframe.
█ FEATURES
1. Abbreviation degree adaptive to timeframe. Eg : Subminutte for 1 minute chart, etc.
2. Works for custom timeframe. Eg : Subminutte for 1 to 4 minute chart, etc.
3. Show reference table if necessary.
█ REFERENCE
Adaptive Elliot Wave Degree Chart
█ EXAMPLES / USAGES
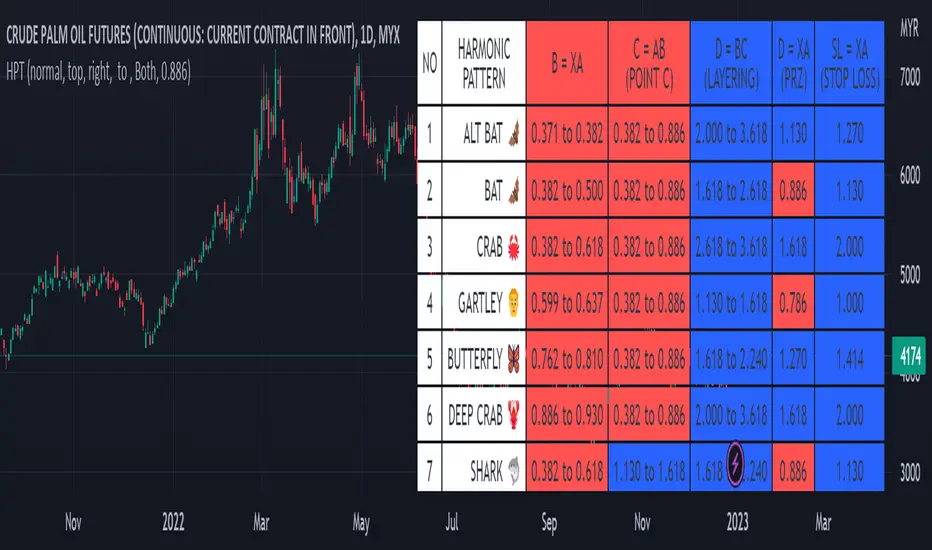
Harmonic Pattern Table UDT█ OVERVIEW
This table indicator was intended as helper / reference for using XABCD Pattern drawing tool.
The values shown in table was based on Harmonic Trading Volume 3: Reaction vs. Reversal written by Scott M Carney.
Code upgrade from Harmonic Pattern Table (Source Code) and based on latest User-Defined Type (UDT) .
As a result, code appeared more cleaner.
█ FEATURES
1. List Harmonic Patterns.
2. Font size small for mobile app and font size normal for desktop.
3. Options to show Animal name in text, emoji or both.
█ USAGE
Similar to Harmonic Pattern Table (Source Code).
█ CREDITS
Scott M Carney, Trading Volume 3: Reaction vs. Reversal
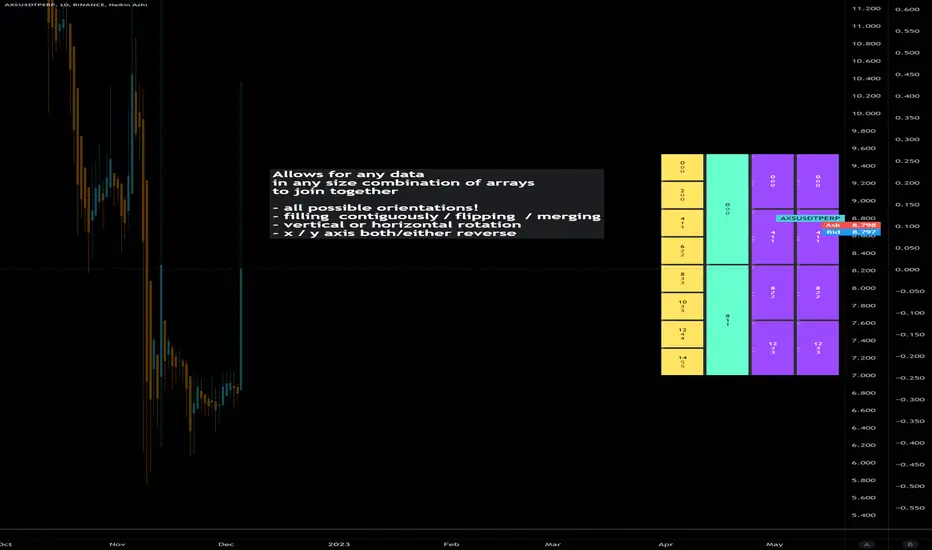
Dynamic Array Table (versatile display methods)Library "datTable"
Dynamic Array Table.... Configurable Shape/Size Table from Arrays
Allows for any data in any size combination of arrays to join together
with:
all possible orientations!
filling all cells contiguously and/or flipping at boundaries
vertical or horizontal rotation
x/y axis direction swapping
all types array inputs for data.
please notify of any bugs. thanks
init(_posit)
Get Table (otional gapping cells)
Parameters:
_posit : String or Int (1-9 3x3 grid L to R)
Returns: Table
coords()
Req'd coords Seperate for VARIP table, non-varip coords
add
Add arrays to display table. coords reset each calc
uses displaytable object, string titles, and color optional array, and second line optional data array.
fast_utilsLibrary "fast_utils"
This library contains my favourite functions. Will be updated frequently
count_int_digits()
Count int digits in number
Returns: : number of int digits in number
count_float_digits()
Count float digits in number
Returns: : number of float digits in number
stringify()
Convert values in array or matrix into string values
Returns: : array or matrix of string values
arrcompare()
Compare values in arrays
Returns: : bool value
arrdedup()
Remove duplicate values in array
Returns: : array without duplicates
ResInMins()
Converts current resolution in minutes
Returns: : return float number of minuted
MultOfRes(res, mult)
Convert current float TF in minutes to target string TF in "timeframe.period" format.
Parameters:
res : : current resolution in minutes
mult : : Multiple of current TF to be calculated.
Returns: : timeframe format string
