ToTitans - Williams Alligator with Life LineWhat Is It?
Legendary trader Bill Williams, an early pioneer of market psychology, developed the trend-following Alligator indicator, which follows the premise that financial markets and individual securities trend just 15% to 30% of the time while grinding through sideways ranges the other 70% to 85% of the time. Williams believed that individuals and institutions tend to collect most of their profits during strongly trending periods. You also can find more detail here www.investopedia.com
Differentiation
Add Fill the line as a cloud for easier chart interpretation / trend interpretation
Add EMA 5 (Life Line) for using with Going through the cloud and Exiting from the cloud
This indicator has been used in AJ Jim class for "Type 2" approach
Suitable for
Intra Day Trading (20m-2h)
TFEX:S501!
"PM me to obtain access"
Alligatör Göstergesi

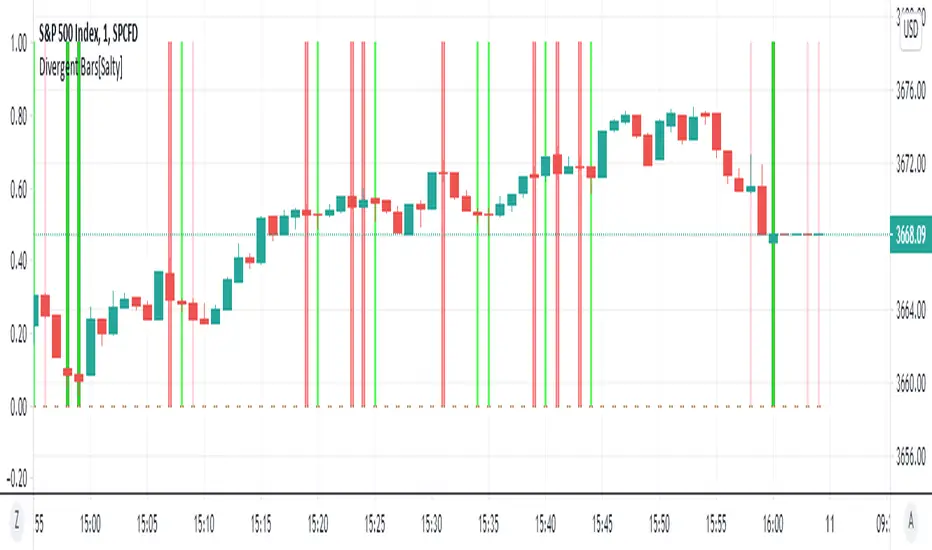
Divergent Bars[Salty]Updated an existing Divergent Bar script to be able to show all divergent bars. There are 2 set of divergent bars that can be turned on. The original one based on price and alligator lines, and a new second one that shows ALL divergent bars. The second set has lighter lines and colors to differentiate them from the filtered alligator divergent bars.
Multi StrategyDuring the course of a trade, we can find ourselves changing strategies depending on the market. Instead of using many different templates, I have a simple indicator that clearly says "Buy", "Sell" or "Stay Out". The great thing about this approach, is we instantly observe the majority are in agreement and that decides which way to place our trade.
This indicator includes the following strategies:
- QQE
- Ichimoku using much faster settings.
- Parabolic SAR
- Supertrend
- TTM Oscillator
- The Squeeze strategy
- The Alligator Strategy
Using this indicator is simple, if the lines are mainly green then buy, if mainly red then sell OR don't trade. So...
Green Line - This strategy is in a buy position
Orange or Black Line - This strategy is undecided
Red Line - This strategy is in a sell position
There are also some green and red circles for reference that appear showing when that bar has broken through the Ichimoku cloud.
The trader's approach is simple, when all indicators are green or red, then take the trade. As soon as one indicator changes, then re-evaluate using your normal process, such as price action, to determine whether to close the trade or continue.
I can customise this further or add other strategies, please message me.

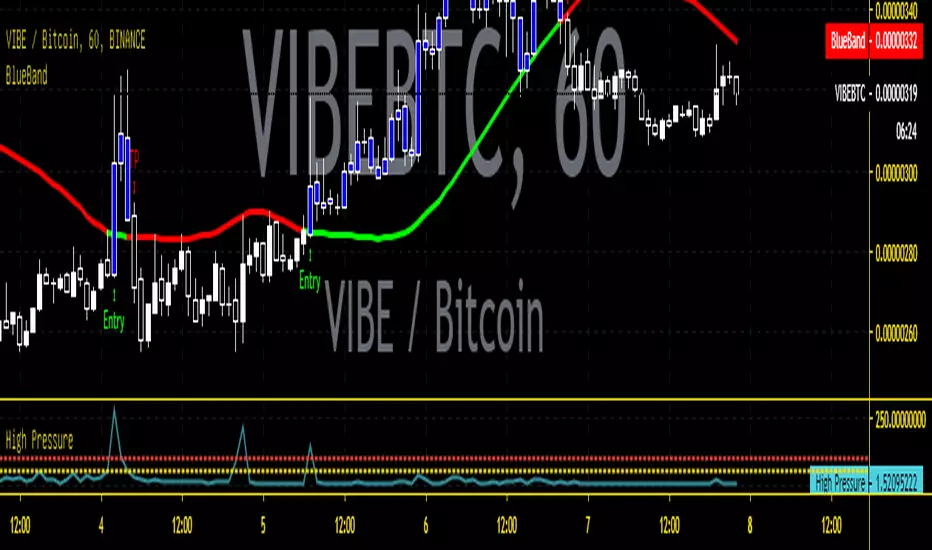
FX Social Entry FinderThis can be applied to Forex, Stocks and Crypto.
Understanding it
When the buy or sell signal align with the wave, it means the price is heading in the direction of alignment.
This indicator is intended to be used as a confirmation indicator for other algorithms for best result.
Indicators with specifically tested and chosen settings that have shown to work on a number of timeframes.
How to use on a buy
When you receive a buy signal if it's within the wave or above the wave, its an indication the market about to continue that direction. You could aim for 20-50 pips depending on the pair.
When to sell
When you receive a sell signal if it's within the wave or below the wave, its an indication the market about to continue that direction. You could aim for 20-50 pips depending on the pair.
When to exit
You can set our indicator to alert you when its a good time to exit the trade.
How to Access
Gain access to FX Social Entry Finder for your TradingView account by being a active member of FX Social.

Fibonacci RainbowThis indicator is inspired by Bill William's Alligator .
Taken 7 Fibonacci numbers, painted in the colors of the rainbow and highlighted when the rainbow fan is up or down.

Zenith BladeThis script is based heavily on "Support/Resistance Zones x3" by Lij_MC
What I did is went and added alerts for when price breakouts the support line/zone.
You have the options to change if it is based on a zone breakout or a line breakout
You also can choose when it will go off, so for example you want an alert to trigger only between 7am and 8am then you can change that in the menu.
Lastly you can choose whither or not to show the Williams Alligator on the chart as I have found it beneficial in conjunction with the script since its based primarily on fractals to calculate Support and Resistance.

CryptoEarnings Alligator EMAIt is very useful indicator to predict the market trend very fast. It works in all time frame but it is more useful in short time frame like 3 Min, 5 Min, 15 Min for intraday traders

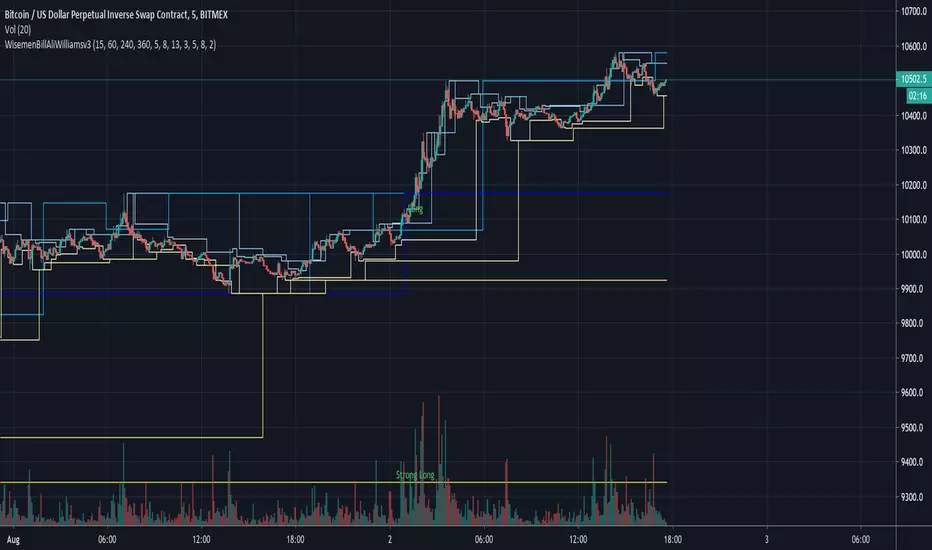
Wisemen Bill Ali Williams v3Use 2 timeframe:
Current timeframe + configurable timeframe (default: 6hours)
Get resistance & support for both timeframe.
Entry when breakout both resistance or both support
For donations
BTC: 3E7rUPX7upS8iTj42JdLt7keJVbJLfvMoH
ETH: 0x094ed88e4c5a9b225e936586cbc2d61f4a027f68
Thank you & happy trading!
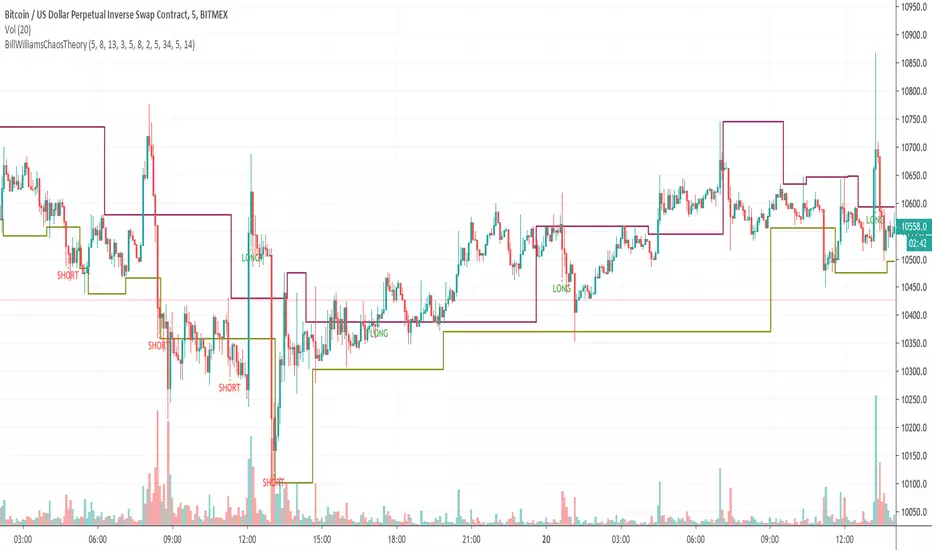
Bill Williams Chaos TheoryBill Williams Chaos Theory
- Alligator
- Fractals
- Accelerator Decelerator Oscillator
- Market Facilitation Index
Combining all of that to generate signal long or short.
Long entry when long signal appears.
Short entry when short signal appears.
For donations
BTC: 3E7rUPX7upS8iTj42JdLt7keJVbJLfvMoH
ETH: 0x094ed88e4c5a9b225e936586cbc2d61f4a027f68
Thank you & happy trading!

420_MA_3 (3 moving average + custom ma + alerts) Three Moving Average System with Alerts
Saw a friend post a 3 ma script recently and I don't think it had this much functionality.
much love
gl hf
xoxo
snoop

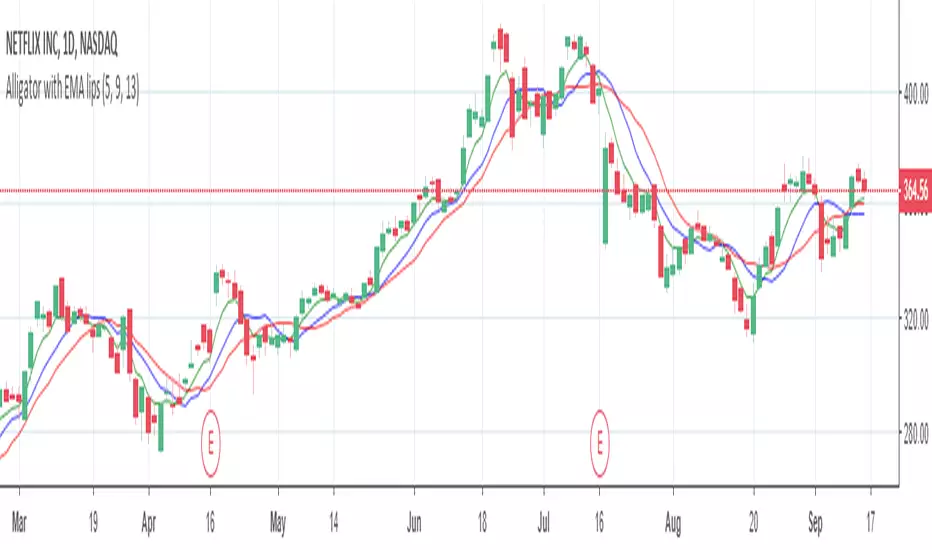
Alligator with EMA lipsI wanted Alligator but with lips, more sensitive to the latest data instead of the whole period. Made alligator with EMA lips.
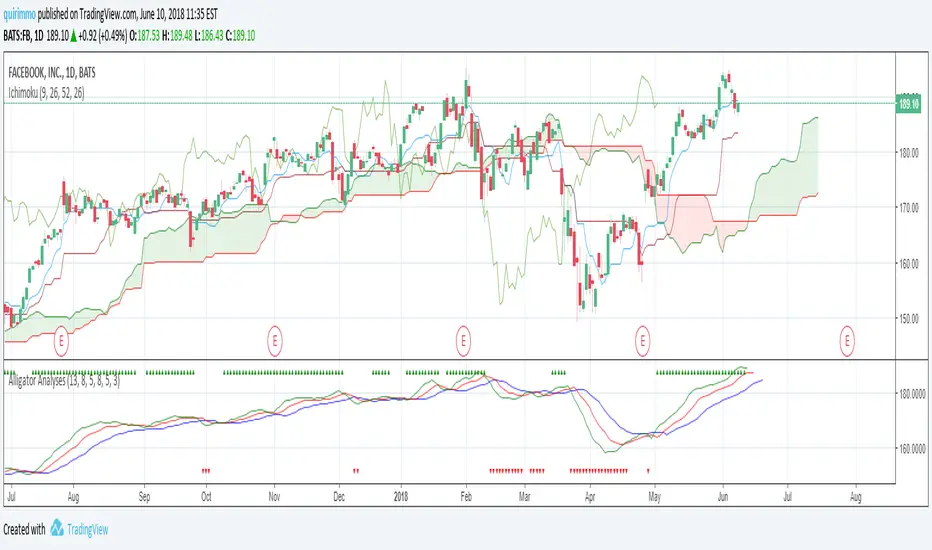
Alligator AnalysesA simple script in order to plot the Alligator Indicator with triangles plotted on the graph in order to see directly if the alligator is sleeping or eating.
You will see green up triangles when the alligator is bullish eating, while red down triangles when the alligator is bearish eating.
You will not see anything on the chart when the alligator is sleeping.
ATRIXTRIX Alligator with main line of balance.
Part of Atrix trade system.
Highly recommend to use with TTC v2 (Cumulative TRIX Moving Averages oscillator. )

Bill Williams. Alligator, Fractals & Res/Sup combined (by vlkvr)Bill Williams indicators (each separately) are simple and quite self-sufficient, however, are most often used together. The key ones (Alligator and Fractals) are freely available and everyone can use them, but why use them on the chart separately, when "together more fun", and not conceivable, in my opinion, they are one without the other.
So, I present "split/copypasta" of two key indicators of Bill Williams, plus (as a bonus) visualization of "Support/Resistance" levels (and in fact, lines from extremes or the same fractals).
As a result, before you indicator "three-in-one".

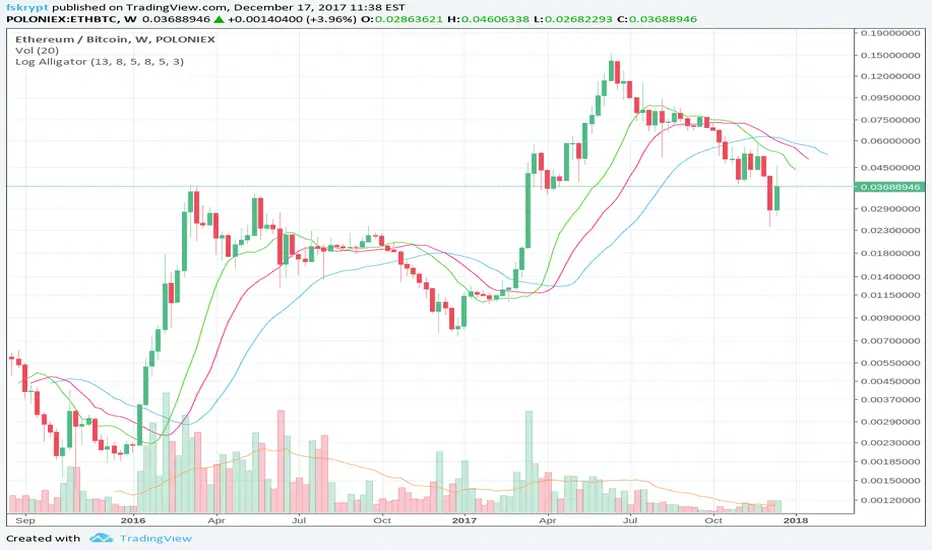
Log-space Williams AlligatorMake Williams Alligator usable for looking at weekly and high-volatility crypto charts.
The built-in indicator may have some problems with these charts, as in example below:
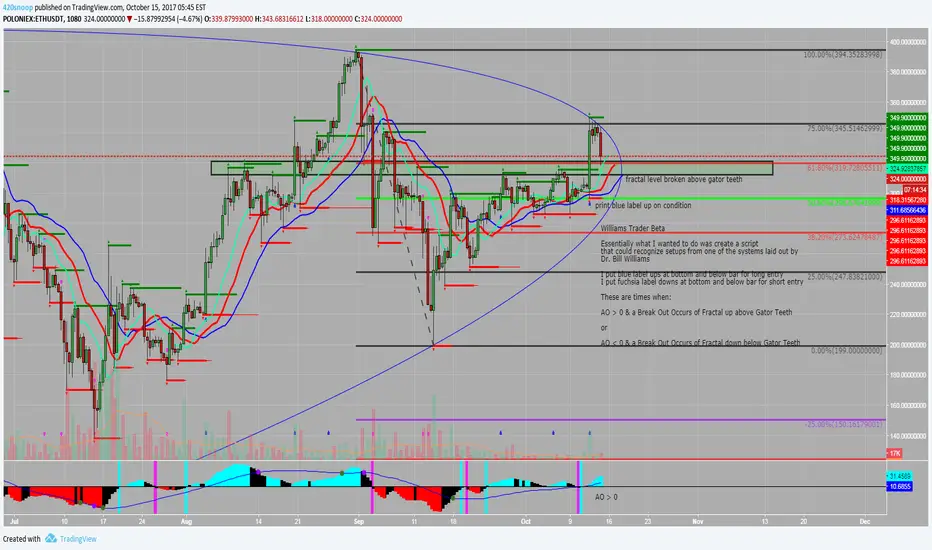
Williams Trader BetaWilliams Trader Beta (not for public use)
Essentially what I wanted to do was create a script that could recognize setups from one of the systems laid out by Dr. Bill Williams
I put blue label ups at bottom and below bar for long entry
I put fuchsia label downs at bottom and below bar for short entry
These are times when:
AO > 0 & a Break Out Occurs of Fractal up above Gator Teeth
or
AO < 0 & a Break Out Occurs of Fractal down below Gator Teeth
These also have alert conditions... be sure to use once per bar on close if using this condition!
Bill Williams Divergent BarsBill William Bull/Bear divergent bars
See: Book, Trading Chaos by Bill Williams
Coded by polyclick
A bullish (green) divergent bar, signals a trend switch from bear -> bull
-> The current bar has a lower low than the previous bar, but closes in the upper half of the candle.
-> This means the bulls are pushing from below and are trying to take over, potentially resulting in a trend switch to bullish.
-> We also check if this bar is below the three alligator lines to avoid false positives.
A bearish (red) divergent bar, signals a trend switch from bull -> bear
-> The current bar has a higher high than the previous bar, but closes in the lower half of the candle.
-> This means the bears are pushing the price down and are taking over, potentially resulting in a trend switch to bearish.
-> We also check if this bar is above the three alligator lines to avoid false positives.
Best used in combination with the Bill Williams Alligator indicator.

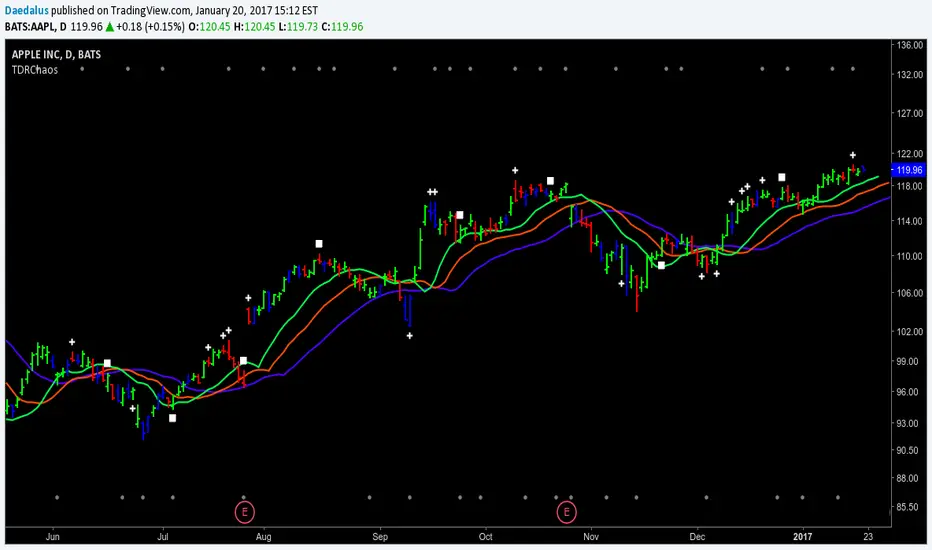
TDRChaos-2.0
TDR's version of the major Chaos Trading tools.
Williams' Alligator
Bullish/Bearish Divergent Bars (white cross above/below bar)
The three consecutive AO bars that start with the opposite bar first. (white square above/below bar)
Fractals (grey circle top/bottom)
*** NEW ***
Squat bars are painted "Blue" -> WARNING: (Does not work on BATS)
Be sure to start at thedaedalusreport.com
ChaosThis script adds a Bill Williams Alligator to your charts and the three wisemen:
1. Wiseman 1 - Bullish or bearish divergent bars shown with a circle (be sure to check angulation manually).
2. Wiseman 2 - Super AO - with a square.
3 Wiseman 3 - Fractal with a triangle.
Be sure to wait until the current bar is closed before using these signals.
Reference: TradingChaos Version 2

True Williams Alligator (Timeframe Multiplier)Modified version of my original "True Williams Alligator (SMMA)" indicator that includes a multiplier to show the alligator (ie elliot wave mode) of higher timeframes. See original indicator for details.
Note: First script submission. Didn't mean to use this chart. Ugly and messy. Oops.
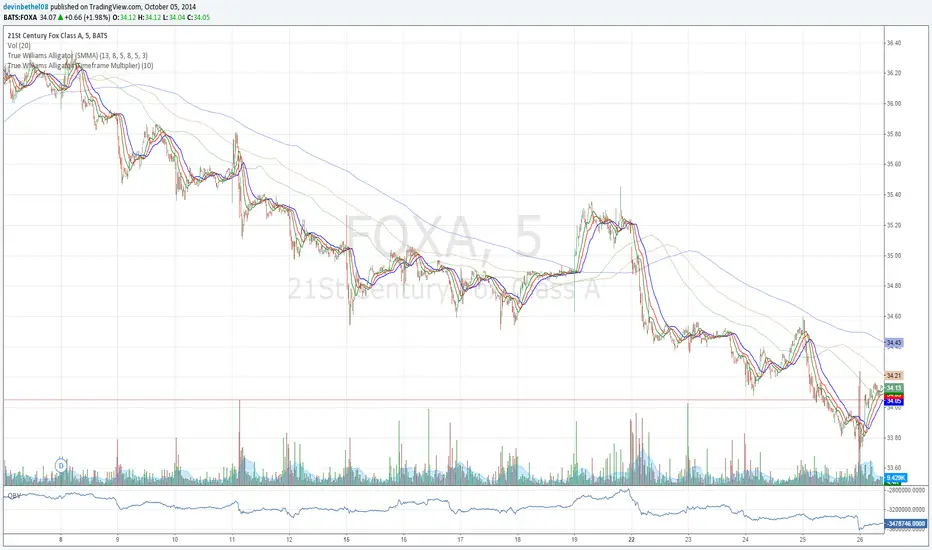
True Williams Alligator (Timeframe Multiplier)Modified version of the true alligator indicator (ie SMMA) that features a timeframe multiplier so that you can monitor the elliott wave of higher timeframes. (See original "True Williams Alligator" for more details.)
Note: First script submission. Didn't mean to use this chart. Also this is a duplicate post -- oops.
