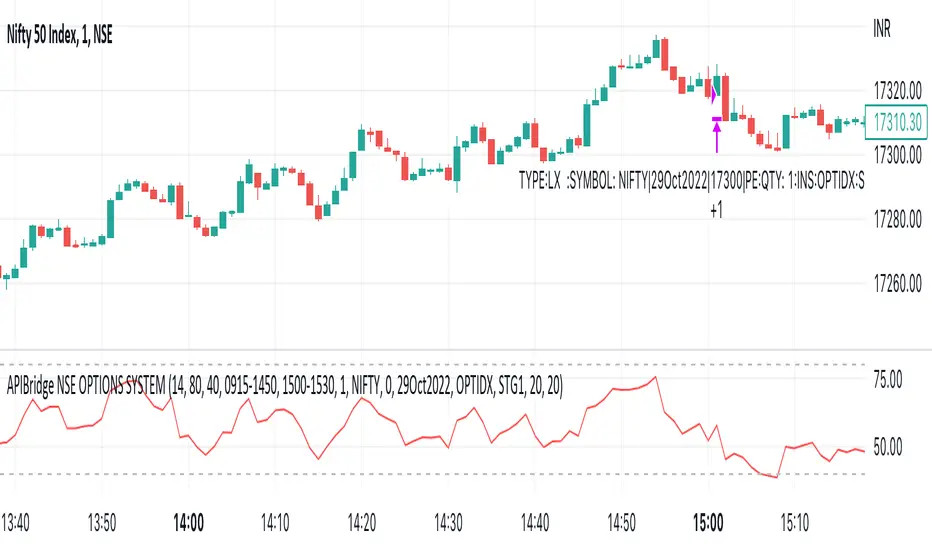
APIBridge Nifty Options Algo StrategyUsing Pinescript, we will use charts of Cash/Future to trade in Options. Note this strategy works well with even the free version of TradingView.
The Relative Strength Index ( RSI ). Is a momentum oscillator that measures the speed and change of price movements. The RSI oscillates between zero and 100. Increasing RSI shows increasing bullish momentum. Decreasing RSI shows increasing bearish momentum. We take RSI upper bound as 80 to indicate bullish momentum and RSI lower bound as 20 to indicate bearish momentum.
We use the above premise to create options buy-only strategy which trades in ATM strikes by default. This strategy requires very less margin (Minimum Rs . 15000).
Since this strategy uses underlying data (cash/future) to place trades in Options, please ignore the backtest of this strategy given by TradingView. TradingView does not provide options data but this strategy bypasses it.
Strategy Premise
The Relative Strength Index (RSI) is a momentum oscillator that measures the speed and change of price movements. The RSI oscillates between zero and 100. Increasing RSI shows increasing bullish momentum. Decreasing RSI shows increasing bearish momentum. We take RSI upper bound as 80 to indicate bullish momentum and RSI lower bound as 20 to indicate bearish momentum.
We use the above premise to create options buy-only strategy which trades in ATM strikes by default. This strategy requires very less margin (Rs. 15000 should be sufficient).
NSE Options Algo Strategy Logic
Long Entry: When RSI goes above 80, send LE in an auto-calculated option strike Call. When RSI goes below 20, send LE in auto-calculated option strike Put.
Long Exit: When we hit Stop loss or Target. In case SL/TGT does not hit and reverse RSI goes above 80 send Long Exit in auto-calculated option. Put as per last trade; RSI goes below 20, send LX in auto-calculated option call as per last trade.
For Long and Short entry the order is fired in the option buying side with auto strike price selection.
Option Strategy Parameters for TraingView Charts
RSI Length(Mandatory): Number of bars used to calculated RSI.
Upper Band(Mandatory): To specify upper band of RSI.
Lower Band(Mandatory): For specifying lower band of RSI.
Use reversal from Upper Band (Optional): This will enable short entry when RSI is falling below 80 from upper band. Recommended to keep unchecked initially.
Use reversal from Lower Band (Optional): This will enable long entry when RSI is raising above 20 from lower band. Recommended to keep unchecked initially.
Quantity: We use this specify the trade quantity (for Nifty min 75)
Custom Stop Loss in Points: Movement in chart price against the momentum which will trigger exit in options positions
Custom Target in Points: Movement in chart price against the momentum which will trigger exit in options positions
Base symbol: This is the base instrument symbol like NIFTY or BANK NIFTY.
Strike distance from ATM: Our default strike selection is considered as first ATM option (with nearest distance, only 100s are considered ). This strike distance allows to calculate ATM options which are at fixed distance.
Expiry: Expiry of option. Weekly and monthly both expiry are allowed.
Instrument: For index instrument will be OPTIDX, for stock instrument will be OPTSTK
Strategy Tag: The Strategy of Nifty options configured in Api bridge.
Setting Up Alert
Before setting up the alert make sure that you have selected desired script, time frame, strategy settings, and APIbridge configuration. Click in settings add alert and paste {{strategy.order.comment}} in message box.
Important: Do not change any settings during live trading. It may break the sequence of exit for the correct call/put.
Algotrading
RSI Buy & Sell Trading ScriptThis is my first attempt at a trading script using the RSI indicator for Buy & Sell signals (so please be nice but would appreciate any constructive comments).
Starting with $100 initial capital and using 10% per trade
You can select which month the backtesting starts
There is also a monthly table (sorry can’t remember who I got this from) that shows the total monthly profits, but you’ll need to turn it on by going into settings, Properties and in the Recalculate section tick the “On every tick” box
It should do the following:
Open Buy order if the RSI > 68 and the current Moving Average is greater than the previous Moving average
• TP1 = 50% of Order at 0.4%
• TP2 = 50% of order at 0.8%
• SL = 2% below entry
• Close Buy order if the RSI < 30
Open Sell order if the RSI < 28 and the current Moving Average is less than the previous Moving average
• TP1 = 50% of Order at 0.4%
• TP2 = 50% of order at 0.8%
• SL = 2% above entry
• Close Buy order if the RSI < 60
I would like to build on this if you have any ideas/ code that could help like the following:
• Move the SL to break even when it hits TP1
• Move the SL to TP1 when TP2 hits
• Moving take profit code so I can let the some of the trade stay in play (activate if it hits 1% profit and close trade if price retracts 0.5%)

BE - Volume Scalping ProDear Traders,
Here with presenting the new Indicator (Strategy) for scalping which is primarily built based on the the Volume Analysis.
Idea behind this Indicator: I am sure every trader would agree that Volume is one of the Leading indicator along with Price, and hence thought to use the same for scalping the trades. There is a direct co-relation between the price and volume and thereby used this as a base for arriving at strength of the volume pumped in. Indicator is working on the Logic of "What is the ROC in price for the volume dumped in and does ROC quantify the same which is happened in the recent past of x candles." In order to be successful in scalping trade, Accuracy, Risk to reward and Money Management is very much crucial and hence thought so much on this to make it happen.
Note: Accuracy here being profitable in the trade and not hitting the bulls eye all the time.
What this indicator is providing:
Based on the volume, ROC & Candle Thresholds and using the inputs provided for RISK and Money Management options, Indicator continuously scans for trading opportunities and provides alerts for possible trades.
Alerts & Notifications:
There are basically 3 types of Alerts provided one with General Notification and Other with Dhan HQ notifications to support Algo Trades and AlgoJi for supporting Algo trades too.
Self Declaration:
I have been testing the performance in 30 seconds and 1 min chart and I haven't faced any issues yet. I strongly recommend users to use the same in timeframe less than 10 Min only.
Enjoy!
DISCLAIMER: No sharing, copying, reselling, modifying, or any other forms of use are authorized for our documents, script / strategy, and the information published with them. This informational planning script / strategy is strictly for individual use and educational purposes only. This is not financial or investment advice. Investments are always made at your own risk and are based on your personal judgement. I am not responsible for any losses you may incur. Please invest wisely.
Happy to receive suggestions and feedback in order to improve the performance of the indicator better.

Tripple EMA Strategy - Dhan HQDear Traders,
Here with presenting the new Indicator (Strategy) which is primarily built based on the the EMA moving Average and Candlestick Pattern.
Idea behind this Indicator: I am sure every trader would have traded using Moving average one day or the other. And Moving average is theoretically they are Lagging and the EMA are used in place of Moving average just to avoid a bit of Lag to take advantage of those accuracy while avoiding the Lag. In order to be successful in trading Money Management and Risk Management is very much crucial and should be part of every trade we place.
What this indicator is providing:
Based on the EMA and candlestick patterns and using the inputs provided for RISK and Money Management options, Indicator continuously scans for trading opportunities and provides alerts for possible trades. I have tried to capture some analytical inputs for one to think and take control over the Reward, Risk and Money management parameters to tweak the indicator accordingly.
Below are the Analytical outputs provided:
1. Total Trades taken (History till present) and its profitability % & appx PNL
2. Current Dates & Yesterday's Trades along with its appx PNL
3. Long Trades performance vs Short Trades performance
4. Retrieve PNL values post specified Date in the Input settings.
5. Last 7 Days PNL
6. Month's PNL
Note: There is known BUG in the calculation where the first date of the month for Monthly PNL value is a trading Holiday then Monthly PNL is being displayed as 0. similarly this Bug is flowed for Last 7 Days PNL. This will be addressed in upcoming version along with planned release.
Alerts & Notifications:
There are basically 2 types of Alerts provided one with General Notification and Other with Dhan HQ notifications to support Algo Trades for Dhan HQ Baskets.
Overview for Dhan HQ Trade Alerts:
1. When the Day Beginning (At Session Start) Hedge Position can be placed and shall be squared off post Closing the session
2. During the course of the Day Buy & Sell Baskets shall be executed
3. Can map the Trade Level SL values
4. Can map Daily Limit for SL to avoid excessive Loss. Upon Loss you could stop trades for the complete day or you may restart the trade post completion of X no of hours.
Enjoy!
DISCLAIMER: No sharing, copying, reselling, modifying, or any other forms of use are authorized for our documents, script / strategy, and the information published with them. This informational planning script / strategy is strictly for individual use and educational purposes only. This is not financial or investment advice. Investments are always made at your own risk and are based on your personal judgement. I am not responsible for any losses you may incur. Please invest wisely.
Happy to receive suggestions and feedback in order to improve the performance of the indicator better.
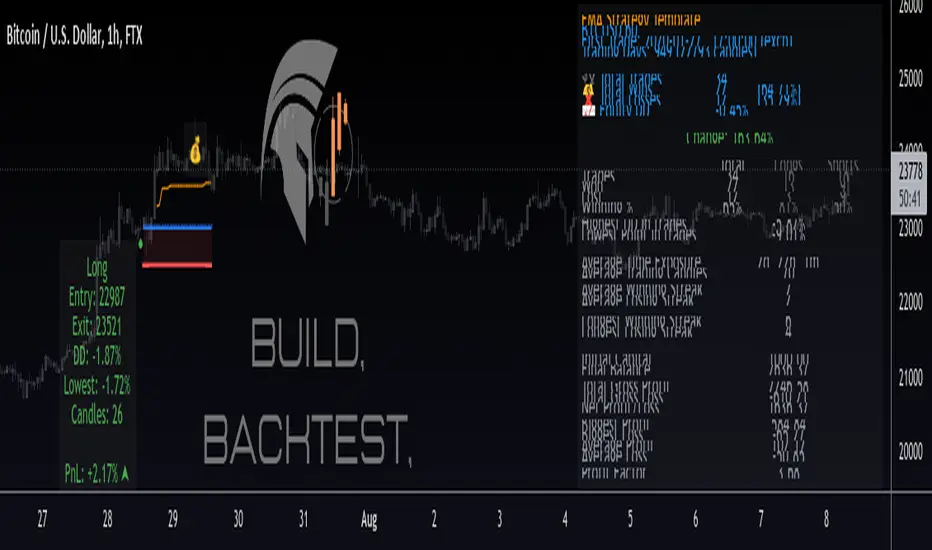
Protervus Trading ToolkitHi Traders! Welcome to Protervus Trading Toolkit (PTT) , a comprehensive set of tools to help you building, backtesting, and even automating your strategy.
Important : the data and screenshots I publish are solely for presentation and explanation purposes and must not be intended as recommendations or guarantees. Please consider eventual backtesting results seen here as almost-random. My goal is not to provide ready-made strategies, signals, or infallible methods, but rather indicators and tools to help you focus on your own research and build a reliable trading plan based on discipline.
BUILD, BACKTEST, AUTOMATE
The first step is to link a chained indicator which will send Entry signals and, optionally, Exit signals: to integrate your own triggers with this toolkit, check out my tutorial and use this code as a template.
Then, in the Trading Settings you can set the Trading Mode (Full - Long and Short, Long only, or Short only) as well as Starting Capital, Drawdown Limit, Risk per Trade, Fees, and the date range in which trading will be enabled and backtested.
Go further by tweaking your strategy with built-in Take Profit and Stop Loss conditions, and keep it under control thanks to the Statistics Panel.
Trades will be shown on the chart, including TP\SL levels (according to the ones you enable) and per-trade statistics:
Tip: point the cursor over TP or SL icon to open the tooltip, showing additional details about the trade.
BUILT-IN CONDITIONS
Note: all conditions already account for fees.
Take Profit \ Stop Loss percentage
Take Profit or Stop at Loss when a fixed percentage is reached.
Limit \ Hard Stop: the trade will be considered closed when that specific price is reached - otherwise, the candle closing price will be used.
Trailing Take Profit
Trail the price and close the trade in profit when it reverses for the chosen percentage.
Engage and Disengage: activate trailing when the price is above the entry price for the chosen percentage, and de-activate it if price goes past the disengage percentage.
Safety TP: close the trade at Break-Even if the price sharply reverses from engaged area to BE level. A specific Alert is available in order to create a separate trigger with immediate effect.
Note: using TP Safety with an Engage % of zero might result in many early exits, so it is recommended to add some margin to Engage % to avoid that.
Exit \ Stop on Opposite Signal
Close the trade when another, contrary signal is received (e.g. close a Long position when a signal to go Short is received).
Exit \ Stop after X candles
Close the trade after X candles, as soon as the condition is met (e.g. for Take Profit condition, it will close the trade after X candles as soon as the trade is in profit).
Bind to TP \ SL: only validate the condition if the current PnL is above (TakeProfit cond.) or below (Stop Loss cond.) the specified percentage.
ATR Stop
Classic ATR Stop Loss.
Trailing ATR
Chase the price by the defined ratio and close the position when the candle closes past the ATR line.
Bind to TP \ SL: only validate the condition if the current PnL is above (TakeProfit cond.) or below (Stop Loss cond.) the specified percentage.
External Signal (sent from your indicator)
Close the position basing on your own triggers, defined in the chained indicator.
- Bind to TP \ SL: only validate the condition if the current PnL is above (TakeProfit cond.) or below (Stop Loss cond.) the specified percentage.
PANEL CUSTOMIZATION AND ADDITIONAL OPTIONS
A strategy name can be assigned in the settings and will show it at the top of the Statistics Panel, so you can better identify and label your tests and live instances.
The panel can be customized in terms of colors, text size and height. It can be also "split" in modular panels that will appear at the bottom of the chart.
It is also possible to show \ hide prices and live data labels as well as position and Break-Even levels. In some cases you will need to limit the display of those plots in order to avoid PineScript calculation issues.
If you limited the plots but you are checking very old trades, you can enable the Legacy position tracker to see basic markers for positions (position is active, and profit \ loss marker).
In the case you will be sending webhook alerts to a trading bot , "Position Alert Failover" will come in aid to prevent situations where the initial trade closing alert is either not sent or missed: it will keep sending the position closing signal for X candles.
PLUGINS
Thanks to the modular nature of PTT, plugins will eventually be available to provide additional features and extend functionalities even further. Make sure to keep an eye on updates.
CREATING ALERTS
To create alerts you must first select the PTT indicator from the "Condition" drop-down menu, then the whole list of available alerts will appear. When creating alerts, please make sure to set "Once Per Bar Close" for the normal conditions, and "Once Per Bar" for safety conditions (Limit and Hard Stop simulation, Trailing TP Safety Trigger).
Besides positions opening and closing alerts, you also have the option to add extra alerts for when a position is open or not open (e.g. Active Long position, No Long Position) - that might come handy when dealing with trading bots and automation tools. Also, as mentioned earlier, you have the chance to create a special alert as failover in order to repeat the closing alert.
TIPS AND RECOMMENDATIONS
Set Visual Order > Bring to front for PTT to avoid other indicators or candles covering up labels.
If you receive errors like "Referencing too many candles" or "Too many drawings", use the " Limit to last candles " function in the Settings panel to lower the number of candles.
If the Statistics Panel or labels are not appearing, and no errors are shown (red circled exclamation mark next to indicator's name), try changing any value in the settings to trigger a new calculation.
The Lowest Point in Trades refers to the maximum movement against your position. However, if the price never goes negative against the Entry level, it will be calculated from the Break-Even level.
Differently from TradingView's Strategy Tester, PTT calculates DrawDown from the Equity line (the starting balance).
Remember that Backtests only show past results, and although very useful to understand if your strategy makes sense, the market can completely change at any moment and ruin your dreams: make sure to avoid over-fitting (using very specific values) in your settings and to prefer more generic values in order to factor broader market situations.
After many successful backtests of your newly created strategy, let it run live without actually trading it for some time (paper trading), and see if it remains valid.
You can use multiple Conditions as safeguard. For example, main Stop condition can be Trailing ATR and secondary Stop condition can be Stop Loss % with Hard Stop, so you will be protected in case of sudden big price moves.
Refracted EMARefracted EMA is a price based indicator with bands that is built on moving average.
The price range between the bands directly depends on relationship of Average True Range to Moving Average. This gives us very valuable variable constant that changes with the market moves.
So the bands expand and contract due to changes in volatility of the market, which makes this tool very flexible exposing psychological levels.

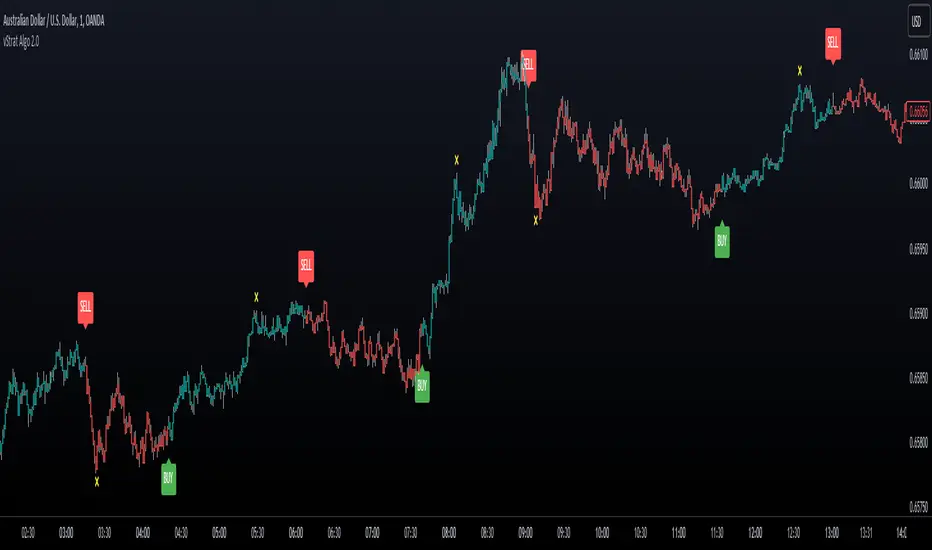
vStrat Algo 2.0vStrat Algo 2.0 is a Non-Repainting toolkit that works on any market such as stocks, crypto, forex, indices, commodities, etc. There are 8 advanced features that traders can use to help them create their own strategies. vStrat Algo 2.0 offers 10 sensitivity presets that they can choose from, making this toolkit suitable for every trading style whether it's scalping, day trading, swinging, or position trading.
I. Non-Repainting
When an indicator is Repainting , it changes its values as new data arrives, making it an unreliable indicator especially for Buy and Sell signals but this does not necessarily mean that the indicator is less accurate. vStrat Algo 2.0 does not repaint so the signals that were triggered in real time will stay the same during backtesting. If Non-Repainting is disabled, the signal that was triggered on a candle might disappear as new data arrives and once that candle closes, the signal might not even be there anymore, but it could get triggered on the next candle instead.
II. Signal Sensitivity
The Buy and Sell signals are highly accurate but the placement of each signal will differ for each selected preset. The higher the sensitivity (3.0 - 5.0), the more signals will be displayed on the chart. This setting works well when scalping using lower timeframes (1 min - 5 min). As the sensitivity lowers (0.5 - 2.5), less signals are displayed on the chart. If you are day trading or swinging, the lower presets are recommended as they are smoothed and will have less noise. Lower sensitivity works well on any timeframe.
III. Safe Mode
This feature hides any Buy and Sell signals that are triggered within the Consolidation Zones. The signals can still vary depending on the sensitivity, CZ Smoothing and CZ Length. The default setting is "3" and "7". "Unfiltered" must be unchecked for the signals to disappear.
IV. Unfiltered Signals
All Buy and Sell signals are displayed on the chart. This feature must be disabled if "Safe Mode" is enabled.
V. Trend Candle Colouring
This changes the bar colors depending on its trend. Green if it's trending up and red if it's trending down.
VI. Trend Cloud
Trend Cloud indicates the current market trend. This can also be used as a confluence to the Buy and Sell signals. Wider cloud indicates a strong momentum on either direction. As the cloud narrows, it could mean a possible reversal.
VII. Pivot Points
Pivot Points are useful for identifying significant support and resistance levels as well as identifying entry, exit, stop loss, and target profit levels.
VIII. Consolidation Zones
Consolidation Zones can be used to identify if the market is ranging. If enabled, it changes the colors of the bars that have low momentum to yellow. It is best to wait for a breakout to enter a trade but you can still be profitable when the market is ranging by trading based off Support and Resistance Levels and Imbalance Zones. Default setting is: Smoothing "3" and Length "7".
IX. Take Profit Levels
Take Profit signals are displayed on the chart as yellow "x". Once the algo detects a potential reversal, a Take Profit signal will be triggered so the user can lock in their profits. The signals can appear more than once so you have the option to keep holding as long as you know the risks. The lower the Length is, the more signals appear.
X. Alerts
Buy and Sell signal alerts can be created by clicking the three dots in the vStrat Algo 2.0 indicator tile.
Disclaimer:
All information found here, including any ideas, opinions, views, predictions, forecasts, commentaries, suggestions, or stock picks, expressed, or implied herein, are for informational, entertainment or educational purposes only and should not be construed as personal investment advice. While the information provided is believed to be accurate, it may include errors or inaccuracies. Conduct your own due diligence or consult a licensed financial advisor or broker before making any and all investment decisions. Any investments, trades, speculations, or decisions made on the basis of any information found on this site, expressed, or implied herein, are committed at your own risk, financial or otherwise.
Unicorn X-AlgoUnicorn X-Algo is a multifunctional trading indicator. It is designed to help traders make real-time decisions using quantitative models.
Its core is a trend trading strategy based on our enhanced Trailing Stop-Loss algorithm. This strategy provides the user with position entry and exit signals. It is customizable and has a built-in instant backtesting feature.
For those who have difficulty with finding the good settings the indicator has the Automatic Mode. In this mode, there is no need for the user to adjust any settings. The indicator calculates optimized trading signals automatically.
In addition, the indicator provides a number of useful tools that aim to provide additional confirmation to the trading signals. They include: support and resistance levels forecast, price range prediction and institutional activity detection.
The script can send real-time alerts to the user’s Email and to the cell phone via notifications in the TradingView app.
The indicator can be used for various types of trend and swing trading, including positional trading, day trading and scalping.
Unicorn X-Algo allows users to:
forecast direction of trends with BUY and SELL signals;
determine the right time to close a position;
detect institutional activity in the market;
forecast key support and resistance levels;
predict the future price range for any market;
customize any settings and do a backtest with one click;
see historical trades on the chart;
use the fully Automatic Mode where the algorithm optimizes all its settings itself.
When using this script, keep in mind that past results do not necessarily reflect future results and that many factors influence trading results.
FEATURES
Trading signals
The feature calculates trend or swing entry and exit signals. The underlying strategy does not use fixed Take-Profit levels. It trails the price with a Trailing Stop-Loss to get as many pips as possible from price movements.
The feature is based on our custom Volatility Stop algorithm. It uses linear regressions instead of averaging. As our practice shows, this helps to reduce signal lag while keeping the number of false signals low.
Trading signals are customizable with Sensitivity and Trade Length parameters which determine the trading signals frequency and width of the Trailing-Stop levels, respectively.
Automatic Mode
The Trading Signals function has an automatic mode. When it is turned on, you do not need to adjust the trading signals settings. The algorithm tries to calculate the best settings automatically using an optimization algorithm.
In this mode, Buy and Sell signals are displayed as green and red triangles respectively. There are two types of exit signals displayed as circles and crosses. A circle signal means that a price reversal is expected and you can partially close the position. A cross signal means that a trading signal in the opposite direction is expected soon and you can partially or completely close your position.
Support and Resistance Levels
Support/Resistance levels forecasting model. The forecasted levels are non-repainting. Once calculated for a specified period in the future (day, week, month, etc.), they don't change during this period.
The feature allows the trader to plan trades and use the forecasted levels as entry levels and targets for opening and closing positions. Both intraday and higher timeframes are supported.
The forecasting model analyses the distribution of the price time series to find clusters in the data. These clusters are then used to make the key price levels forecast.
Big Money Activity detection
The Big Money Activity tool identifies areas on the price chart associated with instructional traders' activity in the market.
Institutional activity in a trending market can be a leading signal for upcoming reversal. Institutions could be fixing their profit, causing the price to move against the current trend.
Institutional activity in a sideways market can be due to positions accumulation and signal a new trend formation.
The algorithm uses tick volume, volume, and volatility data to forecast activity of institutional investors. The method develops the idea described in the Daigler & Wiley (2015) and Shalen (1993) works. It says that when institutional traders actively open or close their positions in the market, a divergence between volume and volatility time-series arises. It can be due to their use of position-splitting algorithms that reduce the impact of their positions on the market.
Trading Range Forecast
Trading Range Forecast feature predicts the price range of an asset for a selected period of time in the future, called Forecast Horizon. It can be the next day or 12-hour trading session. This function works if your chart timeframe is intraday (i.e. the timeframe below "D"). It shows the upper and lower bounds between which the price is going to stay in the upcoming Forecast Horizon period.
Instant Backtesting
After changing any settings, you can immediately see the performance of the strategy on the Instant Backtesting panel. Two metrics are displayed there - the percentage of profitable trades and the total return. This information, as well as the historical trades shown on the chart, will help you quickly and easily evaluate any settings you make.
SETTINGS
TRADING SIGNALS
Trade Length - defines the length of the trades the algorithm tries to make. Recommended values are from 1.0 to 6.0.
Sensitivity - controls the sensitivity of the trading signals algorithm. The sensitivity determines the density of trading signals and how close the trailing-stop levels follow the price. The higher the value of this parameter is, the less sensitive the algorithm is. High values of the Sensitivity parameters (100-500) can help to withstand large price swings to stay in longer price moves. Lower values (10-100) work well for short- and medium-term trades.
TRADING TOOLS
Big Money Activity - turns on and off the identification of the areas associated with institutional traders activity.
SUPPORТ AND RESISTANCЕ LEVELS
Show Support And Resistance Levels - turns on and off support and resistance levels calculation.
TRADING RANGE FORECAST
Show Trading Range Forecast - turns on/off trading range forecasting
Forecast Horizon - sets the period for which the trading range forecast is made
Forecasting Method - allows to choose a forecasting algorithm for the trading range forecast.
BACKTESTING
Use Starting Date - turns on/off the starting date for the strategy and backtests. When off, all available historical data is used.
Starting Date - sets the starting date for the strategy and backtests.
Show Instant Backtesting Dashboard - turns on/off a dashboard that shows the current strategy performance: the percentage of profitable trades and total return.
Leverage - sets the leverage that the strategy uses.

Unicorn QuantDeeply customizable trading algorithm with instant backtesting. It emulates real trading and displays all the actions it takes on the chart. For example, it shows when to enter or partially close a position, move Stop-Loss to breakeven, etc. The user can replicate these actions in their trading terminal in real time. The algorithm uses up to three Take-Profit levels, and a Stop-Loss level that can move in a trade to protect the floating profit.
The script can send real-time alerts to the user’s Email and to the cell phone via notifications in the TradingView app.
The indicator is designed to be used on all timeframes, including lower ones for intraday trading and scalping.
HOW TO USE
Set the Stop-Loss and up to three Take-Profit levels. Choose the rules for moving the Stop-Loss level in a trade. Adjust the sensitivity of the trading signals. And check the backtest result in the Instant Backtesting dashboard. If the performance of the strategy satisfies you, proceed with the forward testing or live trading.
When using this script, please, keep in mind that past results do not necessarily reflect future results and there are many factors that influence trading results.
FEATURES
Trading Signals
The feature calculates Buy and Sell signals for trend or swing trading. The user can change the Sensitivity parameter to control the frequency of the signals. This allows them to be adjusted for different markets and timeframes.
Position Manager
To make the Position Manager setup as easy as possible, the algorithm calculates Stop-Loss and Take-Profit levels in Average True Range (ATR) units. They are self-adjusting for any market and timeframe, since they account for its average volatility .
You don't have to worry about what market you are trading - Forex, Stocks, Crypto, etc. With the self-adjusting Stop-Loss and Take-Profit, you can find settings that work for one market and use the same numerical values as a starting point for a completely different market.
Instant Backtesting
After changing any settings, you can immediately see the performance of the strategy on the Instant Backtesting panel. Two metrics are displayed there - the percentage of profitable trades and the total return. This information, as well as the historical trades shown on the chart, will help you quickly and easily evaluate the settings.
SETTINGS
TRADING SIGNALS
Sensitivity - controls the sensitivity of the trading signals algorithm. It determines the frequency of the trading signals. The higher the value of this parameter, the less trading signals you get and the longer trends the algorithm tries to catch. The lower the sensitivity value, the more signals you receive. This can be useful if you want to profit from small price movements.
POSITION MANAGER
SL - sets the Stop-Loss level measured in ATR units.
TP1, TP2, TP3 - set the Take-Profit levels measured in the ATR units.
Close % at TP1, Close % at TP2, Close % at TP3 - set portions of the open position (as a percentage of the initial order size) to close at each of the TP levels.
At TP1 move SL to, At TP2 move SL to - set the rules for moving the Stop-Loss level in an open trade to protect the floating profit.
Show Open Position Dashboard - turns on/off a dashboard that shows the current Stop-Loss and Take-Profit levels for the open position.
BACKTESTING
Use Starting Date - turns on/off the starting date for the strategy and backtests. When off, all available historical data is used.
Starting Date - sets the starting date for the strategy and backtests.
Show Instant Backtesting Dashboard - turns on/off a dashboard that shows the current strategy performance: the percentage of profitable trades and total return.
Leverage - sets the leverage that the strategy uses.

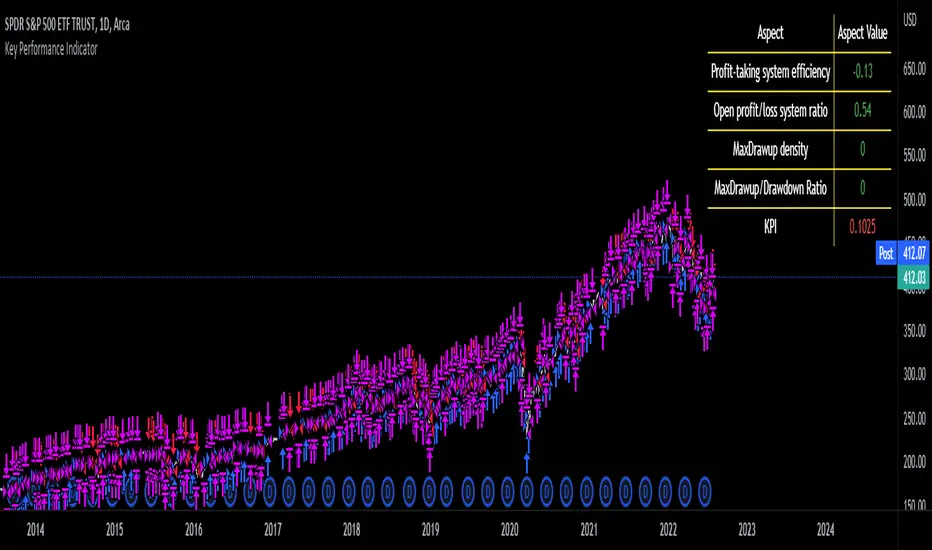
Key Performance IndicatorWe are happy to introduce the Key Performance Indicator by Detlev Matthes. This is an amazing tool to quantify the efficiency of a trading system and identify potential spots of improvement.
Abstract
A key performance indicator with high explanatory value for the quality of trading systems is introduced. Quality is expressed as an indicator and comprises the individual values of qualitative aspects. The work developing the KPI was submitted for the 2017 VTAD Award and won first prize.
Introduction
Imagine that you have a variety of stock trading systems from which to select. During backtesting, each trading system will deliver different results with regard to its indicators (depending on, inter alia, its parameters and the stock used). You will also get different forms of progression for profit development. It requires great experience to select the “best” trading system from this variety of information (provided by several indicators) and significantly varying equity progression forms. In this paper, an indicator will be introduced that expresses the quality of a trading system in just one figure. With such an indicator, you can view the results of one backtest at a glance and also more easily compare a variety of backtesting results with one another.
If you are interested in learning more about the calculations behind this indicator then I have included a link to the english version of his research paper.
Along with this, we now offer indicator development services. If you are interested in learning more then feel free to reach out to get a quote for your project.
**Please note that we have NOT inputted any real strategy into the code and therefore it is not producing any real value. Feel free to change the code as desired to test any strategy!**
drive.google.com
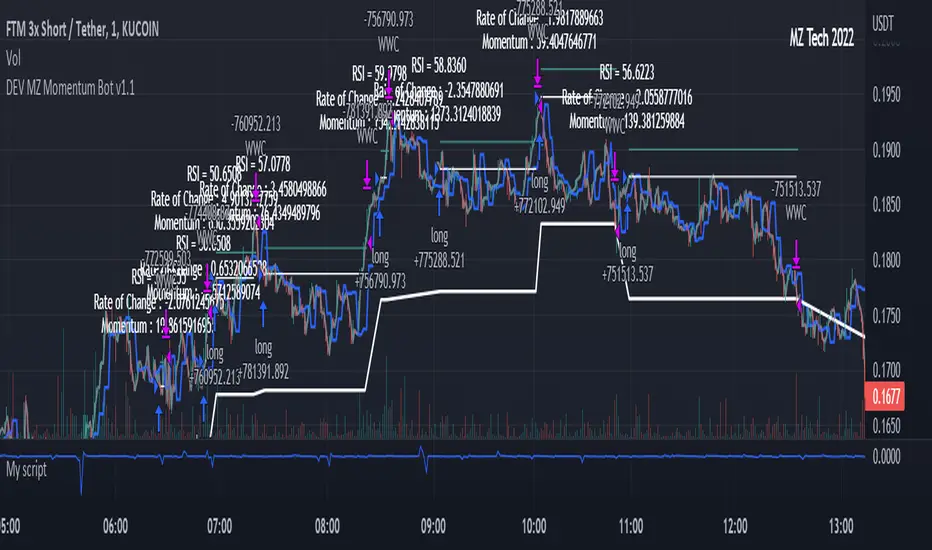
MZ HTF HFT ROCit Bot - Non Repainting Scalper v1.2 ADX RSI MOM This is a new iteration based on my Momentum trading bot.
This is an original script meant to be a high frequency trader that works on higher time frame calculations.
I came up with the idea that using calculus I can figure out the actual rate of change and momentum with different calculations than the momentum indicator that is provided by trading view. Once momentum is shifted on a small time frame, it will provide an entry signal. The script is meant to be used on an algorithmic trading system for scalping purposes. It should be run on a one minute time frame. Unfortunately due to various plotting constraints in Pinescript, you cannot plot the rate of change and momentum and price in the same pane. To counter this, I have a showdata toggle to give you values of the indicators at each entry.
This version has two main entry settings toggled with a checkbox. There is the ROC (rate of change) version and the MOM (momentum) entry signals.
The rate of change version is meant to take a look at your moving average and try to trigger when it hits a certain rate of change point. This can be helpful if you rather play it safer. I have noticed that you can get slightly better entry points but also does not give you as many entries. The momentum algorithm will give you faster entry points and might work best with a slight offset (use your back test to help you figure it out).
I have started to add tooltips to help you along. If you have suggestions please let me know.
How does it work?
Let's just assume that you are looking at a one minute chart. I recommend using the one minute for bots because it will give you the fastest execution for entries. Pinescript has an issue where the signal is not usually sent until the end of the bar/beginning of next bar. If the signal was triggered at the beginning of a 15 minute bar, it might not actually send the signal until the following 15 minute bar. If you are trading on small time frames, this can make all the difference. If you are using an algo platform that trailing stops, stop losse, take profits, etc. I would recommend you use that platform to close your trade. The close trade message will work, but pinescript does not know the exact entry price you received, so if you are trying to collect small profits, it is best that intermediary platform does that calculation for you. If you are dealing with larger moves, instead of small 1-3% scalps, you are probably fine to use the close message setting from pinescript.
Ok, so to take an example. I like to use the 3L and 3S tokens on Kucoin. This gives you a lot of volatility to work with compared to other tokens and coins. However, it can also meas that you are likely taking a higher risk. However, there are some things that can help with that (more on that later).
So we have a token we want to run, and have it on the 1m chart.
First, be sure that all of your filters are OFF when you start playing with the back test. This allows you to see how to best optimize the bot.
Use the show data to show you additional data when you are backtesting. This can allow you to try to filter out results or market conditions that do not work. I typically work with the RSI and use the 30 minute and 15 minute RSIs. I make sure that it is trading within a certain band - about 40-75. You can try the inverse and only buy during really low RSI's as well.
www.dropbox.com
Find the source of your data with the variant drop down. You can use any time frame, open, close. high, low, olc4. Open is pretty much guaranteed to not have any repainting issues - although all the other calcs use a custom isbarconfirmed security repaint calculation. I have been finding that Open and SMA work well, but feel free to explore. If you use a source like open, close, high, low, etc - the interval will not change anything further. If you use a variant such as an sma, you should try to find an interval that works well for that token. For instance, try an sma of 8-11 minutes and see which gives you the best backtest result without changing anything else. Offset ALMA/LSMA parameters are only used for those specific variants. These specific parameters will also affect the ALMA and LSMA if you use that variant in the trend filter. In other words, you can skip these if you are not using those types of moving averages.
www.dropbox.com
Configure the ROC and MOM intervals. If you are using a source such as open, close, etc- this is where you set the interval for your change. So consider using OHLC4 or a interval of 5 thru 15 and see what works best. The Momentum inverval usually works best in the 2-5 bars. There is a custom calculation I added in to try to filter out false entries as momentum is waning. This calculation works best in 2-5 bar interval.
Configure the trigger point and offset. If you are using rate of change, the best settings will likely be between -1 to 0.5. If you are using momentum, you will likely want -20 to 10. This is where you will notice the entries will shift a bit. Try to find a balance between your backtest settings and actually finding what you thin will be the best entries based on a slight delay from trading view, to algo, to your trading platform. This can likely be a minute (maybe even) or so- so be sure to not get too caught up between the backtest results and be sure to finesse the entries to actually fit nicely - maybe a bar earlier than you would likely think. If your entries are coming in too early, you can use the offset to delay your entry by a few bars. This is both science and an art form- don't get too caught up on the back test results as that is based on having all the data tha already transpired, it's not based on how it will actually perform during deployment.
Take profit and stop loss. This should be self explanatory. This script can toggle between static take profit and a trailing profit. For scalping, you will likely want to limit it below 2% to get a good win ratio. Stop loss should be at least 5-6% for these types of 3L/3S tokens to give the strategy some room to move (if the token goes down 2% before it shoots back up, the price will go down 6%). This does not yield the best R/R ratio from a traditional trader perspective, but the statistical probabilities are in your favor for these events will happen. If you have better ideas for how to set this all up, feel free to contribute your ideas in the comments as we can all learn from each other. You can definitely set a much tighter stop loss with a larger take profit to get a lower win rate but in turn might get much better returns. It's all up to you.
FILTERS www.dropbox.com
These filters require you to know a bit about each indicator and how you want to use them. I will only go over the general idea.
Variant Filter - this is especially useful if you want to trade above a moving average. Say for instance you only want to take trades when we are over the 100 Day moving average. Or above a 30 minute, 30 bar EMA, etc. Although originally ported over from my other scripts, this is not a filter that I use often in conjunction with this script.
RSI - perhaps you want to buy when we are below the 30 line on the 30 minute RSI, or we want only want to have the strategy work when we are above the 50 RSI, this can all be configured here. I typically like to try a few different rationales here.
Now with brand NEW ADX filter - this is a brand new idea that seems to work rather well. Based on your ADX settings you can also turn on the "only uptrend" which will try to calculate if you are in an uptrend based on your ADX config. Please keep in mind that uptrend is based relatively on the ADX settings.
- There is a sprinkle of RSI magic in the entry signal to make sure that rsi is not declining in the calculation, so this can affect how many entries you get.
Some other tips:
Forward test.
Set up your algo bot on a one minute interval.
Set up take profit and stop loss on your algo trading platform.
Don't use the exact settings as your backtest, maybe try a slightly more conservative approach from the algo trading platform to make sure you are within range of triggering your events with a slight delay from signal to execution. If you have a 1.6% take profit, perhaps try 1.5% on your platform first.
By using these scripts you agree that you are trading at your own risk. I make no guarantees of returns or results. I just provide tools to help you trade better. However, I hope this ROCit will take you to the moon. And if it does, be sure to give me a shout as well as some tips of your own.
Send me a message with any questions or suggestions.

MZ Momentum Non Repainting HTF HFT Scalper BotThis is an original script meant to be a high frequency trader that works on higher time frame calculations. I came up with the idea that using calculus I can figure out the actual rate of change and momentum with different calculations than the momentum indicator that is provided by trading view. Once momentum is shifted on a small time frame, it will provide an entry signal. The script is meant to be used on an algorithmic trading system for scalping purposes. It should be run on a one minute time frame.
Set it up on a one minute chart - setup your bot on a one minute interval.
Find the source of your data. You can use any time frame, open, close. high, low, olc4. Open is pretty much guaranteed to not have any repainting issues - although all the other calcs use a custom isbarconfirmed security repaint calculation.
Set your rate of change period - typically I use a one minute time frame for this as well - but set my length fairly long (30-40).
Then set your period for momentum calculation. This will sample the rate of change data to figure out your momentum. I typically try a setting of 6-8. If that doesn't work, try setting it about the same as the rate of change period and add or subtract a few from there.
Unfortunately due to various plotting constraints in Pinescript, you cannot plot the rate of change and momentum and price in the same.
Set your trigger point. I try values -30, -20, -10, 0, 1. Then finesse to get an earlier entry signal. You should account for a slight delay from the signal to the actual entry. Your backtest should test well, but please note that does not gaurantee results. In my findings, I have seen that there is a slight minimal delay between signal to entry and that can make the difference whether your trade is profitable or not.
Use the show data to show you additional data when you are backtesting. This can allow you to try to filter out results or market conditions that do not work. I typically work with the RSI and use the 30 minute and 15 minute RSIs. I make sure that it is trading within a certain band - about 40-75. You can try the inverse and only buy during really low RSI's as well.
Use the enter and close messages to setup your webhook messages. But I recommend to allow the algo trading platform to close the trade for you based on their calcs since that platform knows the actual price level and when it has become profitable.
Filters have been setup for
Moving Average Variants - any time frame, any length.
RSI - Any time frame, any length,
Future Plans: ATR Filter so you can filter out low volatility periods.
Send me a message with any suggestions.
New York Happy HourNew York Happy Hour
Script inspired by Stacey Burke’s 'Trading New York Open 1 Hour a Day'. You know where to search. The algos run on New York time. You’ll be looking to trade from 9.30 AM NY EST using a full day of trading data behind you.
Instruments:
- Gold, major currency pairs, indexes, metals and crypto
Timing: 15 Min
Best Trade Setups:
- 3 Levels (HOD/LOD)
- Trend Trades
- Reversal Trades
- Trading Range
- Or what you see best fit
Script Breakdown:
Sessions:
Asia: 8-11 PM
London: 2-5 AM
New York: 8-11 AM
Other lines:
New York Midnight Open
New York Open
London and NY vertical lines
Previous daily and weekly high and low

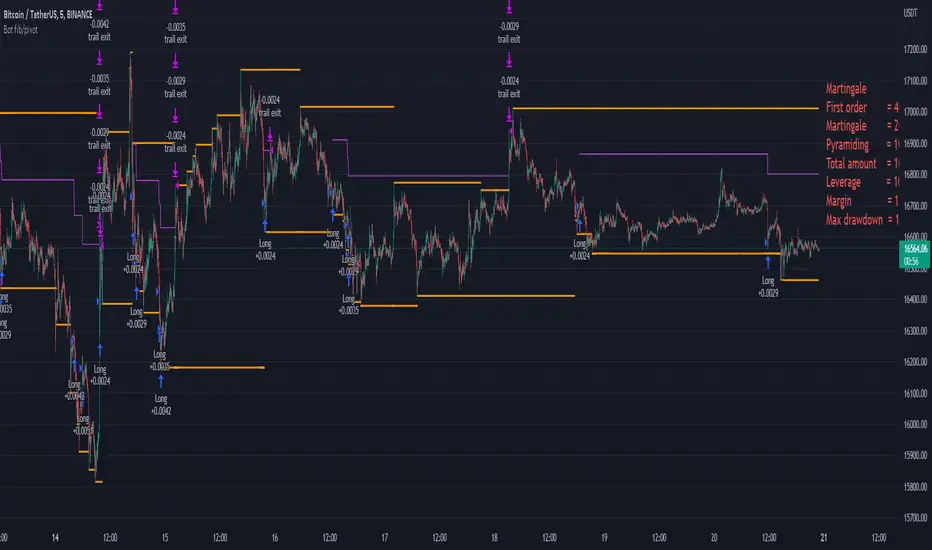
Bot fib/pivot Hello, friends!
This strategy is based on the fibonacci level you choose in the setup and possible pivot points under the control of Williams’ Percent Range.
Williams' Percent Range is a dynamic indicator that detects overbought/oversold conditions.
When the possible reversal points coincide with the fibonacci level, and the high or low points according to Williams also coincide, then an entry occurs.
One of the oldest and most reliable trading tools are widely used support and resistance levels.
In this strategy, we are trying to find these reversal levels based on fibonacci.
//LOGIC ENTRY SETTINGS
Deviation-deviation from the pivot point, the lower this figure, the more entries. The yellow lines on the chart are pivot points.
Fibonacci lvl-fibonacci level, from which the entry will occur, provided that other conditions match
Highest lookback-The setting, which refers to Williams' Percent Range , looks at how many candles ago, was high or low. The smaller the number, the larger, but less accurate inputs.
//AMOUNT(USDT) FIRST ORDER AND > % NEXT
-Martingale first order (the amount of the entrance to the usdt) / next order (Increase of each subsequent order as a percentage)
//EXIT SETTINGS (%, RSI)
-Use RSI for close position? (the position will not be closed if it is in the red, even if the RSI conditions worked)
-Use % for exit? Exit immediately upon reaching the specified percentage
-Use trailing? When the checkbox is checked, the position will be exited by trailing.
Activation trail,after?- When the specified percentage is reached, trailing is activated!
Stop_trail,%- if the last candle falls from the high (after the trailing is activated), the position will be exited.
For example:
We entered the purchase at 100 per asset, activation costs 10, and stop is 2.
the price reached 110, there was an activation, after that it went up to 120, and from the high of the last candle, a 2% drop occurs and the trade is exited.
PS:The default value is 1%, what does this give us? if there is a sharp increase, then we take away all the movement
Use only long?
Allow long?- Only long trades will be displayed
Allow short? Only short trades will be displayed
Allo reverse? Upon receipt of a return signal, the opposite position will be closed.
//MARTINGALE GRID
If there is a check mark in the line "Use martingale and grid?"
then the grid will be active
If there is a check mark in the "Limit each next entry,%?" then, even if the entry from the bot logic is triggered, and the price does not fall by the specified percentage, then there will be no entry!
If there is a check mark in the "Grid,%" column, then purchases with martingale support will be added with a decrease by the specified percentage!
PS: "Grid" always starts anew, as the input from logic triggered!
//FILTER SETTINGS
1) Use filter oscillator? (The filter uses 7 averaged oscillators)
Period-the period for which you will be billing
Upper line-Short entry border.
(if 40, then there will be no entry until it reaches)
Lower line-Long entry border.
(20 until below 20 no entry)
2)Use filter range?
Filter type-moving average selection
Bars back-offset speed based on number of last bars
Period-period to calculate
3)Use filter supertrend?
Supertrend filter with multitimeframe
// How do filters work 2 and 3?
Filters can work either one by one or together.
A trade is entered when conditions from the logic and filters in the red zone are triggered, when there are no entries in the green zone.
//DATA RANGE:
-Testing results for any period of time
//PIRAMIDING
-Also in the settings there is a pyramid of order, keep this in mind. Make a deal for a small part of the deposit, and not for all the money at once!
PS: to use martingale, you need to write in the hook messages:
"amount": "{{strategy.order.contracts}}" (purchases will be in the amount of coins equivalent to USDT)
The default settings for TF are 1 minute, 10 inputs.
You can choose your settings for any TF, but look at different coins to make sure you have good statistics
Ebb N Flo Trend [Backtester]Ebb n Flo Trend is a trend indicator that makes use of higher time frame High - Low pivots to determine when a trend has changed
In order to reduce over trading, and to reduce fake outs, the script relies on a clever combination of Fib ratio expansions and an averaged candle close
By combining the above strategies, the trend indicator forms a trailing trend indicator
The script determines when the current market condition has crossed over or under the trailing trend, and based on the closing conditions will change the trend of the script signaling a change. If the trend indicator is below the current market and green, the trend is bullish. If the trend is above the market and red, the trend is bearish
The indicator does not repaint, as such, once a signal has been received, the condition has been met on a previous candle and is final
Trend indicator can be used on any markets, for both Long and Short swings, however is best suited for long term trading on certain crypto markets (based on backtesting results). Be on the lookout for pairs with decent volume on reputable exchanges. It is not a holy grail type script for all markets. The key is to find enough to diversify your trades.
As can be seen in the backtester results, the script performs exceptionally well when trading using the 1W higher time frame (selection in the script settings), in the 1D current time frame (selecting the chart time frame)
The script is ideal for the beginner trader that cannot spend hours everyday looking at charts.
The backtesting results are based on allocating 10% of your portfolio to a single trade - this should be determined by your risk appetite.
There are risks associated with any form of investing. Never invest more than you are willing to lose. Past performance is not a guarantee or predictor of future performance. Do your own due diligence before making any investment decisions.
Configuration:
The dropdown in the script selects the time frame for Highs and Lows that the script must consider, and the chart time frame is the time frame of which closing conditions the script should use
Alerts:
The indicator comes with 2 off alerts: open_LONG and open_SHORT, which in itself is self explanatory, however, due to the slow trading nature of the script, alerts are generally not needed
Once you receive access to the trial version, you will also receive a link to a video that will show you exactly how to set up the script
Happy trading

Ebb N Flo Trend [Signals]Ebb n Flo Trend is a trend indicator that makes use of higher time frame High - Low pivots to determine when a trend has changed
In order to reduce over trading, and to reduce fake outs, the script relies on a clever combination of Fib ratio expansions and an averaged candle close
By combining the above strategies, the trend indicator forms a trailing trend indicator
The script determines when the current market condition has crossed over or under the trailing trend, and based on the closing conditions will change the trend of the script signaling a change. If the trend indicator is below the current market and green, the trend is bullish. If the trend is above the market and red, the trend is bearish
The indicator does not repaint, as such, once a signal has been received, the condition has been met on a previous candle and is final
Trend indicator can be used on any markets, for both Long and Short swings, however is best suited for long term trading on certain crypto markets (based on backtesting results). Be on the lookout for pairs with decent volume on reputable exchanges. It is not a holy grail type script for all markets. The key is to find enough to diversify your trades.
As can be seen in the backtester results, the script performs exceptionally well when trading using the 1W higher time frame (selection in the script settings), in the 1D current time frame (selecting the chart time frame)
The script is ideal for the beginner trader that cannot spend hours everyday looking at charts.
The backtesting results are based on allocating 10% of your portfolio to a single trade - this should be determined by your risk appetite.
There are risks associated with any form of investing. Never invest more than you are willing to lose. Past performance is not a guarantee or predictor of future performance. Do your own due diligence before making any investment decisions.
Configuration:
The dropdown in the script selects the time frame for Highs and Lows that the script must consider, and the chart time frame is the time frame of which closing conditions the script should use
Alerts:
The indicator comes with 2 off alerts: open_LONG and open_SHORT, which in itself is self explanatory, however, due to the slow trading nature of the script, alerts are generally not needed
Once you receive access to the trial version, you will also receive a link to a video that will show you exactly how to set up the script
Happy trading

Maddrix_club III (strategy)Maddrix club III (STRATEGY) is an advanced trading algorithm that goes long and short in spite of the market condition. It aims to capture large moves. It is the fruit of over a thousand hours of work, trials, errors, research, etc.
The STUDY version is also posted.
There are 5 main variables to adjust the indicator:
Framework length – Use this to establish the environment. Shorter length = volatile environment. Longer length = steadier.
Framework multiplier – Use this to adjust the environment to the asset. Lower value for less volatile price action and higher value for very volatile price action.
Search timeframe – Use this to lookback for a fractal . In theory, the longer the lookback the more reliable the fractal recognition.
Trigger line – Use this to adjust the trigger level. In theory, the lower the trigger the more signals you get.
Threshold – Use this to filter the signals. The higher the threshold, the less signal you get.
The best way to go about changing the settings, is to start off the default value. I’d do a monthly check-in playing with few of them and readjusting based on results from the exchange.
They are different, as this one can show you the equity curve.
It works on many markets as long as there is sufficient activity to create patterns and repetition.
You will notice a slight difference between the strategy calculation and the algo calculation (built in the algo) - this is because the exits are not exactly at the same levels. I left this on purpose, so that you can see that even with a little slippage, overall this is positive.
Very good results have been observed on the 15 min time frame though it technically works on all timeframe (5 min for example, 1 hour also). On the example above ETHUSDT – 15 min, the back test shows consistency in the results for the last 2 years. The theory behind it is based on probabilities, human emotions, and repetition in market patterns.
Results have also shown great adaptability, meaning the total profits don’t change considerably when we play with settings. This is very good because even if you try to fine tune a set of settings to the past, the probability that it keeps working in the future is rather high.
Very important note: the calculations DO NOT take into account any fee or slippage that you always experience on the exchanges.
The indicators only uses real time data, therefore it can’t repaint.
There are absolutely no guarantees about this algorithm and past results are not indicative of future performance.
Fees, slippage and API delay: for any algorithm you will use (from me or others), please keep in mind that fees add up, slippage and delay creates differences between algo theory and reality. We can put in place systems to circumvent that, but we will always have them.

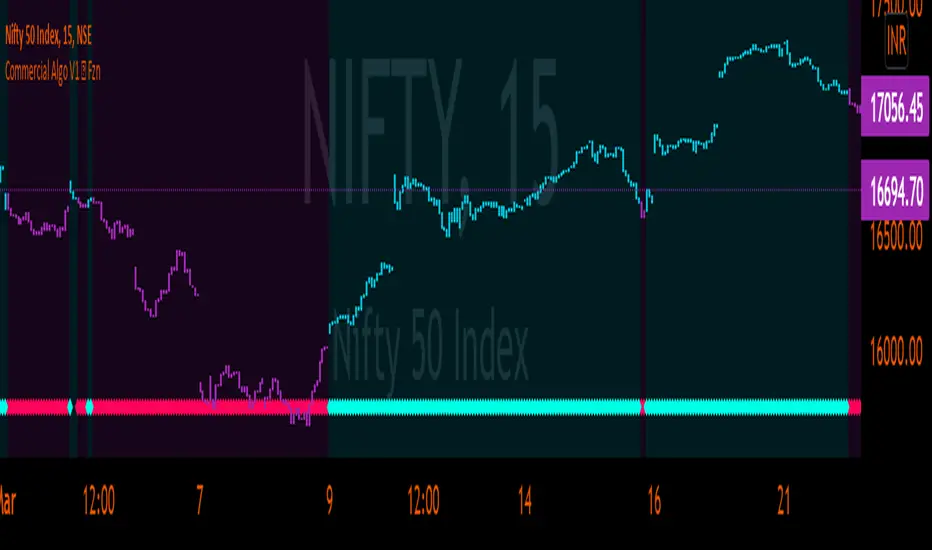
Commercial Algo Trend © Fzn V1Hello Traders,
Here i bring to you my 2nd Price Action Atr based Indictor combined with fib entry and exit trailing levels with minimum risk and maximum profit , as we must have seen at times as we enter the trend reverse and hits our stop losses . Keeping that in mind as i too struggled and made losses so i decided and focused more on minimizing the stop loss and only on confirmation of Long or Short trade is been initiated with proper Stop loss as explained in the images below , why should we give market our money ;) as we are here to make money :D .. There is no holy grail as Stop loss wont be hit but yes it will be way less and all alerts are based on candle close . One can use this on any chart and any timeframe and its very good for scalping too .ATR Trailing SL is added too just incase you want to enter and exit trend manually . Better results are on 15m and above . Hope you guys will like it and comment if you have any doubts..
-----------------
Disclaimer
Copyright by FaizanNawazz.
The information contained in my scripts/indicators/strategies/ideas does not constitute financial advice or a solicitation to buy or sell any securities of any type. I will not accept liability for any loss or damage, including without limitation any loss of profit, which may arise directly or indirectly from the use of or reliance on such information.
All investments involve risk, and the past performance of a security, industry, sector, market, financial product, trading strategy, or individual’s trading does not guarantee future results or returns. Investors are fully responsible for any investment decisions they make. Such decisions should be based solely on an evaluation of their financial circumstances, investment objectives, risk tolerance, and liquidity needs.
My scripts/indicators are only for educational purposes!
Happy Trading!
[Fedra Algotrading Strategy 2tp+L&S] Futures Long or ShortStrategy for crypto market, designed for automatic algorithmic trading with bots.
Can place long and short orders
Calculates your entries based on the breakout of the simple deviation of the linear regression of the last X periods.
Configures TP (green line) and SL (red line) percentages, the TP is a trailing TP.
Optionally, you can set a first TP (white line) that sells half of the position.
Advanced trend filter to not open trades against the market. SMA (yellow line), WMA (blue line) and secret sauce
Includes an advanced system to control the backtest period (choose how many days to backtest).
Risk management by volume of capital or amount of losing trades (kill switches that will exit the trade and stop the script)
The script includes default commissions of 0.2% per trade (configurable).
- Dinamic table with Price positions to plan your limit orders if you are trading manually
- Highly customizable and optimizable.
If you want to trade longs and shorts, it is advisable to create 2 different alerts. In most cases, the optimal parameters for longs are not the same as for shorts. In a forthcoming update I will enable separate configurations.
For better performance the script uses real time price information, for this reason Tradingview may warn you that there is "repainting", as the backtest information does not contain the information of each tick but only the open, close, high and low values of each candle.
To avoid this, you can disable the "calculate on every tick" option from the strategy settings panel.
Maddrix_club I - Scalper (3commas)Maddrix club I Scalper (3commas version). The code is very different from the ALERTATRON version.
It really is not the same!
Maddrix Club I is a simple, straightforward trading algorithm that goes long or short, based on user’s choice. It is considered to be a scalper, because it aims to capture small profits that accumulates and compound over time.
The theory behind it is based on trend following and DCA .
Strategy type one uses momentum to generate signals.
Strategy type two uses price action only
Very good results have been observed on the 1 min time frame though it technically works on all timeframe (5 min for example, 1 hour also). The most important part of this algorithm is risk management and capital preservation.
You can run this with very little capital, and always make sure that in the worst case scenario, meaning when the market goes against you and all your SO (Safety Orders) are filled, you are using less than your account balance.
If you are in a trending up phase on the weekly time frame, you can go long. If this is a definite trend down, of course go short. During a bear market, stay long, during a bull market, evidently long as well.
For totally new traders, I would recommend to LONG only, and set super low risk settings (cover a 50% drop for example), and see how it runs. Then, as you become a more experienced trader, you can identify trends and short as well, and/or increase your risk.
It works on all markets as long as there is volatility .
The best way to go about changing the settings, is to start off the default values. I’d run it and see how it fits your risk preferences.
There are absolutely no guarantees about this algorithm and past results are not indicative of future performance.
Fees, slippage and API delay: for any algorithm you will use (from me or others), please keep in mind that fees add up, slippage and delay creates differences between algo theory and reality. We can put in place systems to circumvent that, but we will always have them.
*** This one is SPECIAL 3COMMAS**

Level 1 - Learn to code simply - PineScriptThe goal of this script is honestly to help everyone learn about trading with bots and algos.
At least, to get started.
Level 1:
10 lines of code.
learn to plot 2 moving averages on your chart.
learn to create a signal from a crossover.
learn the very basics of Pine Script algo.

[Fedra Algotrading 2TPs]This strategy uses the deviation of a simple linear regression to determine the entry point into a short-term trend. It also includes an intelligent trend filter (SMA, WMA, Super trend and MACD), to determine the dominant trend over a longer time frame and avoid opening trades against the market.
It manages capital by dividing the position into 2 take profits, the first one configurable in a fixed percentage, which will sell half of the position, and the second one that will trigger a trailing take profit once the desired percentage is reached, with the rest of the position.
Each parameter is optimizable to adapt it to the desired market, but this strategy benefits from the high volatility of mid and low capitalization cryptocurrencies due to their higher volatility.
It also includes tools to adjust the backtests, and command inputs so that the script can automatically work with bots.
Responsive Magnetic Moving Average - BreatEasyTraders,
It's pretty difficult to judge which moving average is holding the price at present (Holding = Prices Respecting the moving average). some times prices respects 20 MA, 50MA or some other MA or EMA or HMA. Its dynamic in nature and changes based on the script we apply and the timeframe we use.
Having all these different types of moving averages added on to chart may sometime create a clutter. Hence I came up with an idea to summarize into one value which price is respecting.
Important options provided to help adjusting the strength value.
1. No Of Candles = set the number of candles to analyze for the strength. Note: setting the value too less will improve the performance but accuracy is depleted. setting the value to too high may improve accuracy but performance may be depleted.
Performance = calculation time.
2. Close By% = in order to check whether price is respecting the trendline set the % of ATR. This means that when prices are close to any of the moving averages then it checks for the strength of the moving average.
Plz do suggest for any feedback for improvements.
Regards
