Dynamic Buy/Sell VisualizationDynamic Trend Visualization Indicator
Description:
This simple and easy to use indicator has helped me stay in trades longer.
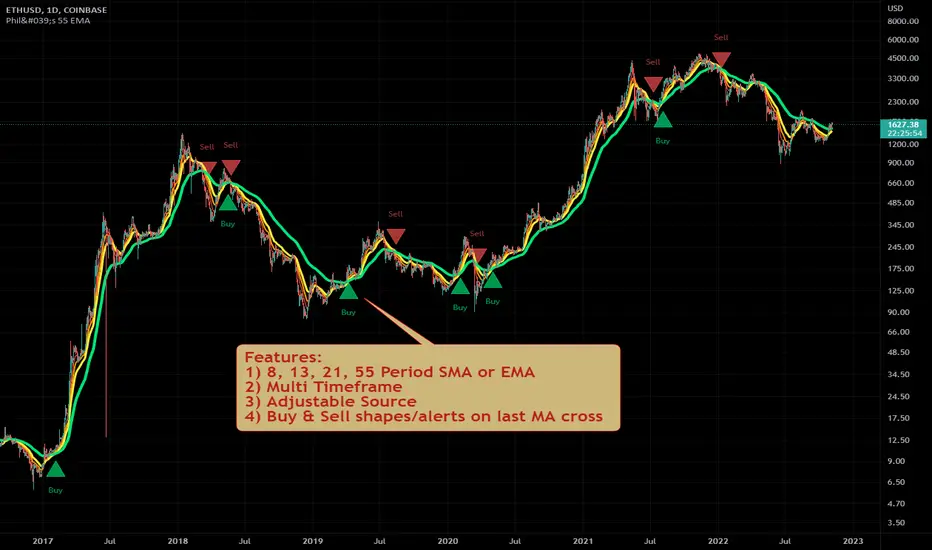
This indicator is designed to visually represent potential buy and sell signals based on the crossover of two Simple Moving Averages (SMA). It's crafted to assist traders in identifying trend directions in a straightforward manner, making it an excellent tool for both beginners and experienced traders.
Features:
Customizable Moving Averages: Users can adjust the period length for both short-term (default: 10) and long-term (default: 50) SMAs to suit their trading strategy.
Visual Signals: Dynamic lines appear at the points of SMA crossover, with labels to indicate 'BUY' or 'SELL' opportunities.
Color and Style Customization: Customize the appearance of the buy and sell lines for better chart readability.
Alert Functionality: Alerts are set up to notify users when a crossover indicating a buy or sell condition occurs.
How It Works:
A 'BUY' signal is generated when the short-term SMA crosses above the long-term SMA, suggesting an upward trend.
A 'SELL' signal is indicated when the short-term SMA crosses below the long-term SMA, pointing to a potential downward trend.
Use Cases:
Trend Following: Ideal for markets with clear trends. For example, if trading EUR/USD on a daily chart, setting the short SMA to 10 days and the long SMA to 50 days might help in capturing longer-term trends.
Scalping: In a volatile market, setting shorter periods (e.g., 5 for short SMA and 20 for long SMA) might catch quicker trend changes, suitable for scalping.
Examples of how to use
* Short-term for Quick Trades:
SMA 5 and SMA 21:
Purpose: This combination is tailored for day traders or those looking to engage in scalping. The 5 SMA will react rapidly to price changes, providing early signals for buy or sell opportunities. The 21 SMA, being a Fibonacci number, offers a slightly longer-term view to confirm the short-term trend, helping to filter out minor fluctuations that might lead to false signals.
* Middle-term for Swing Trading:
SMA 10 and SMA 50:
Purpose: Suited for swing traders who aim to capitalize on medium-term trends. The 10 SMA picks up on immediate market movements, while the 50 SMA gives insight into the medium-term direction. This setup helps in identifying when a short-term trend aligns with a longer-term trend, providing a good balance for trades that might last several days to a couple of weeks.
* Long-term Trading:
SMA 50 and SMA 200:
Purpose: Investors focusing on long-term trends would benefit from this pair. The crossover of the 50 SMA over the 200 SMA can indicate the beginning or end of major market trends, ideal for making decisions about long-term holdings that might span months or years.
Example Strategy if not using the Buy / Sell Label Alerts:
Entry Signal: Enter a long position when the shorter SMA crosses above the longer SMA. For example:
SMA 10 crosses above SMA 50 for a medium-term bullish signal.
Exit Signal: Consider exiting or initiating a short position when:
SMA 10 crosses below SMA 50, suggesting a bearish turn in the medium-term trend.
Confirmation: Use these crossovers in conjunction with other indicators like volume or momentum indicators for better confirmation. For instance, if you're using the 5/21 combination, look for volume spikes on crossovers to confirm the move's strength.
When Not to Use:
Sideways or Range-Bound Markets: The indicator might generate many false signals in a non-trending market, leading to potential losses.
High Volatility Without Clear Trends: Rapid price movements without a consistent direction can result in misleading crossovers.
As a Standalone Tool: It should not be used in isolation. Combining with other indicators like RSI or MACD for confirmation can enhance trading decisions.
Practical Example:
Buy Signal: If you're watching Apple Inc. (AAPL) on a weekly chart, a crossover where the 10-week SMA moves above the 50-week SMA could suggest a buying opportunity, especially if confirmed by volume increase or other technical indicators.
Sell Signal: Conversely, if the 10-week SMA dips below the 50-week SMA, it might be time to consider selling, particularly if other bearish signals are present.
Conclusion:
The "Dynamic Trend Visualization" indicator provides a visual aid for trend-following strategies, offering customization and alert features to streamline the trading process. However, it's crucial to use this in conjunction with other analysis methods to mitigate the risks of false signals or market anomalies.
Legal Disclaimer:
This indicator is for educational purposes only. It does not guarantee profits or provide investment advice. Trading involves risk; please conduct thorough or consult with a financial advisor. The creator is not responsible for any losses incurred. By using this indicator, you agree to these terms.
Alertsignals

Outlier changes alertAn indicator that calculates click (price change), percentage change, and Z-score changes while displaying outliers based on defined ranges.
Outlier Detection:
Mark outliers (for price, percentage, Z-score) based on user-defined thresholds. For example, any price movement exceeding a certain Z-score or percentage change could be marked as an outlier and displayed on chart.
Indicator Overview:
1. Click (Price Change):
Calculate the absolute price change from one period to another (e.g., from the current closing price to the previous closing price).
2. Percentage Change:
Calculate the percentage price change over a specific period, showing how much the price has changed in relative terms compared to the previous price.
3. Z-Score:
Compute the Z-score to standardize the price change relative to its historical average and standard deviation. The Z-score helps in detecting whether a price movement is an outlier or falls within a normal range of volatility.

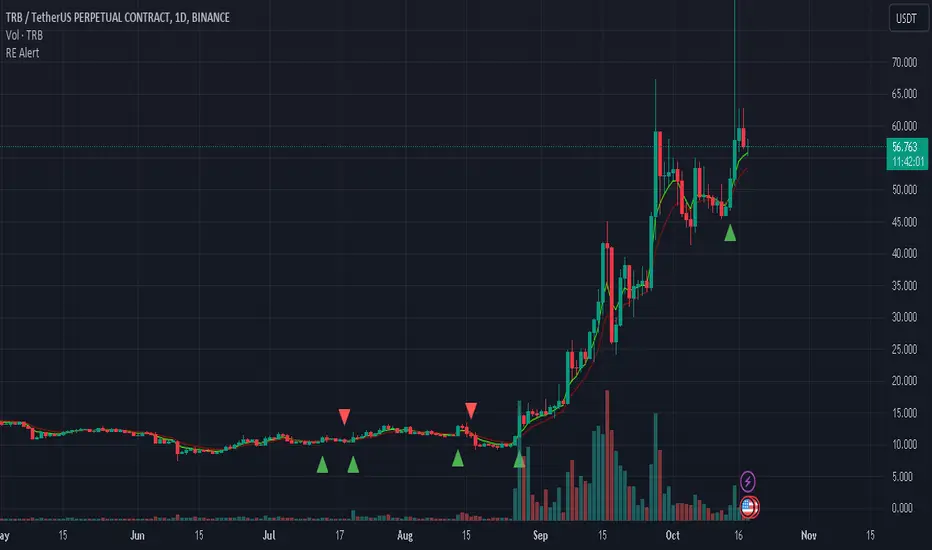
Alligator + Fractals + Divergent & Squat Bars + Signal AlertsThe indicator includes Williams Alligator, Williams Fractals, Divergent Bars, Market Facilitation Index, Highest and Lowest Bars, maximum and minimum peak of Awesome Oscillator, and signal alerts based on Bill Williams' Profitunity strategy.
MFI and Awesome Oscillator
According to the Market Facilitation Index Oscillator, the Squat bar is colored blue, all other bars are colored according to the Awesome Oscillator color, except for the Fake bars, colored with a lighter AO color. In the indicator settings, you can enable the display of "Green" bars (in the "Green Bars > Show" field). In the indicator style settings, you can disable changing the color of bars in accordance with the AO color (in the "AO bars" field), including changing the color for Fake bars (in the "Fake AO bars" field).
MFI is calculated using the formula: (high - low) / volume.
A Squat bar means that, compared to the previous bar, its MFI has decreased and at the same time its volume has increased, i.e. MFI < previous bar and volume > previous bar. A sign of a possible price reversal, so this is a particularly important signal.
A Fake bar is the opposite of a Squat bar and means that, compared to the previous bar, its MFI has increased and at the same time its volume has decreased, i.e. MFI > previous bar and volume < previous bar.
A "Green" bar means that, compared to the previous bar, its MFI has increased and at the same time its volume has increased, i.e. MFI > previous bar and volume > previous bar. A sign of trend continuation. But a more significant trend confirmation or warning of a possible reversal is the Awesome Oscillator, which measures market momentum by calculating the difference between the 5 Period and 34 Period Simple Moving Averages (SMA 5 - SMA 34) based on the midpoints of the bars (hl2). Therefore, by default, the "Green" bars and their opposite "Fade" bars are colored according to the color of the Awesome Oscillator.
According to Bill Williams' Profitunity strategy, using the Awesome Oscillator, the third Elliott wave is determined by the maximum peak of AO in the range from 100 to 140 bars. The presence of divergence between the maximum AO peak and the subsequent lower AO peak in this interval also warns of a possible correction, especially if the AO crosses the zero line between these AO peaks. Therefore, the chart additionally displays the prices of the highest and lowest bars, as well as the maximum or minimum peak of AO in the interval of 140 bars from the last bar. In the indicator settings, you can hide labels, lines, change the number of bars and any parameters for the AO indicator - method (SMA, Smoothed SMA, EMA and others), length, source (open, high, low, close, hl2 and others).
Bullish Divergent bar
🟢 A buy signal (Long) is a Bullish Divergent bar with a green circle displayed above it if such a bar simultaneously meets all of the following conditions:
The high of the bar is below all lines of the Alligator indicator.
The closing price of the bar is above its middle, i.e. close > (high + low) / 2.
The low of the bar is below the low of 2 previous bars or below the low of one previous bar, and the low of the second previous bar is a lower fractal (▼). By default, Divergent bars are not displayed, the low of which is lower than the low of only one previous bar and the low of the 2nd previous bar is not a lower fractal (▼), but you can enable the display of any Divergent bars in the indicator settings (by setting the value "no" in the " field Divergent Bars > Filtration").
The following conditions strengthen the Bullish Divergent bar signal:
The opening price of the bar, as well as the closing price, is higher than its middle, i.e. Open > (high + low) / 2.
The high of the bar is below all lines of the open Alligator indicator, i.e. the green line (Lips) is below the red line (Teeth) and the red line is below the blue line (Jaw). In this case, the color of the circle above the Bullish Divergent bar is dark green.
Squat Divergent bar.
The bar following the Bullish Divergent bar corresponds to the green color of the Awesome Oscillator.
Divergence on Awesome Oscillator.
Formation of the lower fractal (▼), in which the low of the Divergent bar is the peak of the fractal.
Bearish Divergent bar
🔴 A signal to sell (Short) is a Bearish Divergent bar under which a red circle is displayed if such a bar simultaneously meets all the following conditions:
The low of the bar is above all lines of the Alligator indicator.
The closing price of the bar is below its middle, i.e. close < (high + low) / 2.
The high of the bar is higher than the high of 2 previous bars or higher than the high of one previous bar, and the high of the second previous bar is an upper fractal (▲). By default, Divergent bars are not displayed, the high of which is higher than the high of only one previous bar and the high of the 2nd previous bar is not an upper fractal (▲), but you can enable the display of any Divergent bars in the indicator settings (by setting the value "no" in the " field Divergent Bars > Filtration").
The following conditions strengthen the Bearish Divergent bar signal:
The opening price of the bar, as well as the closing price, is below its middle, i.e. open < (high + low) / 2.
The low of the bar is above all lines of the open Alligator indicator, i.e. the green line (Lips) is above the red line (Teeth) and the red line is above the blue line (Jaw). In this case, the color of the circle under the Bearish Divergent bar is dark red.
Squat Divergent bar.
The bar following the Bearish Divergent bar corresponds to the red color of the Awesome Oscillator.
Divergence on Awesome Oscillator.
Formation of the upper fractal (▲), in which the high of the Divergent bar is the peak of the fractal.
Alligator lines crossing
Bars crossing the green line (Lips) of the open Alligator indicator is the first warning of a possible correction (price rollback) if one of the following conditions is met:
If the bar closed below the Lips line, which is above the Teeth line, and the Teeth line is above the Jaw line, while the closing price of the previous bar is above the Lips line.
If the bar closed above the Lips line, which is below the Teeth line, and the Teeth line is below the Jaw line, while the closing price of the previous bar is below the Lips line.
The intersection of all open Alligator lines by bars is a sign of a deep correction and a warning of a possible trend change.
Frequent intersection of Alligator lines with each other is a sign of a sideways trend (flat).
Signal Alerts
To receive notifications about signals when creating an alert, you must select the condition "Any alert() function is call", in which case notifications will arrive in the following format:
D — timeframe, for example: D, 4H, 15m.
🟢 BDB⎾ - a signal for a Bullish Divergent bar to buy (Long), triggers once after the bar closes and includes additional signals:
/// — if Alligator is open.
⏉ — if the opening price of the bar, as well as the closing price, is above its middle.
+ Squat 🔷 - Squat bar or + Green ↑ - "Green" bar or + Fake ↓ - Fake bar.
+ AO 🟩 - if after the Divergent bar closes, the oscillator color change for the next bar corresponds the green color of the Awesome Oscillator. ┴/┬ — AO above/below the zero line. ∇ — if there is divergence on AO in the interval of 140 bars from the last bar.
🔴 BDB⎿ - a signal for a Bearish Divergent bar to sell (Short), triggers once after the bar closes and includes additional signals:
/// — if Alligator is open.
⏊ — if the opening price of the bar, as well as the closing price, is below its middle.
+ Squat 🔷 - Squat bar or + Green ↑ - "Green" bar or + Fake ↓ - Fake bar.
+ AO 🟥 - if after the Divergent bar closes, the oscillator color change for the next bar corresponds to the red color of the Awesome Oscillator. ┴/┬ — AO above/below the zero line. ∇ — if there is divergence on AO in the interval of 140 bars from the last bar.
Alert for bars crossing the green line (Lips) of the open Alligator indicator (can be disabled in the indicator settings in the "Alligator > Enable crossing lips alerts" field):
🔴 Crossing Lips ↓ - if the bar closed below the Lips line, which is above than the other lines, while the closing price of the previous bar is above the Lips line.
🟢 Crossing Lips ↑ - if the bar closed above the Lips line, which is below the other lines, while the closing price of the previous bar is below the Lips line.
The fractal signal is triggered after the second bar closes, completing the formation of the fractal, if alerts about fractals are enabled in the indicator settings (the "Fractals > Enable alerts" field):
🟢 Fractal ▲ - upper (Bearish) fractal.
🔴 Fractal ▼ — lower (Bullish) fractal.
⚪️ Fractal ▲/▼ - both upper and lower fractal.
↳ (H=high - L=low) = difference.
If you redirect notifications to a webhook URL, for example, to a Telegram bot, then you need to set the notification template for the webhook in the indicator settings in the "Webhook > Message" field (contains a tooltip with an example), in which you just need to specify the text {{message}}, which will be automatically replaced with the alert text with a ticker and a link to TradingView.
‼️ A signal is not a call to action, but only a reason to analyze the chart to make a decision based on the rules of your strategy.
***
Индикатор включает в себя Williams Alligator, Williams Fractals, Дивергентные бары, Market Facilitation Index, самый высокий и самый низкий бары, максимальный и минимальный пик Awesome Oscillator, а также оповещения о сигналах на основе стратегии Profitunity Билла Вильямса.
MFI и Awesome Oscillator
В соответствии с осциллятором Market Facilitation Index Приседающий бар окрашен в синий цвет, все остальные бары окрашены в соответствии с цветом Awesome Oscillator, кроме Фальшивых баров, которые окрашены более светлым цветом AO. В настройках индикатора вы можете включить отображение "Зеленых" баров (в поле "Green Bars > Show"). В настройках стиля индикатора вы можете выключить изменение цвета баров в соответствии с цветом AO (в поле "AO bars"), в том числе изменить цвет для Фальшивых баров (в поле "Fake AO bars").
MFI рассчитывается по формуле: (high - low) / volume.
Приседающий бар означает, что по сравнению с предыдущим баром его MFI снизился и в тоже время вырос его объем, т.е. MFI < предыдущего бара и объем > предыдущего бара. Признак возможного разворота цены, поэтому это особенно важный сигнал.
Фальшивый бар является противоположностью Приседающему бару и означает, что по сравнению с предыдущим баром его MFI увеличился и в тоже время снизился его объем, т.е. MFI > предыдущего бара и объем < предыдущего бара.
"Зеленый" бар означает, что по сравнению с предыдущим баром его MFI увеличился и в тоже время вырос его объем, т.е. MFI > предыдущего бара и объем > предыдущего бара. Признак продолжения тренда. Но более значимым подтверждением тренда или предупреждением о возможном развороте является Awesome Oscillator, который измеряет движущую силу рынка путем вычисления разницы между 5 Периодной и 34 Периодной Простыми Скользящими Средними (SMA 5 - SMA 34) по средним точкам баров (hl2). Поэтому по умолчанию "Зеленые" бары и противоположные им "Увядающие" бары окрашены в соответствии с цветом Awesome Oscillator.
По стратегии Profitunity Билла Вильямса с помощью осциллятора Awesome Oscillator определяется третья волна Эллиота по максимальному пику AO в интервале от 100 до 140 баров. Наличие дивергенции между максимальным пиком AO и следующим за ним более низким пиком AO в этом интервале также предупреждает о возможной коррекции, особенно если AO переходит через нулевую линию между этими пиками AO. Поэтому на графике дополнительно отображаются цены самого высокого и самого низкого баров, а также максимальный или минимальный пик АО в интервале 140 баров от последнего бара. В настройках индикатора вы можете скрыть метки, линии, изменить количество баров и любые параметры для индикатора AO – метод (SMA, Smoothed SMA, EMA и другие), длину, источник (open, high, low, close, hl2 и другие).
Бычий Дивергентный бар
🟢 Сигналом на покупку (Long) является Бычий Дивергентный бар над которым отображается зеленый круг, если такой бар соответствует одновременно всем следующим условиям:
Максимум бара ниже всех линий индикатора Alligator.
Цена закрытия бара выше его середины, т.е. close > (high + low) / 2.
Минимум бара ниже минимума 2-х предыдущих баров или ниже минимума одного предыдущего бара, а минимум второго предыдущего бара является нижним фракталом (▼). По умолчанию не отображаются Дивергентные бары, минимум которых ниже минимума только одного предыдущего бара и минимум 2-го предыдущего бара не является нижним фракталом (▼), но вы можете включить отображение любых Дивергентных баров в настройках индикатора (установив значение "no" в поле "Divergent Bars > Filtration").
Усилением сигнала Бычьего Дивергентного бара являются следующие условия:
Цена открытия бара, как и цена закрытия, выше его середины, т.е. Open > (high + low) / 2.
Максимум бара ниже всех линий открытого индикатора Alligator, т.е. зеленая линия (Lips) ниже красной линии (Teeth) и красная линия ниже синей линии (Jaw). В этом случае цвет круга над Бычьим Дивергентным баром окрашен в темно-зеленый цвет.
Приседающий Дивергентный бар.
Бар, следующий за Бычьим Дивергентным баром, соответствует зеленому цвету Awesome Oscillator.
Дивергенция на Awesome Oscillator.
Образование нижнего фрактала (▼), у которого минимум Дивергентного бара является пиком фрактала.
Медвежий Дивергентный бар
🔴 Сигналом на продажу (Short) является Медвежий Дивергентный бар под которым отображается красный круг, если такой бар соответствует одновременно всем следующим условиям:
Минимум бара выше всех линий индикатора Alligator.
Цена закрытия бара ниже его середины, т.е. close < (high + low) / 2.
Максимум бара выше маскимума 2-х предыдущих баров или выше максимума одного предыдущего бара, а максимум второго предыдущего бара является верхним фракталом (▲). По умолчанию не отображаются Дивергентные бары, максимум которых выше максимума только одного предыдущего бара и максимум 2-го предыдущего бара не является верхним фракталом (▲), но вы можете включить отображение любых Дивергентных баров в настройках индикатора (установив значение "no" в поле "Divergent Bars > Filtration").
Усилением сигнала Медвежьего Дивергентного бара являются следующие условия:
Цена открытия бара, как и цена закрытия, ниже его середины, т.е. open < (high + low) / 2.
Минимум бара выше всех линий открытого индикатора Alligator, т.е. зеленая линия (Lips) выше красной линии (Teeth) и красная линия выше синей линии (Jaw). В этом случае цвет круга под Медвежьим Дивергентным Баром окрашен в темно-красный цвет.
Приседающий Дивергентный бар.
Бар, следующий за Медвежьим Дивергентным баром, соответствует красному цвету Awesome Oscillator.
Дивергенция на Awesome Oscillator.
Образование верхнего фрактала (▲), у которого максимум Дивергентного бара является пиком фрактала.
Пересечение линий Alligator
Пересечение барами зеленой линии (Lips) открытого индикатора Alligator является первым предупреждением о возможной коррекции (откате цены) при выполнении одного из следующих условий:
Если бар закрылся ниже линии Lips, которая выше линии Teeth, а линия Teeth выше линии Jaw, при этом цена закрытия предыдущего бара находится выше линии Lips.
Если бар закрылся выше линии Lips, которая ниже линии Teeth, а линия Teeth ниже линии Jaw, при этом цена закрытия предыдущего бара находится ниже линии Lips.
Пересечение барами всех линий открытого Alligator является признаком глубокой коррекции и предупреждением о возможной смене тренда.
Частое пересечение линий Alligator между собой является признаком бокового тренда (флэт).
Оповещения о сигналах
Для получения уведомлений о сигналах при создании оповещения необходимо выбрать условие "При любом вызове функции alert()", в таком случае уведомления будут приходить в следующем формате:
D — таймфрейм, например: D, 4H, 15m.
🟢 BDB⎾ — сигнал Бычьего Дивергентного бара на покупку (Long), срабатывает один раз после закрытия бара и включает дополнительные сигналы:
/// — если Alligator открыт.
⏉ — если цена открытия бара, как и цена закрытия, выше его середины.
+ Squat 🔷 — Приседающий бар или + Green ↑ — "Зеленый" бар или + Fake ↓ — Фальшивый бар.
+ AO 🟩 — если после закрытия Дивергентного бара, изменение цвета осциллятора для следующего бара соответствует зеленому цвету Awesome Oscillator. ┴/┬ — AO выше/ниже нулевой линии. ∇ — если есть дивергенция на AO в интервале 140 баров от последнего бара.
🔴 BDB⎿ — сигнал Медвежьего Дивергентного бара на продажу (Short), срабатывает один раз после закрытия бара и включает дополнительные сигналы:
/// — если Alligator открыт.
⏊ — если цена открытия бара, как и цена закрытия, ниже его середины.
+ Squat 🔷 — Приседающий бар или + Green ↑ — "Зеленый" бар или + Fake ↓ — Фальшивый бар.
+ AO 🟥 — если после закрытия Дивергентного бара, изменение цвета осциллятора для следующего бара соответствует красному цвету Awesome Oscillator. ┴/┬ — AO выше/ниже нулевой линии. ∇ — если есть дивергенция на AO в интервале 140 баров от последнего бара.
Сигнал пересечения барами зеленой линии (Lips) открытого индикатора Alligator (можно отключить в настройках индикатора в поле "Alligator > Enable crossing lips alerts"):
🔴 Crossing Lips ↓ — если бар закрылся ниже линии Lips, которая выше остальных линий, при этом цена закрытия предыдущего бара находится выше линии Lips.
🟢 Crossing Lips ↑ — если бар закрылся выше линии Lips, которая ниже остальных линий, при этом цена закрытия предыдущего бара находится ниже линии Lips.
Сигнал фрактала срабатывает после закрытия второго бара, завершающего формирование фрактала, если оповещения о фракталах включены в настройках индикатора (поле "Fractals > Enable alerts"):
🟢 Fractal ▲ — верхний (Медвежий) фрактал.
🔴 Fractal ▼ — нижний (Бычий) фрактал.
⚪️ Fractal ▲/▼ — одновременно верхний и нижний фрактал.
↳ (H=high - L=low) = разница.
Если вы перенаправляете оповещения на URL вебхука, например, в бота Telegram, то вам необходимо установить шаблон оповещения для вебхука в настройках индикатора в поле "Webhook > Message" (содержит подсказку с примером), в котором в качестве текста сообщения достаточно указать текст {{message}}, который будет автоматически заменен на текст оповещения с тикером и ссылкой на TradingView.
‼️ Сигнал — это не призыв к действию, а лишь повод проанализировать график для принятия решения на основе правил вашей стратегии.

QQE MOD + SSL Hybrid + Waddah Attar Explosion IndicatorINDICATOR PURPOSE
This indicator is designed to complement my original QQE MOD + SSL Hybrid + Waddah Attar Explosion strategy.
Multiple users have requested that I convert the strategy to an indicator because alertconditions do not work on strategies and people want to specific set alerts for BUY, SELL, CLOSE BUY and CLOSE SELL. This can only be achieved using alertcondition().
This indicator functions in the exact same way as the strategy, but it doesn't have any backtesting functionality. I recomment that you use the original QQE MOD + SSL Hybrid + Waddah Attar Explosion strategy for parameter tuning and backtesting, then if you need more control on alerts you can use this indicator for that purpose.
Only other difference is that I have added grey exit labels on the chart since it's not obvious where the exits would happen like it was in the strategy version.
CREDITS
QQE MOD byMihkel00
SSL Hybrid by Mihkel00
Waddah Attar Explosion by shayankm

Overbought / Oversold Screener## Introduction
**The Versatile RSI and Stochastic Multi-Symbol Screener**
**Unlock a wealth of trading opportunities with this customizable screener, designed to pinpoint potential overbought and oversold conditions across 17 symbols, with alert support!**
## Description
This screener is suitable for tracking multiple instruments continuously.
With the screener, you can see the instant RSI or Stochastic values of the instruments you are tracking, and easily catch the moments when they are overbought / oversold according to your settings.
The purpose of the screener is to facilitate the continuous tracking of multiple instruments. The user can track up to 17 different instruments in different time intervals. If they wish, they can set an alarm and learn overbought oversold according to the values they set for the time interval of the instruments they are tracking.**
Key Features:
Comprehensive Analysis:
Monitors RSI and Stochastic values for 17 symbols simultaneously.
Automatically includes the current chart's symbol for seamless integration.
Supports multiple timeframes to uncover trends across different time horizons.
Personalized Insights:
Adjust overbought and oversold thresholds to align with your trading strategy.
Sort results by symbol, RSI, or Stochastic values to prioritize your analysis.
Choose between Automatic, Dark, or Light mode for optimal viewing comfort.
Dynamic Visual Cues:
Instantly highlights oversold and overbought symbols based on threshold levels.
Timely Alerts:
Stay informed of potential trading opportunities with alerts for multiple oversold or overbought symbols.
## Settings
### Display
**Timeframe**
The screener displays the values according to the selected timeframe. The default timeframe is "Chart". For example, if the timeframe is set to "15m" here, the screener will show the RSI and stochastic values for the 15-minute chart.
** Theme **
This setting is for changing the theme of the screener. You can set the theme to "Automatic", "Dark", or "Light", with "Automatic" being the default value. When the "Automatic" theme is selected, the screener appearance will also be automatically updated when you enable or disable dark mode from the TradingView settings.
** Position **
This option is for setting the position of the table on the chart. The default setting is "middle right". The available options are (top, middle, bottom)-(left, center, right).
** Sort By **
This option is for changing the sorting order of the table. The default setting is "RSI Descending". The available options are (Symbol, RSI, Stoch)-(Ascending, Descending).
It is important to note that the overbought and oversold coloring of the symbols may also change when the sorting order is changed. If RSI is selected as the sorting order, the symbols will be colored according to the overbought and oversold threshold values specified for RSI. Similarly, if Stoch is selected as the sorting order, the symbols will be colored according to the overbought and oversold threshold values specified for Stoch.
From this perspective, you can also think of the sorting order as a change in the main indicator.
### RSI / Stochastic
This area is for selecting the parameters of the RSI and stochastic indicators. You can adjust the values for "length", "overbought", and "oversold" for both indicators according to your needs. The screener will perform all RSI and stochastic calculations according to these settings. All coloring in the table will also be according to the overbought and oversold values in these settings.
### Symbols
The symbols to be tracked in the table are selected from here. Up to 16 symbols can be selected from here. Since the symbol in the chart is automatically added to the table, there will always be at least 1 symbol in the table. Note that the symbol in the chart is shown in the table with "(C)". For example, if SPX is open in the chart, it is shown as SPX(C) in the table.
## Alerts
The screener is capable of notifying you with an alarm if multiple symbols are overbought or oversold according to the values you specify along with the desired timeframe. This way, you can instantly learn if multiple symbols are overbought or oversold with one alarm, saving you time.

REMA CROSSOVER BY JUGNUThis indicator triggers alerts for long and short positions on DAILY TIME FRAME for SWING trades based on the conditions which described below. This script will generate alerts when the following conditions are met:
LONG POSITION:
RSI(14) above 50.
EMA(5) crosses above EMA(10).
Indicator Triangle Green below price bars
SHORT POSITION:
RSI(14) below 50.
EMA(5) crosses down EMA(10).
Indicator Triangle RED above price bars
This script plots green and red triangles below and above the price bars to indicate long and short alert conditions, respectively. It also triggers alerts when these conditions are met.
Crypto Spot/Futures Dominance Indicator with AlertsFutures/Spot Dominance Indicator:
Overview:
The futures/spot dominance indicator is a versatile tool used by traders and analysts to assess the relative strength or dominance of the futures market in relation to the spot (or cash) market for a specific asset. It offers insights into market sentiment, potential arbitrage opportunities, and risk management while incorporating the VWAP indicator for added context.
How It Works:
This indicator automatically detects and adapts to the futures symbol applied to the chart, simplifying the setup for traders. However, it still necessitates manual input of the corresponding spot pair to ensure accuracy.
Automatic Futures Symbol Detection: The indicator starts by automatically detecting the futures symbol on the trading chart, eliminating the need for manual configuration. This ensures that the indicator is applied to the correct futures contract.
Manual Spot Pair Entry: To provide a reliable reference point for the comparison, traders must manually input the corresponding spot symbol via the indicator's inputs. For instance, if the indicator detects the BTCUSDT.P futures symbol, traders would manually enter the BTCUSDT spot symbol.
Gathering Data: The indicator collects historical price data for both the detected futures contract and the manually specified spot symbol. This data includes open, high, low, and close prices, as well as trading volume.
VWAP Calculation: To gain a deeper understanding of price trends and market dynamics, the indicator calculates the VWAP (Volume Weighted Average Price) for both the futures and spot markets. The VWAP places more weight on prices with higher trading volume, offering a weighted average that reflects market consensus.
Premium/Discount Calculation: By subtracting the VWAP of the spot market from the VWAP of the futures market, the indicator quantifies the premium or discount of the futures price concerning the spot price. A positive value indicates a premium, while a negative value suggests a discount.
Plotting: The premium/discount value is displayed as a line on the chart, often alongside moving averages or other smoothing techniques for improved trend analysis.
Alerts: In addition to its analysis capabilities, this indicator now includes alerts to enhance your trading experience. It alerts you in the following scenarios:
Premium Above Average: Notifies you when the premium crosses above the average line.
Premium Below Average: Alerts you when the premium crosses below the average line.
Premium Above Zero: Provides an alert when the premium crosses above the zero line.
Premium Below Zero: Generates an alert when the premium crosses below the zero line.
Benefits of the Futures/Spot Dominance Indicator:
Sentiment Analysis: Traders use the indicator to assess market sentiment. A futures premium might signify bullish sentiment, while a discount could indicate bearish sentiment.
Arbitrage Opportunities: Identifying price discrepancies between futures and spot markets can help traders spot arbitrage opportunities, where they can profit from price differentials.
Risk Management: The indicator assists in evaluating risks associated with futures positions, helping traders manage their exposure effectively.
Trend Confirmation: When used in conjunction with other technical indicators, futures/spot dominance, along with VWAP, can provide additional confirmation of price trends.
Hedging: Investors and corporations use this tool to gauge the effectiveness of hedging strategies based on futures contracts.
Speculative Trading: Traders and investors use the indicator to inform speculative positions, aligning their trades with perceived market strength or weakness.
Insightful Analysis: Futures/spot dominance analysis, enriched by VWAP data, offers insights into market behavior during specific events or changes in economic conditions.
In summary, the futures/spot dominance indicator, with its integration of VWAP and automatic futures symbol detection, provides traders and investors with a comprehensive tool to assess market dynamics. It aids in sentiment analysis, risk management, and trend confirmation while offering potential arbitrage opportunities. The newly added alerts enhance the indicator's functionality, providing timely notifications of key market events. However, it relies on manual input of the corresponding spot pair to ensure precise comparisons between futures and spot markets. It should be used alongside other analysis techniques for a well-rounded view of the market.

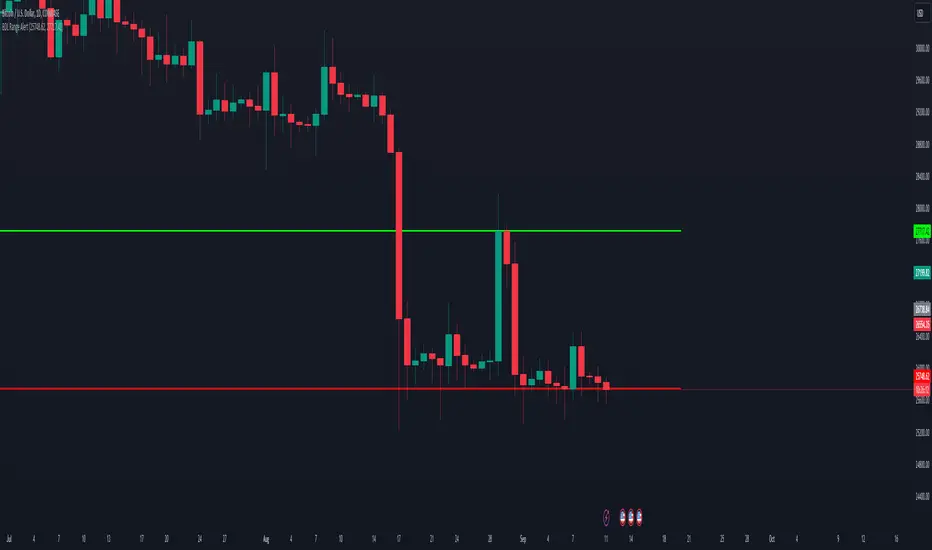
BDL Range AlertAs soon as you call this indicator, it asks you to define the range. Select the bottom and the top of the range. Next, set your alarm. There are 3 alarm options:
1: Bottom of the range breakout
2: Top of the range breakout
3: Bottom or top of the range breakout
As soon as you close a candle outside the selected range, only then will the alarm be triggered.
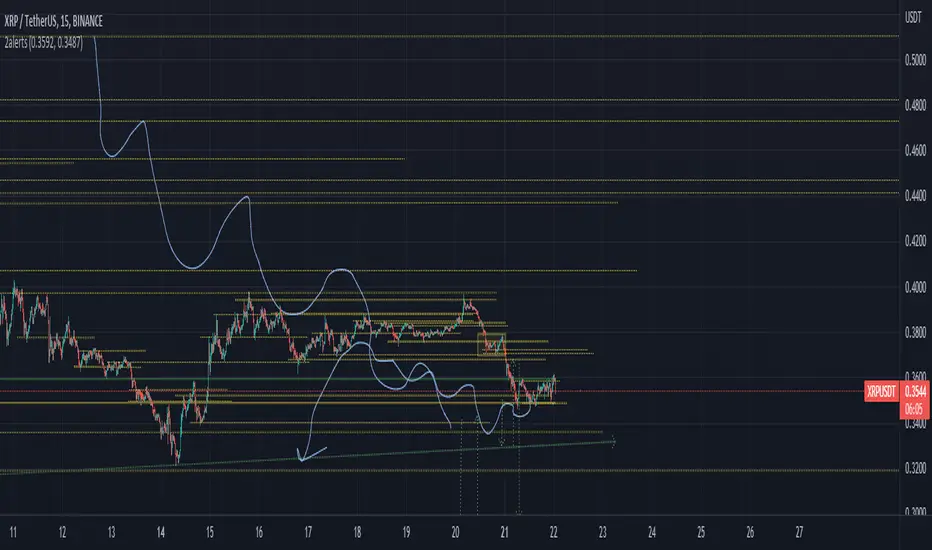
(2) Two AlertsCurrent Trading View free plan allows only ONE active alert.
This simple indicator Allows to trigger this ONE and ONLY alert when price reaches Higher, or Lower price level.
You can set levels and turn alerts for them on/off in settings, or by just drag-n-dropping Horizontal lines on the chart.
To set the only alert you need to create new alert, and change it's following parameters :
condition : 2alerts
Any alert function() call
Feel free to modify it on your needs.
Crossover Alerts for Yesterday O/H/L/C , Today Vwap [Zero54]This is a very simple script/indicator that trigger alerts every time the script triggers the following conditions.
1) Script crosses yesterday's (previous day's) high
2) Script crosses yesterday's (previous day's) low
3) Script crosses yesterday's (previous day's) open
4) Script crosses yesterday's (previous day's) close
5) Script crosses today's vwap.
I developed this to keep track of the scripts I follow and I find it useful. Hope you will find it useful too.
Steps to use:
1) Open the ticker for which you want to set the alerts.
2) Add this indicator to the chart.
3) Right Click on the text and set choose "Add Alert"
4) After you have done with setting up the alert, feel free to remove the indicator from the chart. It is not necessary for the indicator to be added in the chart in order for it to work.
5) Repeat 1-4 for all the scripts for which you want to set the alerts.
Be advised: During market open, if you have set alerts for multiple scripts, a tsunami of alerts may be triggered.
If you like this alert indicator, please like/boost it. Feel free to re-use this code however you may wish to. Cheers!

Signal generatorThis simple script generates signals for testing the connection from TradingView to a REST API client via the webhook and demonstrates very basic concepts of gerenating alerts within the script.
This script also demonstrates how to visualize when a buy or a sell should take place and how to use diagnostics text for bug fixes/informational purposes.
This is for testing and learning only. Do not use with real money as losses WILL occur. This script is for educational purposes only and should only be used with demo accounts, never with real money .
Buy signals are generated when closing price is less then opening price.
Sell Signals are generated when closing price is greater then opening price.
Can also be used to test signal counting and very rudimentary dollar cost averaging.

VolT by empowerTVolT is conceived to expose and alert volume volatility.
Using 21-candle moving average volume values compared to the current candle volume, you can graphically see the volume as it comes in - as a percentage of the historic 1X volume moving average.
Getting close to 2X or 5X of the 21-candle SMA? Just glance at the transparent plots behind the volume bars - or the actual percentage value in yellow.
Never wonder again how much volume that bar is compared to previous volume - now you know. Set alerts based on the volume crossing your chosen volume SMA. You'll never be surprised that the hedgies loaded up and left you behind, because you'll be right there loading up with them. (Let me know if you need help setting the alerts...)
As always, your feedback and criticisms are appreciated.
Multi-timeframe MAs + Stoch RSI SignalsHello traders,
I welcome you to my first published script on TradingView: “Multi-timeframe Moving Averages + Stochastic RSI”.
The script is based on a simple formula: Buy signals are generated when a fast moving average is above a slower moving average (uptrend) and the Stochastic RSI K line is crossing above the oversold level (entry).
Sell signals are generated when a fast moving average is below a slower moving average (downtrend) and the Stochastic RSI K line is crossing below the overbought level (entry).
This indicator works best in strong trends!
**Please note the above example has repainting turned on which may produce unrealistic results when viewing historical data. See below for more information regarding this and how you can turn it off.**
The user has the following inputs:
- Option to change the Stochastic RSI settings, including the oversold and overbought levels.
- Option to enter any value for both the Fast Moving Average and the Slow Moving Average.
- Option to change between EMA or SMA for each moving average.
- Multiple time frames to choose from, as well as the ability to selectively turn off individual time frames (both plots and alerts).
(Default time frames are 1 hour, 4 hour, and Daily. You can have a 4th time frame by changing your current time frame to something lower than the other 3 time frames)
- Turn on/off repainting: If repainting is turned on you will get an alert and buy/sell signal on chart immediately when condition is met, however the signal may disappear from chart if the condition reverses during the same candle.
If repainting is turned off, the indicator will wait for the candle to close before issuing the alert and painting the signal on chart.
For higher time frames, the indicator will wait for the candle in the higher time frame to close before issuing a signal if repaint is turned off. Default is set to Repaint on, so please be aware of this if you do not want repainting.
How to use alerts:
- Before you do anything, make sure your current time frame is the lowest time frame you’d like alerts on, as you will still receive alerts for the higher time frames you selected in settings.
- Once you have all the settings changed to how you like, save your chart first. Then right click on any of the indicator’s buy/sell signals on the chart and click “Add Alert on MAs + Stoch RSI”.
- Make sure “Any alert() function call” is selected under the Condition.
- You can delete or change the text in “Alert name” if you want as the alert message is already built into the indicator, and it will tell you in the alert message which asset and time frame to buy or sell.
Other things to note:
- The indicator will not display the buy/sell signals of lower time frames when you are on a higher time frame. This was done purposely to reduce clutter on the chart when you switch to higher time frames.
- While the alert message will tell you which time frame a signal was generated, the plots on the chart will instead show “Buy/Sell TF1, or TF2, or TF3”.
If the signal is from the current time frame that the alert was created on, then it will simply show “Buy” or “Sell”.
Hope you guys enjoy using this one, please drop a like if you found it useful. If anyone wants to modify my script in any way, please just credit me for the original work when you publish the script. Good luck!

Custom Screener with Alerts V2 [QuantNomad]TradingView just recently announced the alert() function that allows you to create dynamic alerts from both strategies and studies.
So I decided to update custom screener I published before. It was based on alerts from orders in strategies, that was the only way to create dynamic alerts in PineScript at that point.
With the alert() function code become cleaner and more readable.
It works for up to 40 symbols at the same time.
You can create an alert from it easily by selecting screener name from the list and then selecting "Any alert() function call".
No additional configuration is required, message and alert on close I set up in the code.
I created as an example a screener that tracks both overbought (RSI > 70) and oversold stocks (RSI < 30).
To create your own screener you have to change only screenerFunc().
By design it should output 2 values:
cond - True/False Boolean variable. Should this instrument be displayed in the screener?
value - Additional numeric value you can display in your screener. I display RSI level for selected stocks for example.
Link to the old screener:
Disclaimer
Please remember that past performance may not be indicative of future results.
Due to various factors, including changing market conditions, the strategy may no longer perform as good as in historical backtesting.
This post and the script don’t provide any financial advice.
BEST Ultimate Engulfing ScreenerHello traders
Continuing deeper and stronger with the screeners serie. I keep getting requests private messages and requests saying that screeners aren't possible with TradingView.
My answer is always... "Reallyyy ??" (I never find a better answer than that...)
I'll publish a few screeners just for everyone to understand what can be done with Pinescript. We don't have to wait for TradingView to allow screener based on custom indicator - we can build our own ^^
I - What is an engulfing pattern
Let's start with a screener to check for a very famous candlestick pattern called engulfing
Engulfing candles tend to signal a reversal of the current trend in the market. This specific pattern involves two candles with the latter candle ‘engulfing’ the entire body of the candle before it.
The engulfing candle can be bullish or bearish depending on where it forms in relation to the existing trend
Source and more info here
These engulfing candles indicate a strong shift in direction, and when combined with observation of the price-trending direction that precedes it, this shift creates the opportunity for a trading strategy.
II - How did I set the screener
I added an optional filter being Price vs SMA. The idea is to select only the engulfing whenever the price also breaks an SMA - this usually translates a stronger move - but could sometimes give the signal too late (#meh #trading #ain't #easy)
The visual signals are as follow:
- square: whenever the engine detects an engulfing and an SMA breakout
- triangle: the engine only detects an engulfing
- dash: none of the above
Then the colors are:
- orange when bullish
- yellow when bearish
- aqua/dash when none of the above
Cool Hacks
"But sir... what can we do with only 5 instruments for a screener?" I agree not much but...
even if I allow only 5 instruments per indicator - nothing prevents you from adding multiple times the same indicator and changing the selected instruments for each. I also show why the SPX500 gave a yellow triangle (bearish engulfing) and how to match it with the screener.
=> imgur.com
Wishing you all the BEST trading
Dave
Philakone 55 EMA Swing Trading StrategyThis strategy was inspired by Philkone Crypto's "Lesson 12: Let's Learn Advanced 55 EMA Strategy" video.
steemit.com
Supports Buy and Sell Condition alerts and displays arrows on the chart.