Windmill Ultimate AlertsThis script is for Windmill Ultimate and includes Alerts Trades and rejected trades are shown.Pine Script® göstergesiThorntech tarafından8
Elgrand - MACD crossover overlay with alertVisualize MACD bullish and bearish crossovers on your chart as an overlay. This way you won't necessarily have to add the MACD script and check manually at which point on your chart the MACD crossed. Optionally you can set alerts on the MACD crossovers in case you would like to trade from this after the signal occured.Pine Script® göstergesielgrand tarafından2727 1.2 K
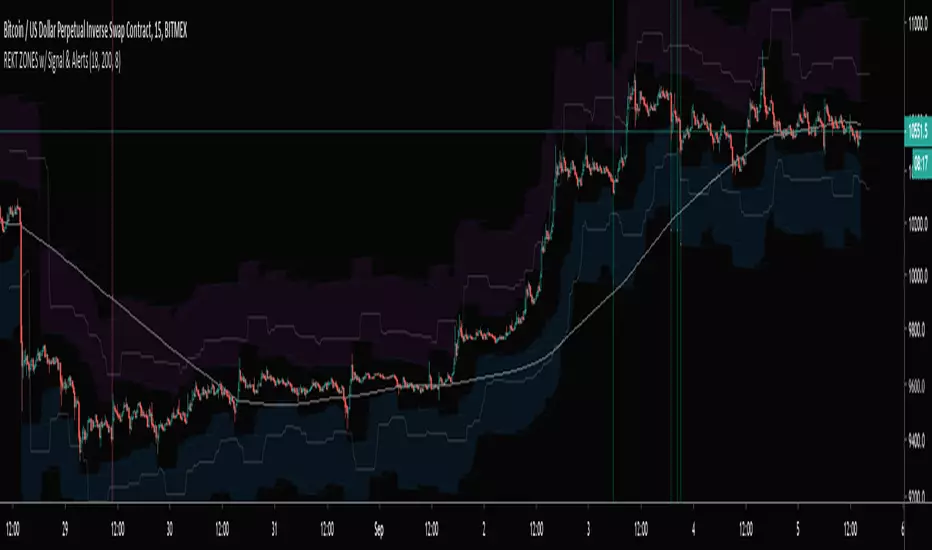
REKT ZONES w/ Signal & AlertsBitmex XBTUSD REKT ZONES with entry signal, stop, target, and alerts! Only use on a 15min chartsPine Script® göstergesichchodler tarafındanGüncellendi 50
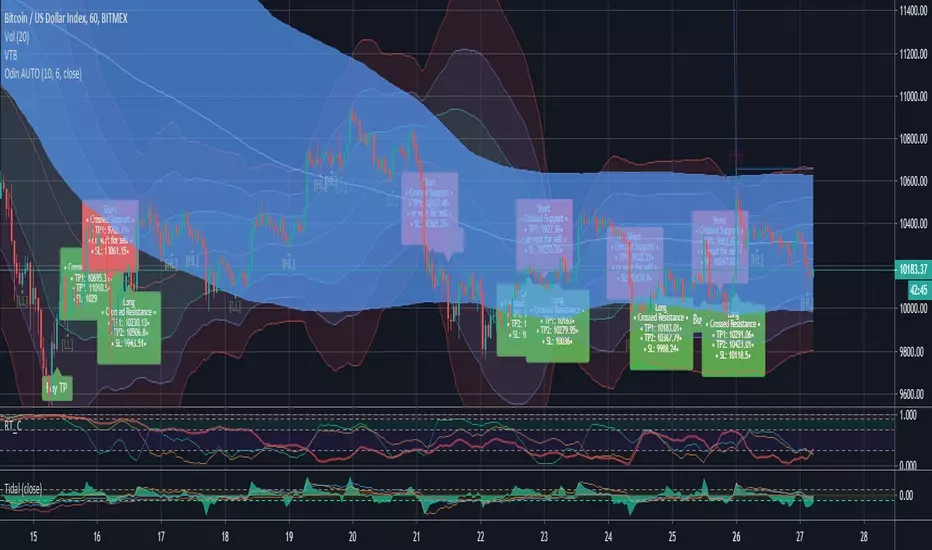
Riptide - Odin AutomatedHey guys, Its finally here! Automated Odin will allow you to trade the Odin indicator automatically! To learn more about setup and results.Pine Script® göstergesiAevir tarafındanGüncellendi 1118
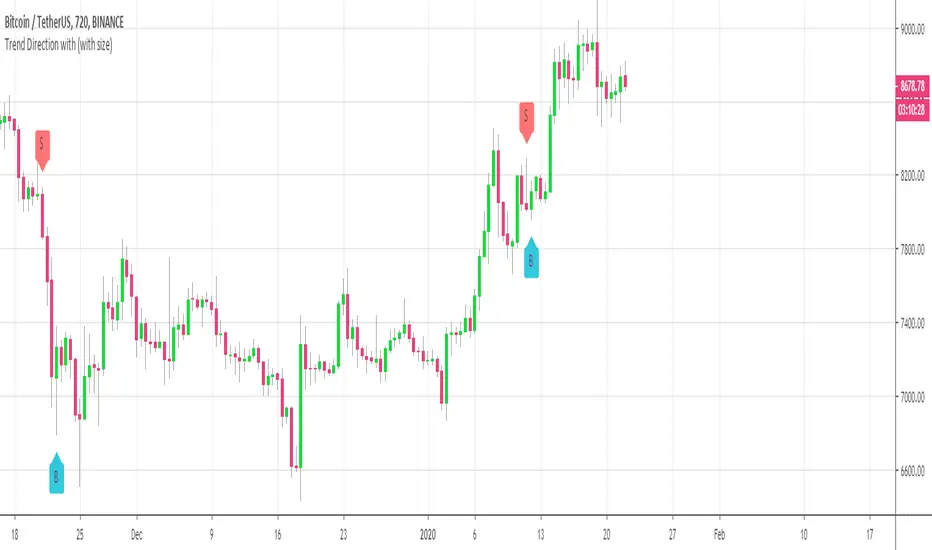
Customizable Trend Direction (Open-Source)Hello everyone I received a ton of requests for this script so I decided to share it I did it for a client who didn't want to pay (you can all blame... or even thank him for this script) in the end and I don't want to sell it on my website. Not because it's not interesting but because my website will be a place to showcase and rent the Algorithm Builders mostly What is it about? Basically, it shows how you could convert a plotshape into a label.new object. Very interesting if you want someday to convert your V3 script into V4 With this script, it shows that you can in V4 ( but couldn't do in V3 ) do the followings : - change dynamically the size (from tiny to huge) of any object - change dynamically the text (from whatever to whatever) of any object Screenshot of the user interface imgur.com Other use cases I did it with the Trend Direction but could work with anything really. - Any indicator with a visual signal. You can know personalized from a user interface the text, size and also the vertical shift. I didn't do it for that one but label.new takes a (x,y) coordinates so playing with y is fairly easy to achieve a dynamic vertical shift - Even with this script Plotchar-How-to-draw-external-symbols-on-a-chart/ but would require to be updated with a label.new object and with a shape.none parameter so that we'll only see the icon/symbol displayed - The colors also can be change dynamically using presets Presets-Selector-FRIDAY-NIGHT-CHALLENGE/ . If you have an indicator showing a BULLISH and a BEARISH signal, then you could, for instance, configure colors presets according to the timeframe of the chart or the indicator input, etc (sky is the limit ^^) Be sure to hit the thumbs up at it motivates me to research what Pinescript can offer and share with the community Dave ____________________________________________________________ - I'm an officially approved PineEditor/LUA/MT4 approved mentor on codementor. You can request a coaching with me if you want and I'll teach you how to build kick-ass indicators and strategies Jump on a 1 to 1 coaching with me - You can also hire for a custom dev of your indicator/strategy/bot/chrome extension/python Pine Script® göstergesiDaveatt tarafındanGüncellendi 1212636
CoinExpert TrendTrend Analysis, shows clear direction of the market Includes automatic Zig-Zag tracement to show reversals coming up & also has a refined version of different variants of MA's to show really strong support/resistance channels. Combined with CoinExpert Oscillator and CoinExpert Overlay it is possibly the best trading tool up to now. This is not an indicator, this is a WINdicator! For access and prices, add me on Discord, Amnesio#0001 or message me here, on Tradingview.Pine Script® göstergesiGeorgeImbrea tarafındanGüncellendi 34
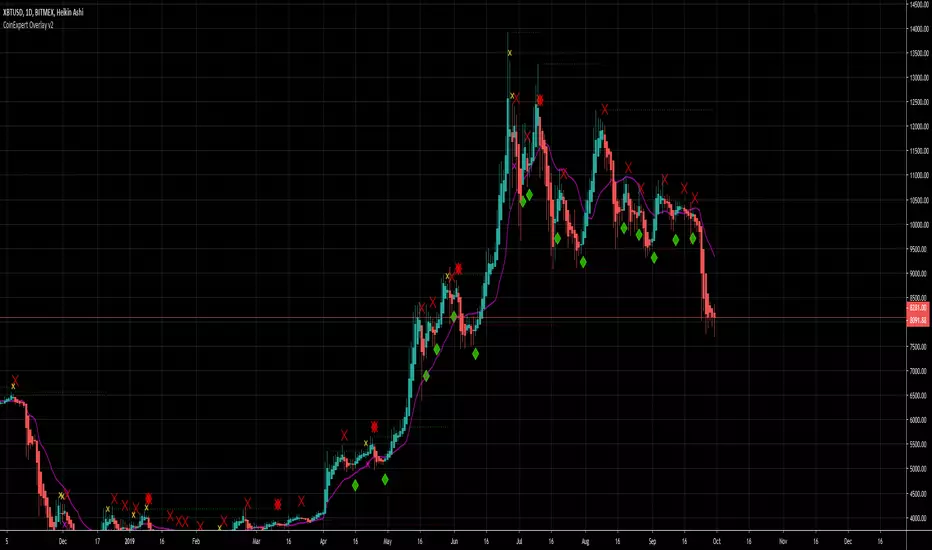
CoinExpert OverlayCandlestick and Trend Analysis with amazingly accurate Buy/Sell signals and alerts. Includes warnings for possible tops, market manipulation , etc. Also contains many perfectly refined indicator s ( VWMA , fast/slow EMAS/SMAS, parabolic SAR flip, auto Support/Resistance levels) that help serve making the right decisions . Combined with CoinExpert Oscillator and CoinExpert Trend it is possibly the best trading tool up to now . This is not an indicator, this is a WINdicator! For access and prices, add me on Discord, Amnesio#0001 or message me here, on Tradingview.Pine Script® göstergesiGeorgeImbrea tarafındanGüncellendi 29
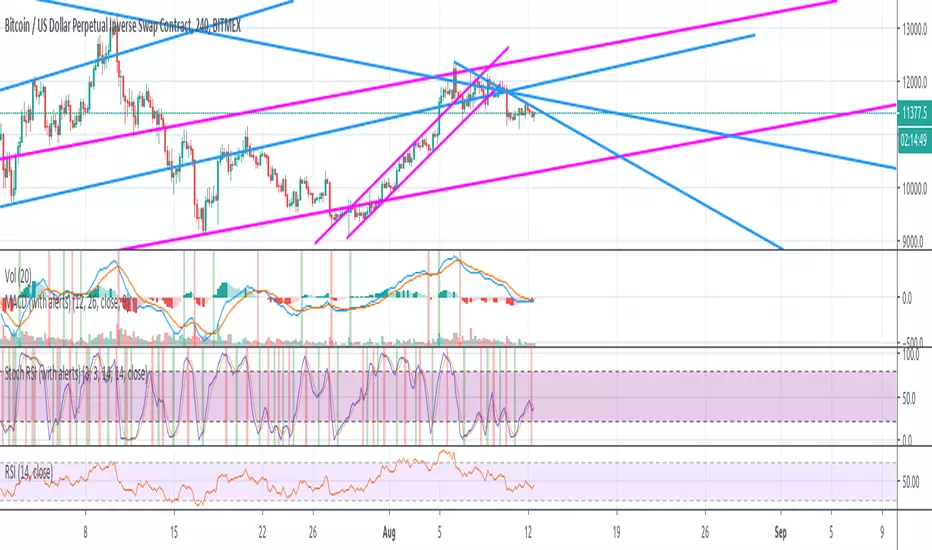
Stochastic RSI (with alerts)This is a modification of original Stochastic RSI oscillator, but with addition of highlighted death and golden crosses. It also allows you to receive alerts: "Stochastic RSI: Death cross on 4hours"Pine Script® göstergesipikusfikus2 tarafından33197
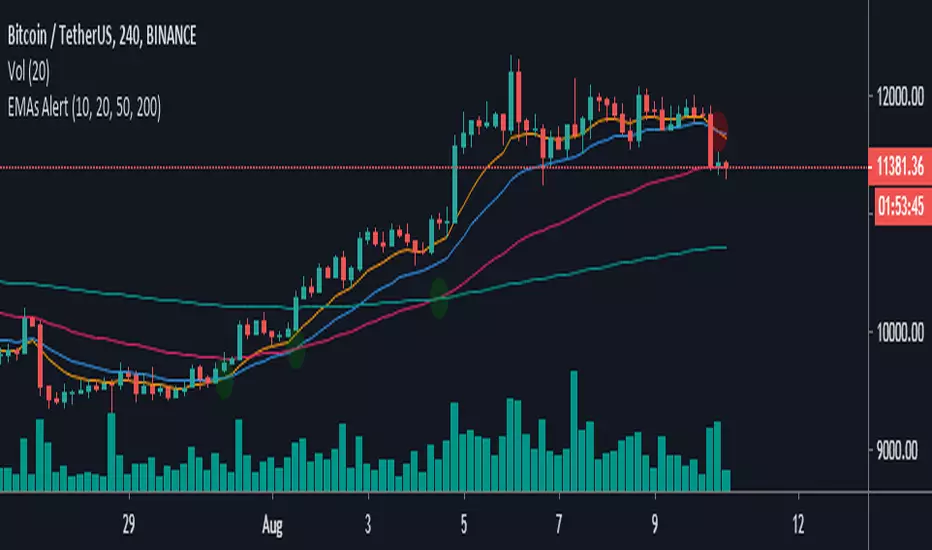
EMAs Alert-This script allows you to show the crossings of the most important emas such as 10, 20, 50 and 200 -You can modify the values of each ema you like -Bring alerts of the crosses of each ema, which will allow you to activate this function to only the assets you want to trackPine Script® göstergesiRicardo8Trece tarafındanGüncellendi 22329
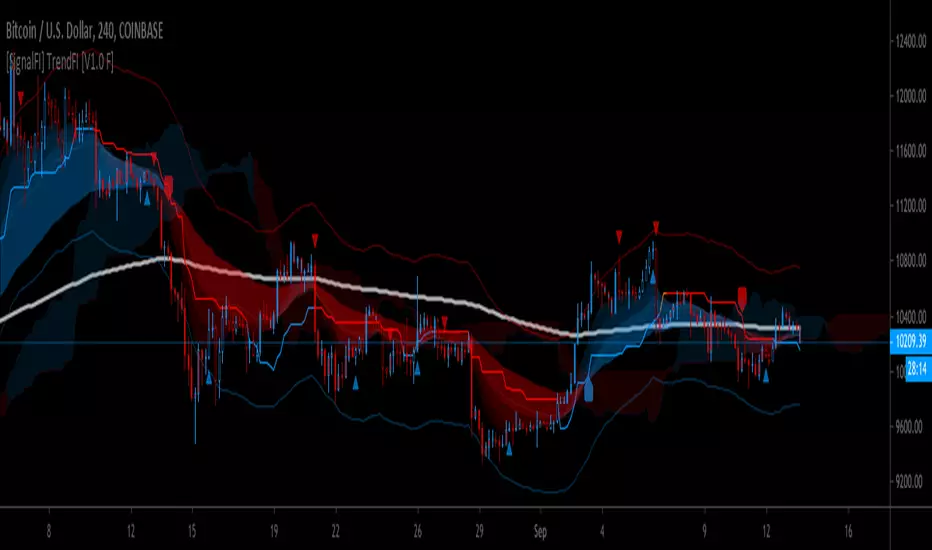
[SignalFI] TrendFI [V1.0 F] [BETA]TrendFI is trending tool used to spot entry exit signals using a wide range of dynamics which include: - Ichi based EMA with (w/Deviation Bands) - Fibonacci based EMA spreads - MACD - Ichi based Cloud (Future Support and Resistance) Alerts: 3-Stage alerting system for buy/sell. BETA as of 8/7/2019. More info and descriptions to come. Pine Script® göstergesiSignalFi tarafındanGüncellendi 5532
MACD Trader with long & short alertsBased on moving averages this script helps you to trade using MACD. You can also set alarms for LONG and SHORT alerts to be in touch. Like this script and PM me to get the access.Pine Script® göstergesiromeotrader tarafındanGüncellendi 1010987
Adaptive Trailing StopIntroduction The ability to adapt to possible markets states is important in technical analysis, this is why making adaptive indicator might help get better results. I propose a trailing stop indicator using recursion that can adapt to the efficiency ratio. I have added alerts since it's a often requested feature. The Indicator Its quite classical, bands are firstly made then a trailing stop is built around them. The bands are recursive, this allow for faster calculations in general but it also allow for a faster adaptivity. An higher length or factor will make the indicator detect longer term trends, factor determine the raising power of the efficiency ratio. When smooth is checked the trailing stop will appear smoother. When adaptive is unchecked the indicator will still act as a trailing stop but might be more affected to ranging markets. Set a static/trailing stop loss : You can set your stop loss based on the indicator, a static stop loss can be set at the value of the trailing stop when you enter the market. You can also set it as trailing stop, the indicator will follow the trend thus allowing for potential profits to grow's. Determine The Trend Direction : You can generate buy sell signals based on the indicator position relative to the price, when the indicator is lower than the price this indicate a up trending market, when the indicator is higher than the price this indicate a down trending market. If the trailing stop move this indicate a strong current trend. False signals with trailing stops can happen, the price might go toward the trailing stop making it generate another signal, when market is ranging and exhibiting cyclical behaviour this can affect the indicator and the user might get stuck in a series of false signals, higher length/factor values can fix that at the cost of less early signals. Identification Of Support And Resistance Bands during low volatility/ranging markets can return potential reversal points when crossing with the price. The indicator can also do it, even if high/low crosses are better suited to determine support and resistance levels when using a trailing stop. You can use support/resistance identification in conjonction of the current trend detected by the indicator. Conclusion The indicator is fully operational in fixed mode while having potential down points in adaptive mode. As you can see the code that return the bands is fully recursive and might provide a great way to create adaptive bands in the future. I have been asked to give more detail about the indicator uses rather than the construction, i hope the showcased uses are convenient. Note that the showcased uses can be applied to any trailing stop. Thanks for reading.Pine Script® göstergesialexgrover tarafından1515614
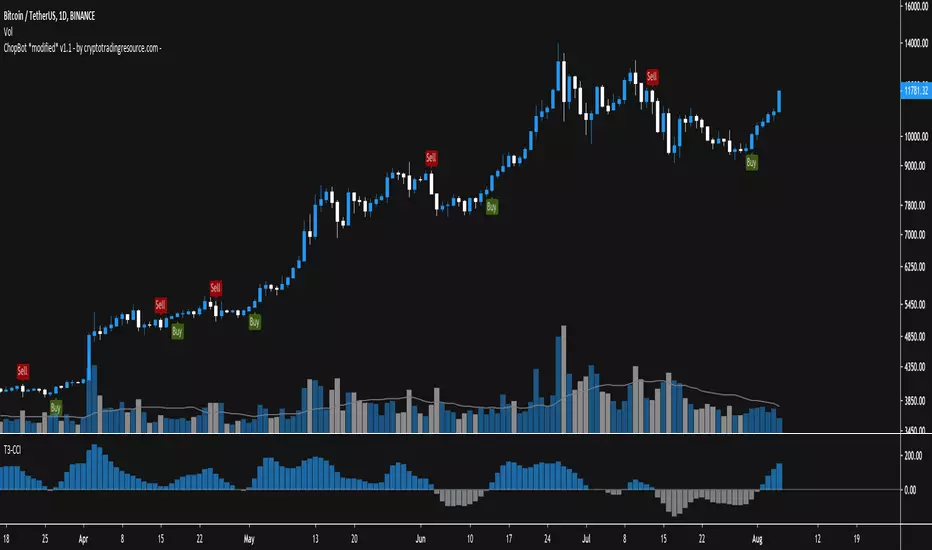
ChopBot *modified* - by cryptotradingresource.com -This is my modified version of the original strategy by @yerb It has just a little tweak in it, but this already works out that you'll receive less signals. There is for sure more room to perfection but it looks accurate. Try it out on different timeframes, find the best on for your asset and enjoy trading! For included: Buy and Sell plots Alerts for signals (buy,sell, take profit, ema crossover/crossunder) Double EMA more to come. If you use this tool, let me know if u find some issues, or share your settings with results :) Some examples: LINKBTC 1D BTCUSD 1D RVNBTC 2D BNBBTC 1H THETABTC 6H Happy trading +++ use this tool on your own risk. i'm not responsible for your loses +++ ____________________________________________________________________________ BTC: 1GVRDK3HHr9CKM5SF2CGpCNXFuavB3L4j9 ETH: 0x7b825fa752b9926D3E8397cDb1d9E5473D074646 XMR: 41zL2SQS7zyZmwXKng2TeUWsMi5vMmkgSdDCjULUTvM6ichwm1E2ZDEYGt56zk9ghoM9bekhjycSwa8amtTcB2JiUet5jtg NEO: AXja5xPDhczfm2ujHyBfpkQAAnMsXsazmb ZEC: zcZzFkRx95cp7MtuW8wLhC5zz5RYF9QkT2uPPmhZZHc6ppXepHGgCSeAS1rtD6WFdqsM5p1gZm2gfirnrnviucsdP4aCpqU XLM: GAXUQJSW55C7MAC4GI26NZUGIKSHFDVFRFKZCXPLMPY4HCADSDT55XK6 WAVES: 3PCMkNpMHxSraTCkwV1ENcBKa9sXbVCGjQX BCH: qz57n04ud6mn42u00aymqkku8tfh0lk4jv9c28mjvv ____________________________________________________________________________ ++++ cryptotradingresource.com ++++ ____________________________________________________________________________Pine Script® göstergesicryptomrdavis tarafından55377
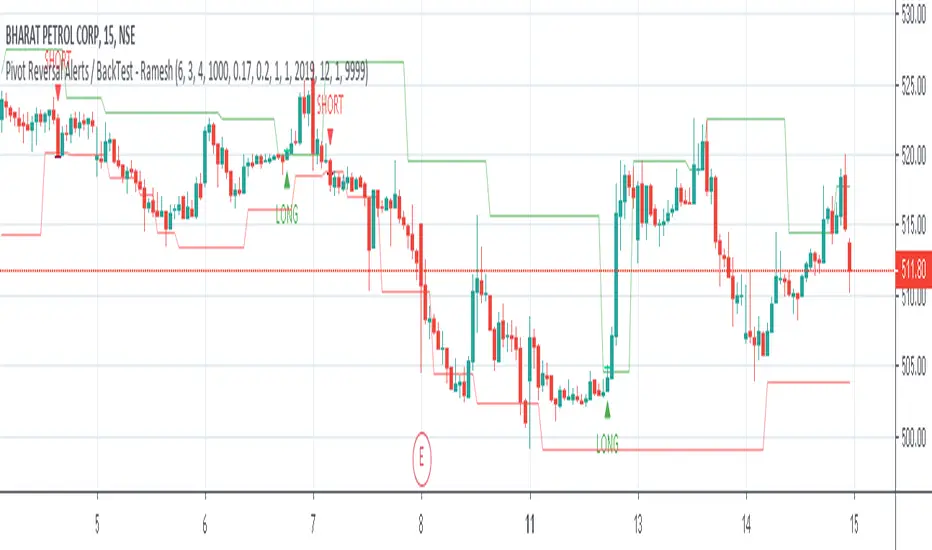
Pivot Reversal Strategy with ADX filter and Alerts V2 - RameshOne script with 80% Win Rate, applicable for 15m time period, more filters added to remove false signal.Pine Script® göstergesirameshsmn1 tarafındanGüncellendi 55290
Algorithm Builder (Signal version)Gentlemen traders As promised, here's the Algorithm Builder (Signal Version) that is an alternative version of that previous indicator : Strategy-Builder-Crypto-Single-Trend-Plots/ This one was quite successful and already 11 person bought for me which is unbelievable. Thank you so much guys for your appreciation of my work The script of this present post is still invite-only because it required years in the making (it's the fruit of all my errors and trials while trading for the past 7 years and when developing trading bots for traders professionally) What's the Algorithm Builder? Simply put, the indicator will detect the confluence/convergence of multiple unrelated indicators and alert you when the ones YOU selected will be in the same direction. (if you didn't understand this it's because I'm french) For example, let's say you select a MM cross and MACD, whenever the MM cross will be green/bullish AND MACD green/bullish also, you'll get a nice .... wait for it..... green/bullish /diamond. Starting to see what I meant before now :) Not sure if I should go as far as introducing the other example but let's go for it. Still, in the same spirit, a confluence of red/bearish MM cross and red/bearish MACD will give .... (finish the sentence and you'll get my appreciation. hint: the color of the diamond will be red) So what's cool about it now ... or I should say even cooler... even more awesome (Barney Stinson, please hive five me for this tool...) is that it can be plugged in a single click to a complete Backtest engine I inspired myself greatly from the Pinescripters Backtesting-Trading-Engine-PineCoders/ but had to make changes to adapt it to my tool. It took me a few days of work and I'll share it also tomorrow so please stay tuned and give me a follow so that you'll be updated In the Backtester itself, I added some features like : - Stop-loss based on supertrend - Hard Exit based on indicators used by the Algorithm Builder I just made it more relevant for my indicator Performance sir? The period selected for the screenshot below is the last 3 months Here's a preview of what you should expect tomorrow as well imgur.com There isn't a BEST configuration for the tool. I made one that matches my psychology and capital. You'll have to find yours by playing with it or asking me for a bit of help if you're lost Will require a bit of work but could be very worth it in the end :) What's next sir? I'm perfectly aware that the indicator doesn't give a lot of signals and that's because it's an entry-level version of all the Algorithm Builders I'm selling now and will be available on my website by end of August (along with the website itself) More advanced versions already made allow to : - get more entries that one is the best addition, in my opinion, it multiplies the gains (and losses :P) as it allows some orders pyramiding and to reinforce a position if the trend is very strong. You won't have to do anything, just to wait for the alerts by email/sms from TradingView - multiple take profit levels - connected to systems like Autoview/ProfitView to automatize even more your trading and send those signals to your broker directly (I will strongly advise starting with a demo account for 1 week or 2 here, I don't want you to burn your capital if any unexpected bad event will happen) - screener If you're interested please message me. I can develop your custom indicator/strategy/backtest/automatic system or if you're ready the take the leap of faith and try this indicator or the more advanced versions And before I get asked, yes this is the tool I use for my own trading as initially, I made it for me. Now sharing a bit of my work (and too much of my life) with the community PS ____________________________________________________________ Feel free to hit the thumbs up as it shows me that I'm not doing this for nothing and will motivate to deliver more quality content in the future. - I'm an officially approved PineEditor/LUA/MT4 approved mentor on codementor. You can request a coaching with me if you want and I'll teach you how to build kick-ass indicators and strategies Jump on a 1 to 1 coaching with me - You can also hire for a custom dev of your indicator/strategy/bot/chrome extension/python - if you like my work and wants to buy me some coffee : - BTC TipJar: 3MKDve7stWTe1io99oFxeQXvP8XB4zCQ8m - LTC TipJar: MC5oeBAhw9BLqyi65TR3J1Lid8io9uHADwPine Script® göstergesiDaveatt tarafındanGüncellendi 212174
RePaNoCHa V4 [Alerts]Script for automatic trading with Alerts. LG --> Long (green: not confirmed) (lime: confirmed) ST --> Short (maroon: not confirmed) (red: confirmed) TS --> Trailing Stop xL --> Close Long Position xS --> Close Short Position SL --> Stop Loss The trailing stop closes the trade if the price changes direction by a specified percentage or offset. There is no ideal distance because markets and price are always changing and we know that is impossible to exit on the top or bottom. This script interpolate the trailing Stop Offset with profit, higher profit --> higher Trailing Stop Offset. Despite this, it's difficult to catch the price but not impossible. It has a TS delay too. It take a snapshot every X seconds, if the TS is activated the alert is triggered, otherwise the price keeps fluctuating until a new snapshot. It can be easily converted to Backtest. Just delete "//" on the corresponding part. Default settings for XBT:USD at 1H.Pine Script® göstergesiUnknownUnicorn2151907 tarafındanGüncellendi 6363844
TMA Strategy v2.2This is a backtest of the TMA Indicator v2.2 using default parameters. Backtest window: Jan 1, 2015 - Jul 21, 2019 (today) For more information on the indicator and strategy seen here please take a look at this backtest: For paper trading only. Do not use on real markets. Never make investment decisions based on this indicator alone.Pine Script® stratejisita-ky tarafından4436
TMA Indicator v2.2This indicator is designed to show support and resistance at local extremes. Configurable SMA crossover events can be used to impart a bullish or bearish bias. This helps to reduce noise on the chart and increase profit factor. In other words, the indicator will only look for bullish breakouts if the fast moving average is above the slow moving average and vice-versa. SMA Crossover events can be used to filter bullish or bearish resistance levels. SMA Crossover events can be used to filter bullish or bearish breakout alerts. Supports alerts for entries and exits based on breakouts of local extrema. Alerts can be generated at every breakout or with SMA crossover filtering active. Backtests would suggest that filtering with SMA crossovers often yields slightly lower profit but with a considerable improvement to profit factor. Green/Red indicates long/short entry Yellow/Orange indicates long/short exit See here for an example backtest and visualization of active SMA signal filtering: For paper trading only. Do not use on real markets. Never make investment decisions based on this indicator alone. Pine Script® göstergesita-ky tarafından28
TMA Indicator v2.1This indicator is designed to show support and resistance at local extremes. Indicator can be configured to filter out bullish vs bearish resistance levels based on configurable parameters. Supports alerts for entries and exits based on breakouts of local extrema. Green/Red indicates long/short entry Yellow/Orange indicates long/short exit Backtest window: Jan 1, 2015 - Jul 21, 2019 (today) For paper trading only. Do not use on real markets. Never make investment decisions based on this indicator alone. Pine Script® göstergesita-ky tarafından2210
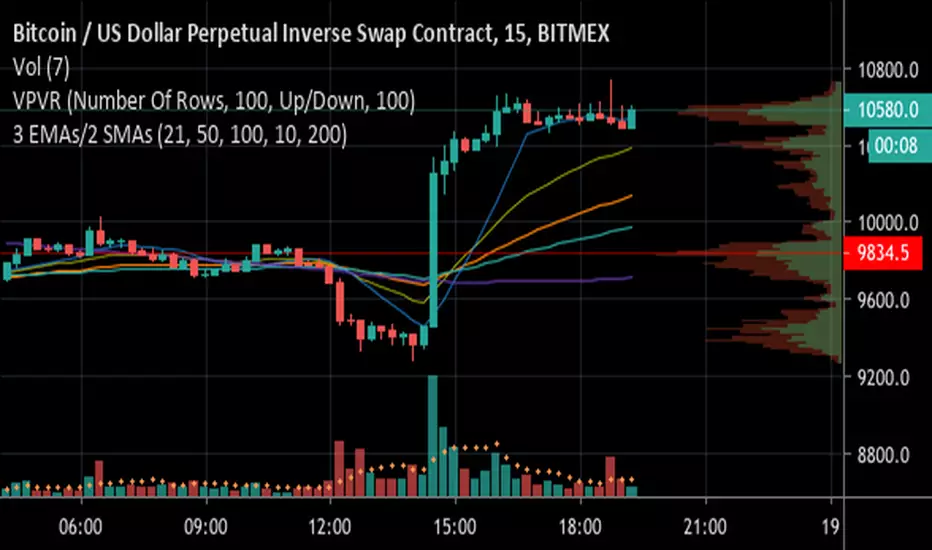
3 EMAs with Crossing Alerts & 2 SMAsHi all, This is a simple indicator that plots 3 EMA lines and 2MAs of your choice to the screen and has built in alert triggers. Features: 1) Alerts are triggered when EMAs 1 (Signal line) and 2 (Baseline) cross - a Long signal is called if the cross is above EMA 3 ( Trendline ), a short if the cross is below EMA3 2) Signals are represented visually as a triangle on the chart, below the candles is a long, above is a short 3) TradingView Alerts can be easily set as I have labelled the signals clearly as many other Indicators like this aren’t easy to work out if trying to create alerts to trigger a 3commas bot, for example! Each EMA is fully customisable and if you wish to take advantage of the alerts, only a few simple rules need to be followed: EMA1 needs to be less than EMA2. EMA2 needs to be the same or greater than EMA3 That’s it, happy trading! Pine Script® göstergesiChrisKaye tarafından11446
NOT-ONLY LONG V4 [Alerts]This Script is the second part of the previous one. In this second part it includes Longs and also Shorts. It is a little conservative, and is mainly used for swing trading. It can be used for everyday trading or if you’re using it for automated trading, you don’t necessarily need to run it as a bot. But you can do so if you want. To set it up without running it as a bot. Create the alerts that will send notifications to your mobile, and then when you receive an alert, you can place the order manually yourself. Maybe it could be a bit boring. But as someone said: "The Exchange is designed to transfer the money of the impatient to the patients." -Warren Buffett. This script uses RMI + ADX + RSI, and for the main trend the famous Ichimoku, here I thought wasn’t good for anything, but look at how well it works with ETH. I had to put the security () function only for Ichimoku. It can be used in this way without causing problems with repainting, but you have to know what measures to take to ensure it does not overlap, or so that the backtest is accurate. indexHighTF = barstate.isrealtime ? 1 : 0 indexCurrTF = barstate.isrealtime ? 0 : 1 a0 = security(syminfo.tickerid, 'D', close , lookahead=barmerge.lookahead_off) a = a0 The preventive measures can be found in the link below: www.tradingview.com This script is like the world upside down. When the price goes up and you see an opportunity, you start creating shorts and the same thing can be done by creating longs when the price goes down. It can be very effective because remember what Warren Buffett said again: "The dumbest reason in the world to buy an action is that it is going up." It leave the position only when Taking Profits. It does not have Stop Loss, instead, when it reaches a set % loss, it makes a re-entry by laddering the trades. I think that the Stops Loss only serves to get you liquidate. With the erratic price movements on the Exchanges, their movements can be between 5-20%, fucking you if you have a SL !! (conspiracy theories) ;-) This world is invented for you to lose money, it is not easy to get rich and less likely with a script, but neither is it impossible, who knows, maybe this will help or at least give extra tool in your trading. It's more or less adjusted for my favorite crypto currency: ETH on BITMEX and I'm sure there's a much better setting. The best Timeframe that seems to be working well: ETH: 1 H Greetings from Barcelona… Thanks... BTC: 3LEUP3WjQctdbFjBavcmRGUVRBje8bptCd BCH: qrv6j7mpxjzzs9dudfag3glu278suchdhg7c44pa37 ETH: 0x518AAD4746912ae506c82B747488306186c4d546 ETC: 0xa2498D7AcB9303aa10F14ff27C54AAc4cE5d5705 ZRX: 0x29aC9BaC10818C30055b25A8E90dd11488Ae6df8 BAT: 0x115f3F9D1c3fC248e73644a72d77A062D3CB28Ba Pine Script® göstergesiUnknownUnicorn2151907 tarafındanGüncellendi 11403
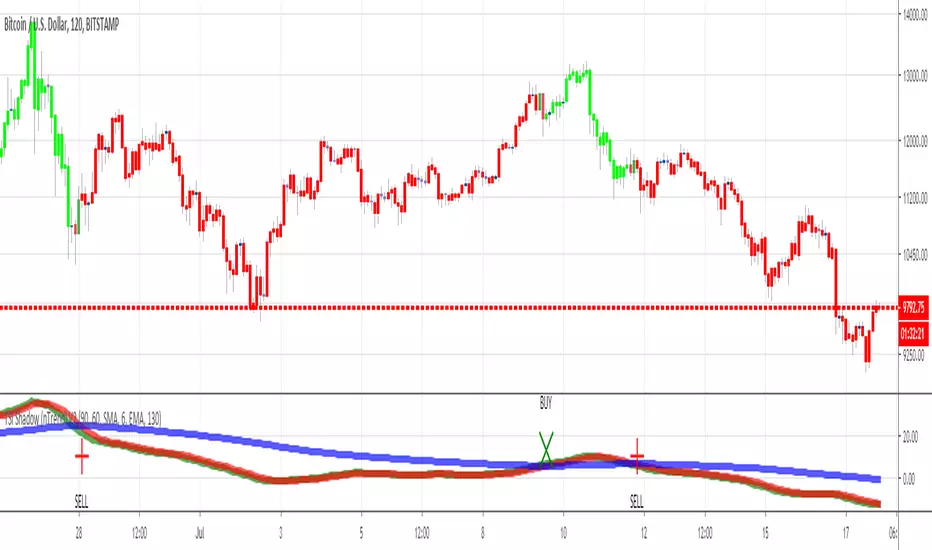
TSI Shadow (with custom candle coloring)Hello traders This indicator is based on my TSI shadow previously published This custom version will also color the candles based on the TSI shadow trend Bullish condition = TSI > MA2 and MA1> MA2 Bearish condition = TSI < MA1 and MA1 < MA2 I made alerts available for this indicator so you can set them on your account Enjoy DavePine Script® göstergesiDaveatt tarafındanGüncellendi 77343
Brandon BollSecond day at Pinescript and I am attempting to tweak the Bollinger Bands directed strategy to send alerts to Zignaly in order to automate long buy/sells. I've left in the short script though for completeness. The buy and sell instructions work perfectly but I don't know how to do a cancel order alert (as included in the original strategy)Pine Script® göstergesixdoomx tarafındanGüncellendi 1160