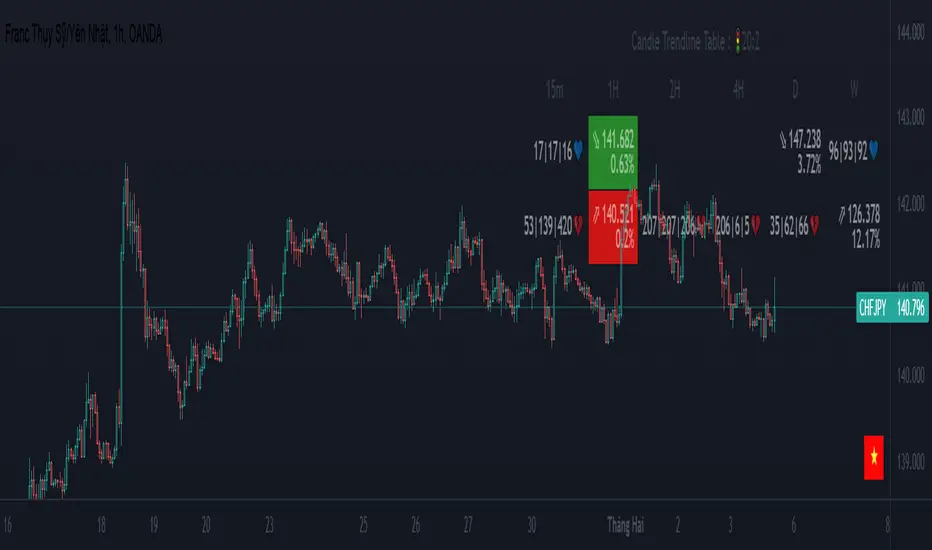
MTF Trendlines_Pro[vn]

-it statistics the upper and lower trend lines of the Multi Time Frame.
-Pine Script strategy draws pivot points and trendlines on the chart.
-This strategy allows the user to specify the interval to calculate the pivot points and the number of pivot points used to generate the trend lines.
-I use the "Trendlines_Pro[vn]" indicator to interpret the indicator "MTF trendlines_Pro[vn]" indicator for everyone to understand
-time frames are selected in settings like 1m,3m,15m,1h,2h,4h,6h,12h,1D.1W.1Month..
-If the price is in a wedge pattern, it is represented by the upper and lower parameters, the upper parameter is the resistance point of the upper trendline,the lower parameter is the support point of the below trendline
-when the price distance is <=1% from the trendline, the upper or lower parameter is colored blue (above) or red (below).
-when only the parameter is accompanied by the ⇗ or ⇘. symbol, it tells us that the price has not broken the corresponding trend line
-when showing green heart and % break .indicates that the price has broken the downtrend line to become an uptrend.
On the contrary, the red heart % breaks, it signals us to break the uptrend line to become a downtrend
-when showing parameters 12(1)|18(2)|20(3) and green heart, then :(3) shows that the price has broken out before 20 candles, (2) shows that there are 18 candles to close above The breakout point, (1) represents the last 12 candles that closed above the breakout point and as if a nice uptrend has occurred because 98% of the candles have closed above the breakout point....the opposite of The red heart is the price that broke below the trendline below.
-"MTF trendlines_Pro[vn]"indicator is integrated for both the trendline of the price line and the RSI. You can change it in the settings as shown below.
----------------------------------------------------------------------------
vietnamese
-Đây là chỉ báo dành cho các trader thuộc trường phái phân tích đường xu hướng
-nó thống kê các đường xu hướng trên và dưới của Multi Time Frame.
-Chiến lược Pine Script vẽ các điểm trục và đường xu hướng trên biểu đồ.
-Chiến lược này cho phép người dùng chỉ định khoảng thời gian tính toán các điểm xoay và số điểm xoay được sử dụng để tạo các đường xu hướng .
-tôi có dùng chỉ báo trendline_pro[vn] dùng để diễn giải chỉ báo MTF trendlines_pro[vn] cho mọi người dễ hiểu
-các khung thời gian được lựa chọn trong cài đặt như 1m,3m,15m,1h,2h,4h,6h,12h,....
-Nếu giá đang trong mô hình cái nêm thì được thể hiện bằng tham số trên và tham số dưới, tham số trên là điểm kháng cự của đường xu hướng bên trên,tham số dưới là điểm hỗ trợ của đường xu hướng bên dưới
-khi giá cách đường xu hướng <=1% thì tham số trên hoặc dưới được tô màu xanh (trên) hoặc đỏ(dưới)
-khi chỉ có tham số kèm theo biểu tượng ⇗ or ⇘.thì cho ta biết là giá chưa phá vỡ được đường xu hướng tương ứng
-khi hiện trái tim xanh và % phá vỡ .báo hiệu cho ta biết giá đã phá vỡ đường xu hướng giảm trở thành xu hướng tăng.
ngược lại trái tim đỏ % phá vỡ thì báo hiệu cho ta phá vỡ đường xu hướng tăng trở thành xu hướng giảm
-khi hiện thông số 12(1)|18(2)|20(3) và trái tim xanh thì :(3) thể hiện giá đã phá vỡ trước đó 20 nến,(2) thể hiện có 18 cây nến đóng cửa trên điểm phá vỡ,(1) thể hiện có 12 nến gần nhất đóng cửa trên điểm phá vỡ và như vạy xu hướng tăng đẹp đã xảy ra vì chiếm đến 98% nến đã đóng cửa trên điểm phá vỡ....ngược lại với trái tim đỏ là giá đã đột phá xuống dưới đường xu hướng bên dưới
-chỉ báo MTF trendlines_pro được tích hợp chung cho cả trendline của đường giá và RSI .các bạn có thể thay đổi trong phần cài đặt như hình bên dưới.
Yalnızca davetli komut dosyası
Bu komut dosyasına yalnızca yazar tarafından onaylanan kullanıcılar erişebilir. Kullanmak için izin istemeniz ve almanız gerekir. Bu genellikle ödeme yapıldıktan sonra verilir. Daha fazla ayrıntı için aşağıdaki yazarın talimatlarını izleyin veya doğrudan ichimoku14642 ile iletişime geçin.
TradingView, yazarına tamamen güvenmediğiniz ve nasıl çalıştığını anlamadığınız sürece bir komut dosyası için ödeme yapmanızı veya kullanmanızı TAVSİYE ETMEZ. Ayrıca topluluk komut dosyalarımızda ücretsiz, açık kaynaklı alternatifler bulabilirsiniz.
Yazarın talimatları
Feragatname
Yalnızca davetli komut dosyası
Bu komut dosyasına yalnızca yazar tarafından onaylanan kullanıcılar erişebilir. Kullanmak için izin istemeniz ve almanız gerekir. Bu genellikle ödeme yapıldıktan sonra verilir. Daha fazla ayrıntı için aşağıdaki yazarın talimatlarını izleyin veya doğrudan ichimoku14642 ile iletişime geçin.
TradingView, yazarına tamamen güvenmediğiniz ve nasıl çalıştığını anlamadığınız sürece bir komut dosyası için ödeme yapmanızı veya kullanmanızı TAVSİYE ETMEZ. Ayrıca topluluk komut dosyalarımızda ücretsiz, açık kaynaklı alternatifler bulabilirsiniz.