Institutional Heatmap
What This Indicator Does
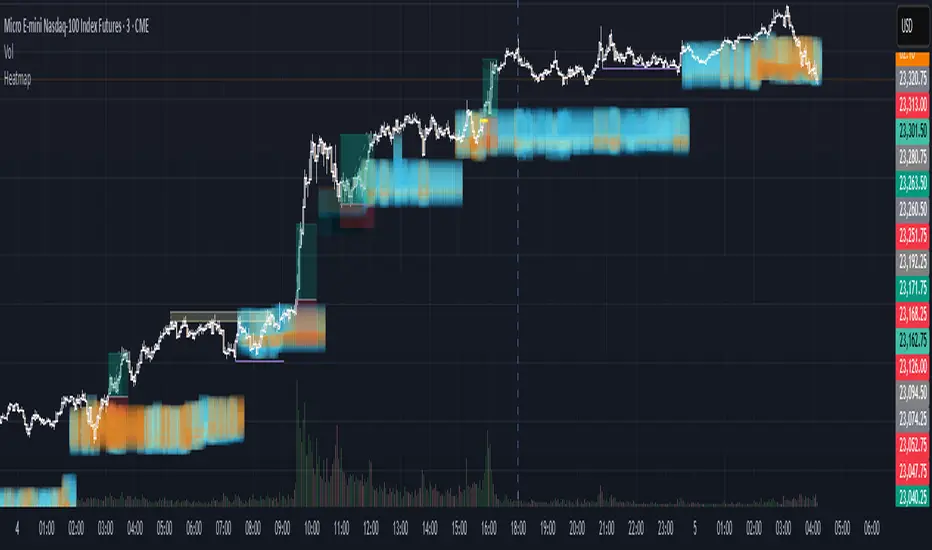
The Heatmap Range indicator provides a sophisticated volume profile visualization that displays price levels with the highest trading activity using color-coded heatmaps directly on your chart. Unlike traditional volume indicators, this tool shows WHERE the most significant trading occurred within specific price ranges over a customizable lookback period.
Advanced Volume Analysis
- Volume-Weighted Price Levels: Calculates and displays up to 20 price levels based on actual trading volume
- Customizable Time Period: Analyze volume distribution over 10-500 bars (default: 180 bars)
- Smart Bin Sizing: Adjustable pip range (0.1-50 pips) for precise level identification
- Peak Detection: Automatically identifies and centers display around highest volume areas
Visual Customization
3 Color Patterns:
- Inverted Heat (Orange to Dark Red)
- Inverted Cool (Orange to Dark Blue)
- Inverted Purple (Light Pink to Dark Purple)
Transparency Control: 0-95% transparency for optimal chart readability
Adaptive Display: Shows most relevant levels centered around peak volume
Multi-Asset Support
- Forex Pairs (EUR/USD, GBP/USD, etc.)
- Precious Metals (Gold/XAUUSD, Silver/XAGUSD)
- Futures (NQ, ES, YM, etc.)
- Cryptocurrencies
- Stock Indices
Customizable Parameters
- Histogram Period (10-500, Default: 180) Bars to analyze for volume distribution
- Bin Range (0.1-50 pips, Default: 5.0) Price range for each volume level
- Color Pattern (1-3, Default: 1) Visual color scheme selection
- Average Volume Period (10-200, Default: 100) Period for volume normalization
- Max Display Levels (5-20, Default: 20) Maximum price levels to show
- Transparency (0-95%, Default: 50%) Opacity of heatmap display
How to Use
For Day Traders
- Identify key support/resistance levels based on actual volume
- Spot high-probability reversal zones
- Plan entries/exits around significant volume levels
For Swing Traders
- Analyze longer-term volume distribution patterns
- Identify major accumulation/distribution zones
- Confirm breakout levels with volume validation
For Scalpers
- Quick identification of intraday volume hotspots
- Real-time volume level updates
- Precise entry/exit timing around volume clusters
Visual Interpretation
- Darker Colors: Higher volume concentration (stronger levels)
- Lighter Colors: Lower volume concentration
- Color Intensity: Directly correlates to volume strength at that price level
- Level Positioning: Automatically centers around peak volume areas
Technical Specifications
- Pine Script Version: v5
- Chart Overlay: Yes
- Max Bars Back: 1000
- Performance Optimized: Limited to 200 bins for smooth operation
- Real-time Updates: Dynamic calculation on each bar close
Getting Started
- Add to Chart: Apply indicator to any supported timeframe
- Adjust Period: Set histogram period based on your trading style
- Choose Colors: Select color pattern that suits your chart theme
- Fine-tune Levels: Adjust bin range and max levels for optimal display
- Set Transparency: Balance visibility with chart clarity
Important Notes
- Minimum Data Requirement: Needs at least 10 bars of history to function
- Performance: Higher periods and smaller bin ranges require more processing
- Volume Dependency: Most effective on instruments with consistent volume data
- Timeframe Agnostic: Works on all timeframes from 1-minute to monthly
Status Information
The indicator includes a real-time information table showing:
- Current settings (Period, Bin Range, Color Pattern, Transparency)
- Indicator status (Active/Loading)
Disclaimer: This indicator is for educational and informational purposes only. Past performance does not guarantee future results. Always conduct your own analysis and risk management before making trading decisions.
Compatible with TradingView's Pine Script v5 | Optimized for all market conditions | Professional-grade volume analysis
Yalnızca davetli komut dosyası
Bu komut dosyasına yalnızca yazar tarafından onaylanan kullanıcılar erişebilir. Kullanmak için izin istemeniz ve almanız gerekir. Bu genellikle ödeme yapıldıktan sonra verilir. Daha fazla ayrıntı için aşağıdaki yazarın talimatlarını izleyin veya doğrudan DeltaMerge ile iletişime geçin.
TradingView, yazarına tamamen güvenmediğiniz ve nasıl çalıştığını anlamadığınız sürece bir komut dosyası için ödeme yapmanızı veya kullanmanızı TAVSİYE ETMEZ. Ayrıca topluluk komut dosyalarımızda ücretsiz, açık kaynaklı alternatifler bulabilirsiniz.
Yazarın talimatları
Feragatname
Yalnızca davetli komut dosyası
Bu komut dosyasına yalnızca yazar tarafından onaylanan kullanıcılar erişebilir. Kullanmak için izin istemeniz ve almanız gerekir. Bu genellikle ödeme yapıldıktan sonra verilir. Daha fazla ayrıntı için aşağıdaki yazarın talimatlarını izleyin veya doğrudan DeltaMerge ile iletişime geçin.
TradingView, yazarına tamamen güvenmediğiniz ve nasıl çalıştığını anlamadığınız sürece bir komut dosyası için ödeme yapmanızı veya kullanmanızı TAVSİYE ETMEZ. Ayrıca topluluk komut dosyalarımızda ücretsiz, açık kaynaklı alternatifler bulabilirsiniz.