OPEN-SOURCE SCRIPT
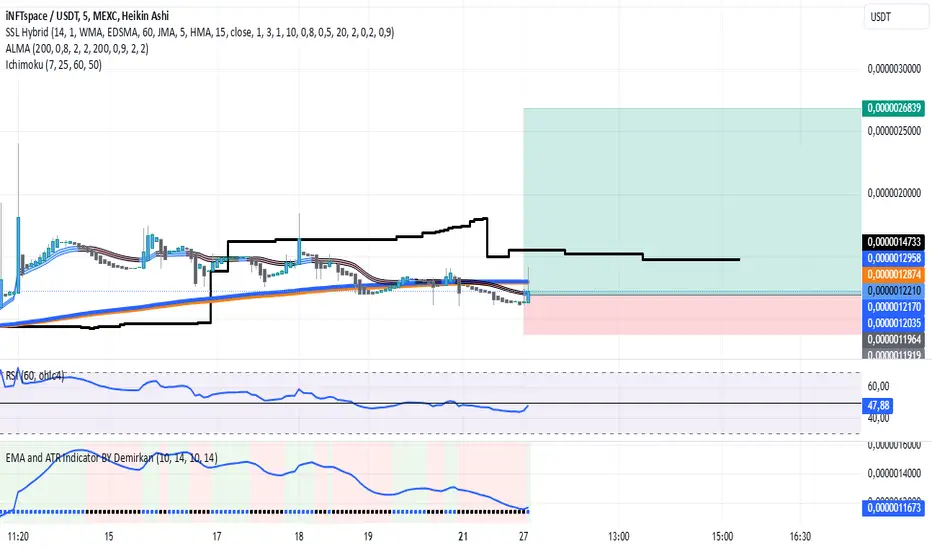
EMA and ATR Indicator BY Demirkan

EMA 10 and ATR Indicator BY Demirkan
The EMA 10 and ATR Indicator combines two powerful technical indicators used to analyze trends and identify potential trading opportunities.
Indicator Components:
Exponential Moving Average (EMA):
EMA 10: Calculates the weighted average of the last 10 closing prices. This indicator is effective in tracking short-term price movements. When the price is above the EMA, it is considered that the trend is upward; when it is below, it is assessed as a downward trend.
Average True Range (ATR):
ATR: A measure of market volatility. When the ATR value falls within a specified range (between 10 and 14 in this indicator), the price movement is considered significant. This helps you base your trading decisions on more solid grounds.
Usage Recommendations:
Buy Signal: When the price is above the EMA and the ATR is within the specified range, this can be interpreted as a potential buy signal.
Sell Signal: When the price is below the EMA, this can be interpreted as a potential sell signal.
Chart Displays:
EMA Line: Displayed as a blue line, allowing you to see how the EMA relates to current price levels.
Price Status: Circles are used to indicate whether the price is above or below the EMA. A green circle indicates the price is above the EMA, while a red circle indicates it is below.
Background Colors: The chart background changes to green or red to highlight buy and sell conditions.
Aesthetic Presentation:
Using the "Flag" and "Below" parameters for the Price vs EMA indicator provides an aesthetically pleasing appearance on the chart. This type of visual presentation helps users quickly and easily grasp trading signals. Additionally, this aesthetic touch makes investors' charts look more professional and appealing.
This indicator is a useful tool for traders looking to develop short-term trading strategies. However, it should always be used in conjunction with additional analysis and other indicators.
Note: This indicator is for educational purposes only and should not be taken as investment advice.
Açık kaynak kodlu komut dosyası
Gerçek TradingView ruhuyla, bu komut dosyasının mimarı, yatırımcıların işlevselliğini inceleyip doğrulayabilmesi için onu açık kaynaklı hale getirdi. Yazarı tebrik ederiz! Ücretsiz olarak kullanabilseniz de, kodu yeniden yayınlamanın Topluluk Kurallarımıza tabi olduğunu unutmayın.
Feragatname
Bilgiler ve yayınlar, TradingView tarafından sağlanan veya onaylanan finansal, yatırım, alım satım veya diğer türden tavsiye veya öneriler anlamına gelmez ve teşkil etmez. Kullanım Koşulları bölümünde daha fazlasını okuyun.