OPEN-SOURCE SCRIPT
200 EMA Trend Direction [Dr.K.C.Prakash]
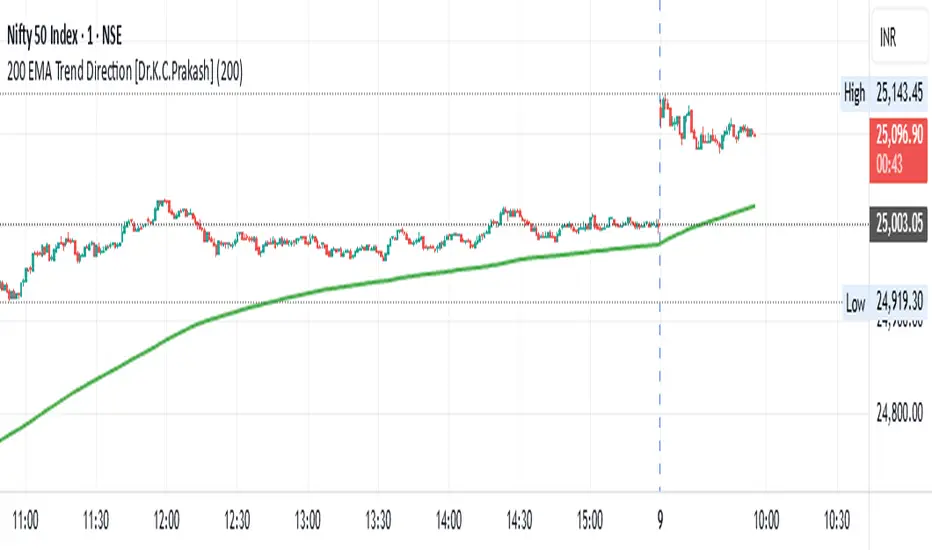
📘 Indicator Description: 200 EMA Trend Direction [Dr.K.C.Prakash]
The "200 EMA Trend Direction [Dr.K.C.Prakash]" indicator is a visual trend-following tool designed to identify and confirm major market direction using the slope of the 200-period Exponential Moving Average (EMA). It’s ideal for traders who want to stay on the right side of the trend and avoid noise.
🔍 Key Components
1. 200 EMA (Exponential Moving Average)
The 200 EMA is a widely used long-term trend indicator in technical analysis.
It reacts faster than the simple moving average (SMA) due to its weighting toward recent prices.
2. Trend Detection Logic
Uptrend is detected when the current EMA value is higher than the previous candle’s EMA.
Downtrend is detected when the EMA starts sloping downward, i.e., current EMA < previous EMA.
🎨 Visual Representation
Green EMA Line: Indicates the 200 EMA is rising → bullish trend (uptrend).
Red EMA Line: Indicates the 200 EMA is falling → bearish trend (downtrend).
This color-coding helps you instantly understand the market context without needing to analyze multiple indicators.
✅ Best Use Cases
📈 Trend Confirmation: Use it to confirm the direction before entering a trade.
⚠️ Avoid Counter-Trend Trades: Helps in staying aligned with the dominant trend.
🧠 Supports All Timeframes: Although best suited for 5m, 15m, or higher, it can also be used for 1-minute charts in scalping systems when aligned with higher timeframes.
⚙️ Customization Possibilities
You can extend this indicator with:
🔔 Trend change alerts
🟩🟥 Background shading based on trend
💹 Buy/Sell signals when price crosses above/below the 200 EMA
Açık kaynak kodlu komut dosyası
Gerçek TradingView ruhuna uygun olarak, bu komut dosyasının oluşturucusu bunu açık kaynaklı hale getirmiştir, böylece yatırımcılar betiğin işlevselliğini inceleyip doğrulayabilir. Yazara saygı! Ücretsiz olarak kullanabilirsiniz, ancak kodu yeniden yayınlamanın Site Kurallarımıza tabi olduğunu unutmayın.
Feragatname
Bilgiler ve yayınlar, TradingView tarafından sağlanan veya onaylanan finansal, yatırım, işlem veya diğer türden tavsiye veya tavsiyeler anlamına gelmez ve teşkil etmez. Kullanım Şartları'nda daha fazlasını okuyun.