PROTECTED SOURCE SCRIPT
52SIGNAL RECIPE EMA Trend
═══ 52SIGNAL RECIPE EMA Trend ═══
◆ Overview
52SIGNAL RECIPE EMA Trend is a powerful visual tool that allows you to instantly grasp market trends without complex chart analysis. It represents the direction and strength of trends through an intuitive color-coding system based on the relative positions of three Exponential Moving Averages (EMAs).
─────────────────────────────────────
◆ Key Features
• Trend Direction and Strength Visualization: Instantly identify trend direction and strength through an intuitive color-coding system
• EMA Relationship Analysis: Analyze the relative positions of short-term, medium-term, and long-term EMAs to determine trend status
• Clean Separate Window Display: Provides clear visual representation in a window separate from the price chart
─────────────────────────────────────
◆ Technical Foundation
52SIGNAL RECIPE EMA Trend utilizes the following three EMAs:
• Short-term EMA (default: 9)
• Medium-term EMA (default: 20)
• Long-term EMA (default: 50)
By analyzing the relative positions of these three EMAs, it determines the following trend states:
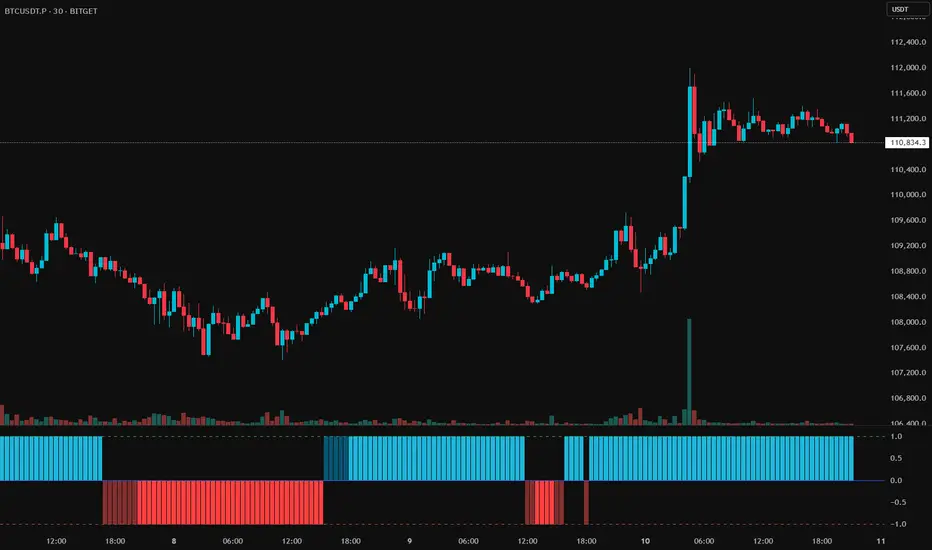
■ Intuitive Color-Coding System
• Bullish Trend (Blue Zones)
▶ Bright Blue: Strong bullish trend - Short-term EMA > Medium-term EMA and Short-term EMA > Long-term EMA
▶ Dark Blue: Weak bullish trend - Short-term EMA > Medium-term EMA but Short-term EMA < Long-term EMA
• Bearish Trend (Red Zones)
▶ Bright Red: Strong bearish trend - Short-term EMA < Medium-term EMA and Short-term EMA < Long-term EMA
▶ Dark Red: Weak bearish trend - Short-term EMA < Medium-term EMA but Short-term EMA > Long-term EMA
─────────────────────────────────────
◆ Practical Applications
■ Trend Identification
• Bullish Trend: Blue zones indicate an ongoing bullish trend. Particularly, bright blue zones represent a strong bullish trend with all EMAs aligned.
• Bearish Trend: Red zones indicate an ongoing bearish trend. Bright red zones suggest strong bearish momentum.
• Trend Reversal: When the color changes from blue to red (or vice versa), it indicates that a trend reversal has occurred.
■ Trading Strategy Applications
• Consider Long Positions: When transitioning to blue zones, especially when changing from dark blue to bright blue, consider long positions.
• Consider Short Positions: When transitioning to red zones, especially when changing from dark red to bright red, consider short positions.
• Position Maintenance/Management: Maintain existing positions while the same color persists, and reassess risk management when color intensity changes.
■ Synergy with Other Indicators
52SIGNAL RECIPE EMA Trend is more effective when used alongside these indicators:
• RSI: Verify overbought/oversold conditions to optimize entry points within trends
• Volume Indicators: Validate trend strength through volume confirmation
• Support/Resistance Levels: Analyze with key price levels to determine entry/exit points
• Bollinger Bands: Identify volatility within trends and potential reversal points
─────────────────────────────────────
◆ Customization
You can adjust the following parameters as needed:
• Short-term EMA Length: Decrease for more sensitive reactions, increase for smoother signals
• Medium-term EMA Length: Adjust for medium-term trend perspective
• Long-term EMA Length: Adjust for long-term trend filtering strength
─────────────────────────────────────
◆ Conclusion
52SIGNAL RECIPE EMA Trend is a powerful visualization tool that enables intuitive understanding of market trends. It allows for immediate recognition of trend direction and strength without complex analysis, making it applicable to various trading styles from short-term traders to long-term investors.
This indicator is most effective when used as a tool to visualize trend conditions rather than as an independent trading signal generator. Always use it in conjunction with other technical/fundamental analysis tools to make more robust trading decisions.
─────────────────────────────────────
※ Disclaimer: Past performance does not guarantee future results. Always use appropriate risk management strategies.
═══ 52SIGNAL RECIPE EMA 트렌드 ═══
◆ 개요
52SIGNAL RECIPE EMA 트렌드는 복잡한 차트 분석 없이도 시장 트렌드를 즉시 파악할 수 있는 강력한 시각적 도구입니다. 세 가지 지수 이동 평균선(EMA)의 상대적 위치를 기반으로 한 직관적인 색상 코딩 시스템을 통해 트렌드의 방향과 강도를 표현합니다.
─────────────────────────────────────
◆ 주요 특징
• 트렌드 방향 및 강도 시각화: 직관적인 색상 코딩 시스템을 통해 트렌드 방향과 강도를 즉시 식별
• EMA 관계 분석: 단기, 중기, 장기 EMA의 상대적 위치를 분석하여 트렌드 상태 판단
• 깔끔한 별도 창 표시: 가격 차트와 별도의 창에서 명확한 시각적 표현 제공
─────────────────────────────────────
◆ 기술적 기반
52SIGNAL RECIPE EMA 트렌드는 다음 세 가지 EMA를 활용합니다:
• 단기 EMA (기본값: 9)
• 중기 EMA (기본값: 20)
• 장기 EMA (기본값: 50)
이 세 가지 EMA의 상대적 위치를 분석하여 다음과 같은 트렌드 상태를 결정합니다:
■ 직관적인 색상 코딩 시스템
• 강세 트렌드 (파란색 영역)
▶ 밝은 파란색: 강한 강세 트렌드 - 단기 EMA > 중기 EMA 그리고 단기 EMA > 장기 EMA
▶ 어두운 파란색: 약한 강세 트렌드 - 단기 EMA > 중기 EMA 하지만 단기 EMA < 장기 EMA
• 약세 트렌드 (빨간색 영역)
▶ 밝은 빨간색: 강한 약세 트렌드 - 단기 EMA < 중기 EMA 그리고 단기 EMA < 장기 EMA
▶ 어두운 빨간색: 약한 약세 트렌드 - 단기 EMA < 중기 EMA 하지만 단기 EMA > 장기 EMA
─────────────────────────────────────
◆ 실용적 응용
■ 트렌드 식별
• 강세 트렌드: 파란색 영역은 진행 중인 강세 트렌드를 나타냅니다. 특히 밝은 파란색 영역은 모든 EMA가 정렬된 강한 강세 트렌드를 나타냅니다.
• 약세 트렌드: 빨간색 영역은 진행 중인 약세 트렌드를 나타냅니다. 밝은 빨간색 영역은 강한 약세 모멘텀을 시사합니다.
• 트렌드 반전: 색상이 파란색에서 빨간색으로(또는 그 반대로) 변경되면 트렌드 반전이 발생했음을 나타냅니다.
■ 트레이딩 전략 응용
• 롱 포지션 고려: 파란색 영역으로 전환될 때, 특히 어두운 파란색에서 밝은 파란색으로 변경될 때 롱 포지션을 고려하세요.
• 숏 포지션 고려: 빨간색 영역으로 전환될 때, 특히 어두운 빨간색에서 밝은 빨간색으로 변경될 때 숏 포지션을 고려하세요.
• 포지션 유지/관리: 같은 색상이 지속되는 동안 기존 포지션을 유지하고, 색상 강도가 변경될 때 리스크 관리를 재평가하세요.
■ 다른 지표와의 시너지
52SIGNAL RECIPE EMA 트렌드는 다음 지표들과 함께 사용할 때 더 효과적입니다:
• RSI: 과매수/과매도 상태를 확인하여 트렌드 내 진입 시점 최적화
• 거래량 지표: 거래량 확인을 통한 트렌드 강도 검증
• 지지/저항 레벨: 주요 가격 레벨과 함께 분석하여 진입/퇴출 시점 결정
• 볼린저 밴드: 트렌드 내 변동성과 잠재적 반전 지점 식별
─────────────────────────────────────
◆ 커스터마이징
필요에 따라 다음 매개변수를 조정할 수 있습니다:
• 단기 EMA 길이: 더 민감한 반응을 위해 감소, 더 부드러운 신호를 위해 증가
• 중기 EMA 길이: 중기 트렌드 관점에 맞게 조정
• 장기 EMA 길이: 장기 트렌드 필터링 강도 조정
─────────────────────────────────────
◆ 결론
52SIGNAL RECIPE EMA 트렌드는 시장 트렌드를 직관적으로 이해할 수 있게 해주는 강력한 시각화 도구입니다. 복잡한 분석 없이 트렌드 방향과 강도를 즉시 인식할 수 있어, 단기 트레이더부터 장기 투자자까지 다양한 트레이딩 스타일에 적용할 수 있습니다.
이 지표는 독립적인 트레이딩 신호 생성기보다는 트렌드 상태를 시각화하는 도구로 사용할 때 가장 효과적입니다. 항상 다른 기술적/기본적 분석 도구와 함께 사용하여 더 견고한 트레이딩 결정을 내리세요.
─────────────────────────────────────
※ 면책 조항: 과거 성과가 미래 결과를 보장하지 않습니다. 항상 적절한 리스크 관리 전략을 사용하세요.
◆ Overview
52SIGNAL RECIPE EMA Trend is a powerful visual tool that allows you to instantly grasp market trends without complex chart analysis. It represents the direction and strength of trends through an intuitive color-coding system based on the relative positions of three Exponential Moving Averages (EMAs).
─────────────────────────────────────
◆ Key Features
• Trend Direction and Strength Visualization: Instantly identify trend direction and strength through an intuitive color-coding system
• EMA Relationship Analysis: Analyze the relative positions of short-term, medium-term, and long-term EMAs to determine trend status
• Clean Separate Window Display: Provides clear visual representation in a window separate from the price chart
─────────────────────────────────────
◆ Technical Foundation
52SIGNAL RECIPE EMA Trend utilizes the following three EMAs:
• Short-term EMA (default: 9)
• Medium-term EMA (default: 20)
• Long-term EMA (default: 50)
By analyzing the relative positions of these three EMAs, it determines the following trend states:
■ Intuitive Color-Coding System
• Bullish Trend (Blue Zones)
▶ Bright Blue: Strong bullish trend - Short-term EMA > Medium-term EMA and Short-term EMA > Long-term EMA
▶ Dark Blue: Weak bullish trend - Short-term EMA > Medium-term EMA but Short-term EMA < Long-term EMA
• Bearish Trend (Red Zones)
▶ Bright Red: Strong bearish trend - Short-term EMA < Medium-term EMA and Short-term EMA < Long-term EMA
▶ Dark Red: Weak bearish trend - Short-term EMA < Medium-term EMA but Short-term EMA > Long-term EMA
─────────────────────────────────────
◆ Practical Applications
■ Trend Identification
• Bullish Trend: Blue zones indicate an ongoing bullish trend. Particularly, bright blue zones represent a strong bullish trend with all EMAs aligned.
• Bearish Trend: Red zones indicate an ongoing bearish trend. Bright red zones suggest strong bearish momentum.
• Trend Reversal: When the color changes from blue to red (or vice versa), it indicates that a trend reversal has occurred.
■ Trading Strategy Applications
• Consider Long Positions: When transitioning to blue zones, especially when changing from dark blue to bright blue, consider long positions.
• Consider Short Positions: When transitioning to red zones, especially when changing from dark red to bright red, consider short positions.
• Position Maintenance/Management: Maintain existing positions while the same color persists, and reassess risk management when color intensity changes.
■ Synergy with Other Indicators
52SIGNAL RECIPE EMA Trend is more effective when used alongside these indicators:
• RSI: Verify overbought/oversold conditions to optimize entry points within trends
• Volume Indicators: Validate trend strength through volume confirmation
• Support/Resistance Levels: Analyze with key price levels to determine entry/exit points
• Bollinger Bands: Identify volatility within trends and potential reversal points
─────────────────────────────────────
◆ Customization
You can adjust the following parameters as needed:
• Short-term EMA Length: Decrease for more sensitive reactions, increase for smoother signals
• Medium-term EMA Length: Adjust for medium-term trend perspective
• Long-term EMA Length: Adjust for long-term trend filtering strength
─────────────────────────────────────
◆ Conclusion
52SIGNAL RECIPE EMA Trend is a powerful visualization tool that enables intuitive understanding of market trends. It allows for immediate recognition of trend direction and strength without complex analysis, making it applicable to various trading styles from short-term traders to long-term investors.
This indicator is most effective when used as a tool to visualize trend conditions rather than as an independent trading signal generator. Always use it in conjunction with other technical/fundamental analysis tools to make more robust trading decisions.
─────────────────────────────────────
※ Disclaimer: Past performance does not guarantee future results. Always use appropriate risk management strategies.
═══ 52SIGNAL RECIPE EMA 트렌드 ═══
◆ 개요
52SIGNAL RECIPE EMA 트렌드는 복잡한 차트 분석 없이도 시장 트렌드를 즉시 파악할 수 있는 강력한 시각적 도구입니다. 세 가지 지수 이동 평균선(EMA)의 상대적 위치를 기반으로 한 직관적인 색상 코딩 시스템을 통해 트렌드의 방향과 강도를 표현합니다.
─────────────────────────────────────
◆ 주요 특징
• 트렌드 방향 및 강도 시각화: 직관적인 색상 코딩 시스템을 통해 트렌드 방향과 강도를 즉시 식별
• EMA 관계 분석: 단기, 중기, 장기 EMA의 상대적 위치를 분석하여 트렌드 상태 판단
• 깔끔한 별도 창 표시: 가격 차트와 별도의 창에서 명확한 시각적 표현 제공
─────────────────────────────────────
◆ 기술적 기반
52SIGNAL RECIPE EMA 트렌드는 다음 세 가지 EMA를 활용합니다:
• 단기 EMA (기본값: 9)
• 중기 EMA (기본값: 20)
• 장기 EMA (기본값: 50)
이 세 가지 EMA의 상대적 위치를 분석하여 다음과 같은 트렌드 상태를 결정합니다:
■ 직관적인 색상 코딩 시스템
• 강세 트렌드 (파란색 영역)
▶ 밝은 파란색: 강한 강세 트렌드 - 단기 EMA > 중기 EMA 그리고 단기 EMA > 장기 EMA
▶ 어두운 파란색: 약한 강세 트렌드 - 단기 EMA > 중기 EMA 하지만 단기 EMA < 장기 EMA
• 약세 트렌드 (빨간색 영역)
▶ 밝은 빨간색: 강한 약세 트렌드 - 단기 EMA < 중기 EMA 그리고 단기 EMA < 장기 EMA
▶ 어두운 빨간색: 약한 약세 트렌드 - 단기 EMA < 중기 EMA 하지만 단기 EMA > 장기 EMA
─────────────────────────────────────
◆ 실용적 응용
■ 트렌드 식별
• 강세 트렌드: 파란색 영역은 진행 중인 강세 트렌드를 나타냅니다. 특히 밝은 파란색 영역은 모든 EMA가 정렬된 강한 강세 트렌드를 나타냅니다.
• 약세 트렌드: 빨간색 영역은 진행 중인 약세 트렌드를 나타냅니다. 밝은 빨간색 영역은 강한 약세 모멘텀을 시사합니다.
• 트렌드 반전: 색상이 파란색에서 빨간색으로(또는 그 반대로) 변경되면 트렌드 반전이 발생했음을 나타냅니다.
■ 트레이딩 전략 응용
• 롱 포지션 고려: 파란색 영역으로 전환될 때, 특히 어두운 파란색에서 밝은 파란색으로 변경될 때 롱 포지션을 고려하세요.
• 숏 포지션 고려: 빨간색 영역으로 전환될 때, 특히 어두운 빨간색에서 밝은 빨간색으로 변경될 때 숏 포지션을 고려하세요.
• 포지션 유지/관리: 같은 색상이 지속되는 동안 기존 포지션을 유지하고, 색상 강도가 변경될 때 리스크 관리를 재평가하세요.
■ 다른 지표와의 시너지
52SIGNAL RECIPE EMA 트렌드는 다음 지표들과 함께 사용할 때 더 효과적입니다:
• RSI: 과매수/과매도 상태를 확인하여 트렌드 내 진입 시점 최적화
• 거래량 지표: 거래량 확인을 통한 트렌드 강도 검증
• 지지/저항 레벨: 주요 가격 레벨과 함께 분석하여 진입/퇴출 시점 결정
• 볼린저 밴드: 트렌드 내 변동성과 잠재적 반전 지점 식별
─────────────────────────────────────
◆ 커스터마이징
필요에 따라 다음 매개변수를 조정할 수 있습니다:
• 단기 EMA 길이: 더 민감한 반응을 위해 감소, 더 부드러운 신호를 위해 증가
• 중기 EMA 길이: 중기 트렌드 관점에 맞게 조정
• 장기 EMA 길이: 장기 트렌드 필터링 강도 조정
─────────────────────────────────────
◆ 결론
52SIGNAL RECIPE EMA 트렌드는 시장 트렌드를 직관적으로 이해할 수 있게 해주는 강력한 시각화 도구입니다. 복잡한 분석 없이 트렌드 방향과 강도를 즉시 인식할 수 있어, 단기 트레이더부터 장기 투자자까지 다양한 트레이딩 스타일에 적용할 수 있습니다.
이 지표는 독립적인 트레이딩 신호 생성기보다는 트렌드 상태를 시각화하는 도구로 사용할 때 가장 효과적입니다. 항상 다른 기술적/기본적 분석 도구와 함께 사용하여 더 견고한 트레이딩 결정을 내리세요.
─────────────────────────────────────
※ 면책 조항: 과거 성과가 미래 결과를 보장하지 않습니다. 항상 적절한 리스크 관리 전략을 사용하세요.
Korumalı komut dosyası
Bu komut dosyası kapalı kaynak olarak yayınlanmaktadır. Ancak, ücretsiz ve herhangi bir sınırlama olmaksızın kullanabilirsiniz – daha fazla bilgiyi buradan edinebilirsiniz.
Recipe your trading with 52SIGNAL.
No more repainting tricks, fake backtesting data, or unrealistic returns.
No more repainting tricks, fake backtesting data, or unrealistic returns.
Feragatname
Bilgiler ve yayınlar, TradingView tarafından sağlanan veya onaylanan finansal, yatırım, alım satım veya diğer türden tavsiye veya öneriler anlamına gelmez ve teşkil etmez. Kullanım Koşulları bölümünde daha fazlasını okuyun.