OPEN-SOURCE SCRIPT
Offset Project
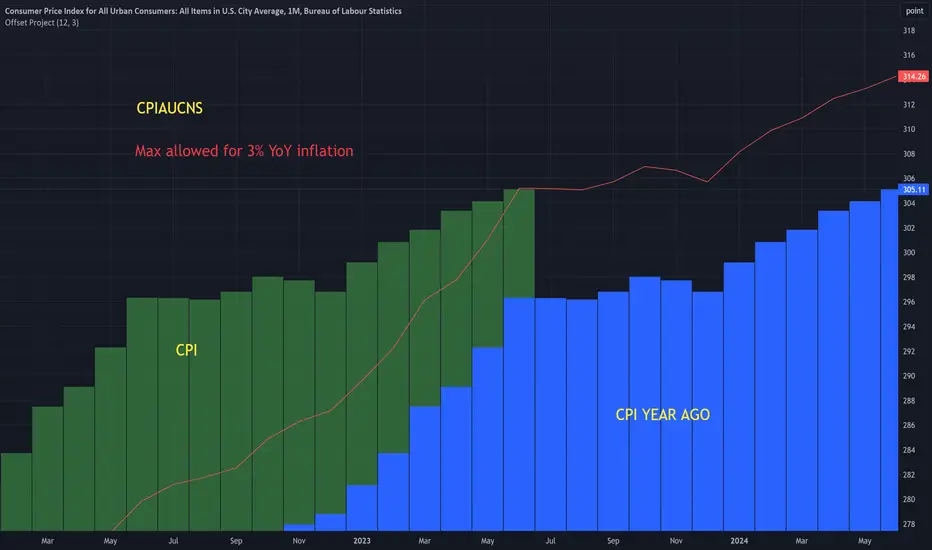
Intended for use with CPI symbols like:
CPIAUCNS (all items)
CPILFENS (core)
Shows the CPI values from a year ago, next to the current values. This makes it easier to visualize the base effects.
Has a 'max inflation rate' parameter. This is shown as a red line. So for example, if it's set to 3, then CPI must stay below the red line in in order for the inflation rate to stay below 3.
Açık kaynak kodlu komut dosyası
Gerçek TradingView ruhuyla, bu komut dosyasının mimarı, yatırımcıların işlevselliğini inceleyip doğrulayabilmesi için onu açık kaynaklı hale getirdi. Yazarı tebrik ederiz! Ücretsiz olarak kullanabilseniz de, kodu yeniden yayınlamanın Topluluk Kurallarımıza tabi olduğunu unutmayın.
Feragatname
Bilgiler ve yayınlar, TradingView tarafından sağlanan veya onaylanan finansal, yatırım, alım satım veya diğer türden tavsiye veya öneriler anlamına gelmez ve teşkil etmez. Kullanım Koşulları bölümünde daha fazlasını okuyun.