OPEN-SOURCE SCRIPT
Güncellendi Single Candle Model-DTFX
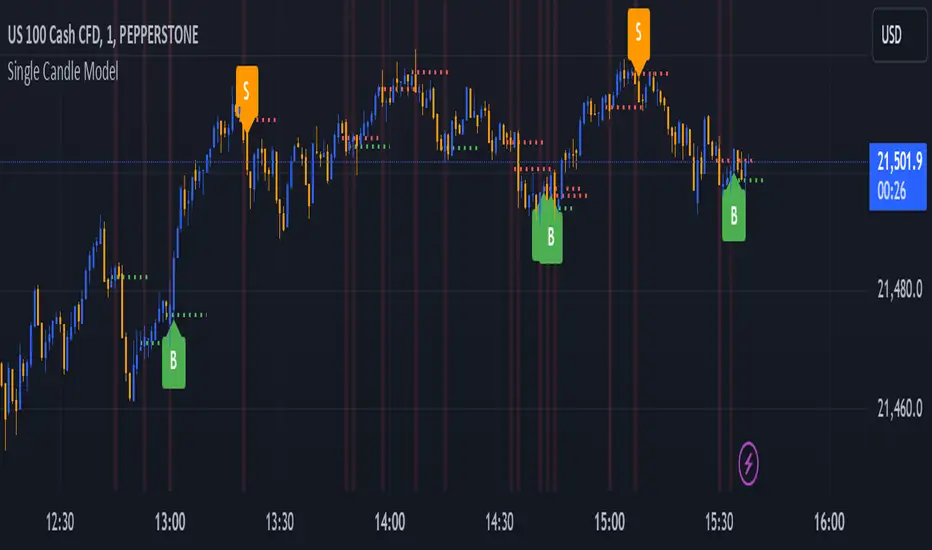
The script identifies the candles with engulfing body and marks the 50% of the candle for easy entry based on model of #DTFX single candle entry
Interpreting the Signals:
Look for candles labeled as "BE". These represent significant price action where the range is larger than the previous candle's range.
Pay attention to the 50% line of the "BE" candle:
A green line indicates a bullish "BE" candle.
A red line indicates a bearish "BE" candle.
Watch for Buy ("B") and Sell ("S") labels:
"B": Indicates a potential bullish breakout.
"S": Indicates a potential bearish breakdown.
Alerts:
Configure alerts in TradingView to notify you whenever a "B" or "S" signal is detected. This allows you to act on the signals without constantly monitoring the chart.
Use in Trading Strategies:
Combine this indicator with other tools like support/resistance levels, moving averages, or trend analysis to validate the signals.
Use the midpoint (50% line) of the "BE" candle as a potential reference point for stop-loss or target levels.
Customizations:
Adjust the appearance of labels and lines by modifying their style, color, or placement in the script.
Add filters (e.g., timeframes or volume conditions) to refine the detection of "BE" candles.
This indicator helps traders identify pivotal price movements and act on potential breakouts or breakdowns with clear visual markers and alerts.
Sürüm Notları
updated for the overlayAçık kaynak kodlu komut dosyası
Gerçek TradingView ruhuyla, bu komut dosyasının mimarı, yatırımcıların işlevselliğini inceleyip doğrulayabilmesi için onu açık kaynaklı hale getirdi. Yazarı tebrik ederiz! Ücretsiz olarak kullanabilseniz de, kodu yeniden yayınlamanın Topluluk Kurallarımıza tabi olduğunu unutmayın.
Feragatname
Bilgiler ve yayınlar, TradingView tarafından sağlanan veya onaylanan finansal, yatırım, alım satım veya diğer türden tavsiye veya öneriler anlamına gelmez ve teşkil etmez. Kullanım Koşulları bölümünde daha fazlasını okuyun.
Açık kaynak kodlu komut dosyası
Gerçek TradingView ruhuyla, bu komut dosyasının mimarı, yatırımcıların işlevselliğini inceleyip doğrulayabilmesi için onu açık kaynaklı hale getirdi. Yazarı tebrik ederiz! Ücretsiz olarak kullanabilseniz de, kodu yeniden yayınlamanın Topluluk Kurallarımıza tabi olduğunu unutmayın.
Feragatname
Bilgiler ve yayınlar, TradingView tarafından sağlanan veya onaylanan finansal, yatırım, alım satım veya diğer türden tavsiye veya öneriler anlamına gelmez ve teşkil etmez. Kullanım Koşulları bölümünde daha fazlasını okuyun.