OPEN-SOURCE SCRIPT
Candle Height in Percentage - Columns
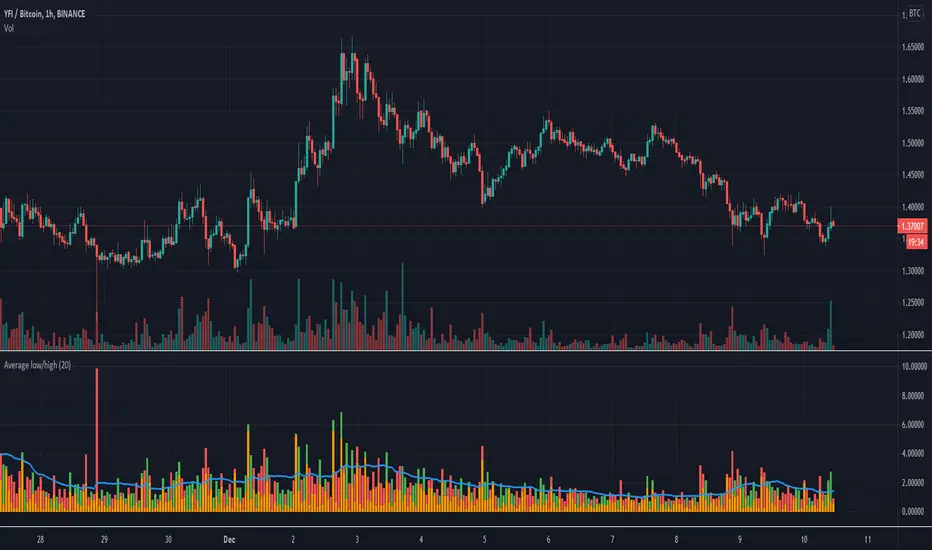
This indicator calculates the difference in percentage between lows and highs of a candle. The orange bars show the height of the candle body (open/close) and the red/green on top show the percentage of the wicks (high/low). This assists in understanding the volatility of an asset. Showing this in percentages is more helpful in crypto. It also shows the Simple Moving Average of this data with the blue line.
Açık kaynak kodlu komut dosyası
Gerçek TradingView ruhuyla, bu komut dosyasının mimarı, yatırımcıların işlevselliğini inceleyip doğrulayabilmesi için onu açık kaynaklı hale getirdi. Yazarı tebrik ederiz! Ücretsiz olarak kullanabilseniz de, kodu yeniden yayınlamanın Topluluk Kurallarımıza tabi olduğunu unutmayın.
Feragatname
Bilgiler ve yayınlar, TradingView tarafından sağlanan veya onaylanan finansal, yatırım, alım satım veya diğer türden tavsiye veya öneriler anlamına gelmez ve teşkil etmez. Kullanım Koşulları bölümünde daha fazlasını okuyun.