Flag Breakout Bullish Daily TF by SidHem
Overview:
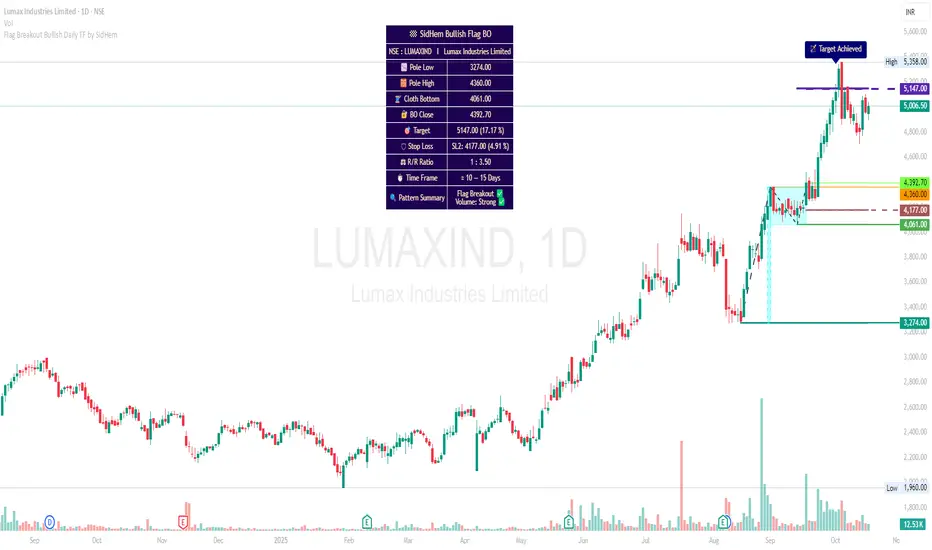
This indicator helps analyze Bullish Flag Breakouts (Rectangle) on the Daily Time Frame, providing a clear visual and tabular summary of key levels, stop-loss zones, expected pattern target and metrics. Traders can quickly assess breakout validity, risk/reward, and target achievement without manual calculations.
Please Note:
Flags are not auto-detected. Traders input four key dates: Pole start, Pole high, Cloth bottom, and Breakout candle. The indicator then calculates and plots all essential levels—including Pole, Cloth, Breakout Open/Close/Mean, Stop Loss, and Expected Pattern Target prices. This allows users who understand flag patterns but are unsure how to calculate targets or SL to efficiently work with the pattern.
Features:
Visualization: Highlights Pole, Cloth, and Breakout candles with horizontal rays, optional diagonal Pole lines, V-Arms, and filled boxes for clarity.
Dynamic Table Summary:
Displays symbol, Pole Low/High, Cloth Bottom, Breakout Open/Close/Mean, Expected Pattern Target, Stop Loss (3 methods, preferably on closing basis), Pole Height, Risk/Reward Ratio, Bars to Breakout, Estimated Time Frame, Pattern Summary, Flag Breakout status, and Volume strength.
Target & SL Labels: Plots target and SL lines on the chart with Expected Pattern Target, Target Achieved, and SL labels.
Customizable Appearance: Adjustable table rows, label sizes, colors, styles, widths, and transparency.
Purpose:
Accurately analyzes Bullish Flag Breakouts by entering only the four required dates; all plotting, calculation, and table generation are automated.
Yalnızca davetli komut dosyası
Bu komut dosyasına yalnızca yazar tarafından onaylanan kullanıcılar erişebilir. Kullanmak için izin istemeniz ve almanız gerekir. Bu genellikle ödeme yapıldıktan sonra verilir. Daha fazla ayrıntı için aşağıdaki yazarın talimatlarını izleyin veya doğrudan sidhem ile iletişime geçin.
TradingView, yazarına tamamen güvenmediğiniz ve nasıl çalıştığını anlamadığınız sürece bir komut dosyası için ödeme yapmanızı veya kullanmanızı TAVSİYE ETMEZ. Ayrıca topluluk komut dosyalarımızda ücretsiz, açık kaynaklı alternatifler bulabilirsiniz.
Yazarın talimatları
Feragatname
Yalnızca davetli komut dosyası
Bu komut dosyasına yalnızca yazar tarafından onaylanan kullanıcılar erişebilir. Kullanmak için izin istemeniz ve almanız gerekir. Bu genellikle ödeme yapıldıktan sonra verilir. Daha fazla ayrıntı için aşağıdaki yazarın talimatlarını izleyin veya doğrudan sidhem ile iletişime geçin.
TradingView, yazarına tamamen güvenmediğiniz ve nasıl çalıştığını anlamadığınız sürece bir komut dosyası için ödeme yapmanızı veya kullanmanızı TAVSİYE ETMEZ. Ayrıca topluluk komut dosyalarımızda ücretsiz, açık kaynaklı alternatifler bulabilirsiniz.