OPEN-SOURCE SCRIPT
Kaufman Stress Indicator
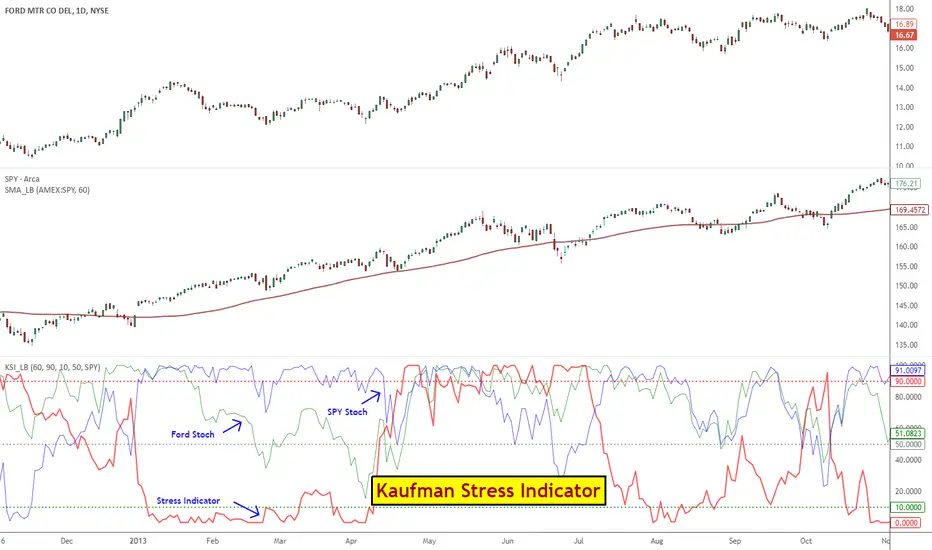
Stress Indicator, first proposed by Mr. Perry Kaufman, provides an easy way for trading pairs / arbs.
Kaufman's trading rules for Stress Indicator:
- Decide on a pair to trade: For ex., AAPL v QQQ
- Calculate the Stress Indicator (SI) for that pair
- Buy the stock when SI 50
- Calculate the 60-day moving average of QQQ
- If the trend of QQQ is down, hedge the stock position with QQQ equal to the risk of the stock using the 20-day ATR of each
- Exit the hedge when the stock position exits, or exit the hedge when the trend of QQQ turns up
- Do not trade stocks under $3
Explanation of all potential SI applications is beyond this post. For more info:
- ptasite.s3.amazonaws.com/videos/StockTimingUsingPairsLogic.pdf
- futuresmag.com/2008/12/15/crossover-relative-value-trading
- kaufmansignals.com/timing/
- TASC 2014 March issue.
Though Kaufman's Stress stategy is built on top of this Stress Indicator, I suggest reading up his full strategy guidelines before applying this.
Kaufman suggests using 60SMA on the index to track the slope. I have included a custom SMA (find it in the middle pane) that can show SMA for any selected symbol. Use the guide below to import that in to your charts: drive.google.com/file/d/0Bx48Du_2aPFncUhIemNrZUY1dTA/edit?usp=sharing
Açık kaynak kodlu komut dosyası
Gerçek TradingView ruhuna uygun olarak, bu komut dosyasının oluşturucusu bunu açık kaynaklı hale getirmiştir, böylece yatırımcılar betiğin işlevselliğini inceleyip doğrulayabilir. Yazara saygı! Ücretsiz olarak kullanabilirsiniz, ancak kodu yeniden yayınlamanın Site Kurallarımıza tabi olduğunu unutmayın.
List of my free indicators: bit.ly/1LQaPK8
List of my indicators at Appstore: blog.tradingview.com/?p=970
List of my indicators at Appstore: blog.tradingview.com/?p=970
Feragatname
Bilgiler ve yayınlar, TradingView tarafından sağlanan veya onaylanan finansal, yatırım, işlem veya diğer türden tavsiye veya tavsiyeler anlamına gelmez ve teşkil etmez. Kullanım Şartları'nda daha fazlasını okuyun.