OPEN-SOURCE SCRIPT
Güncellendi [ BETA ][ IND ][ LIB ] Dynamic LookBack RSI Range

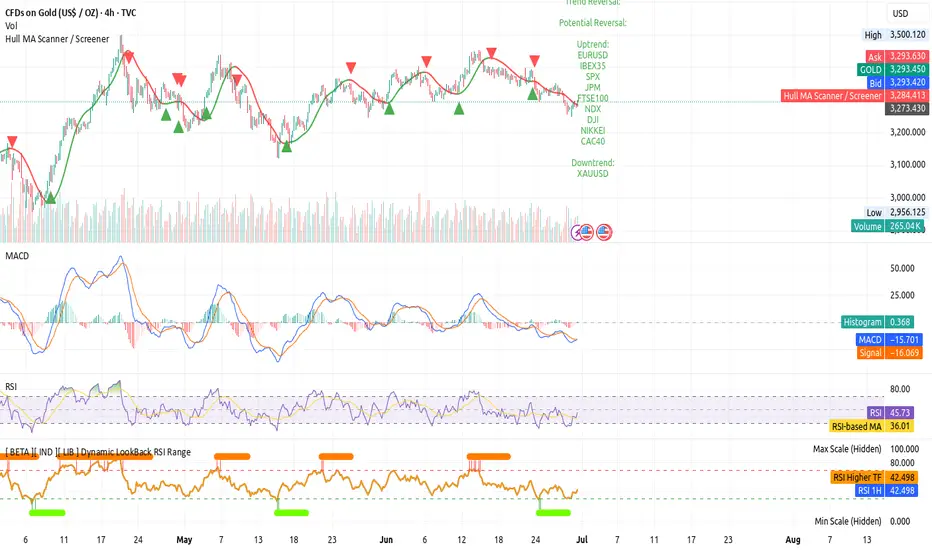
Get visual confirmation with this indicator if the current range selected had been oversold or overbough in the latest n bars
Sürüm Notları
Dynamic LookBack RSI Range is an indicator designed for multi-timeframe Relative Strength Index (RSI) analysis.It computes and displays RSI values from both the current chart's timeframe and a user-definable higher timeframe that helps to detect historical RSI extreme conditions within a specified lookback window on the higher timeframe.
Key Features:
Dual RSI Calculation & Plotting:
Calculates and plots the RSI (Relative Strength Index) for the current chart's timeframe based on close price and a user-defined rsiLength (default 14).
Calculates and plots the RSI for a Higher Timeframe (HTF), specified by the higherTimeframe input (options include "1", "5", "15", "30", "60", "120", "180", "240", "360", "480", "D"). This calculation is performed using request.security to ensure accurate HTF data.
Dynamic HTF Extreme Range Check:
Utilizes request.security in conjunction with math.sum to determine if the HTF RSI has been above the rsiOverbought level or below the rsiOversold level at any point within the rsiHTFLookbackBarsForRange number of bars on the selected higherTimeframe.
Boolean outputs wasHTFOverboughtInLookback and wasHTFOversoldInLookback are generated based on this lookback analysis.
Configurable Parameters:
rsiLength: Integer input for the RSI calculation period (default 14).
rsiOverbought: Integer input for the RSI overbought threshold (default 70).
rsiOversold: Integer input for the RSI oversold threshold (default 30).
higherTimeframe: String input for selecting the aggregation period for the HTF RSI.
rsiHTFLookbackBarsForRange: Integer input specifying the number of higher timeframe bars to check for past extreme RSI conditions (default 20).
Visual Representation:
Plots both current and HTF RSI lines on a dedicated pane.
Horizontal lines indicate the rsiOverbought and rsiOversold levels.
plotshape elements are used to visualize specific events:
Arrows (Down/Up): Indicate when the current HTF RSI crosses above rsiOverbought or below rsiOversold.
Circles (Top/Bottom): Mark bars where the HTF RSI was overbought or oversold within the rsiHTFLookbackBarsForRange period.
Alert Conditions:
Provides four distinct alert conditions for automated notifications:
HTF RSI crossing above rsiOverbought.
HTF RSI crossing below rsiOversold.
wasHTFOverboughtInLookback.
wasHTFOversoldInLookback.
Açık kaynak kodlu komut dosyası
Gerçek TradingView ruhuyla, bu komut dosyasının mimarı, yatırımcıların işlevselliğini inceleyip doğrulayabilmesi için onu açık kaynaklı hale getirdi. Yazarı tebrik ederiz! Ücretsiz olarak kullanabilseniz de, kodu yeniden yayınlamanın Topluluk Kurallarımıza tabi olduğunu unutmayın.
Feragatname
Bilgiler ve yayınlar, TradingView tarafından sağlanan veya onaylanan finansal, yatırım, alım satım veya diğer türden tavsiye veya öneriler anlamına gelmez ve teşkil etmez. Kullanım Koşulları bölümünde daha fazlasını okuyun.