OPEN-SOURCE SCRIPT
Three EMA Crossover Trading Strategy
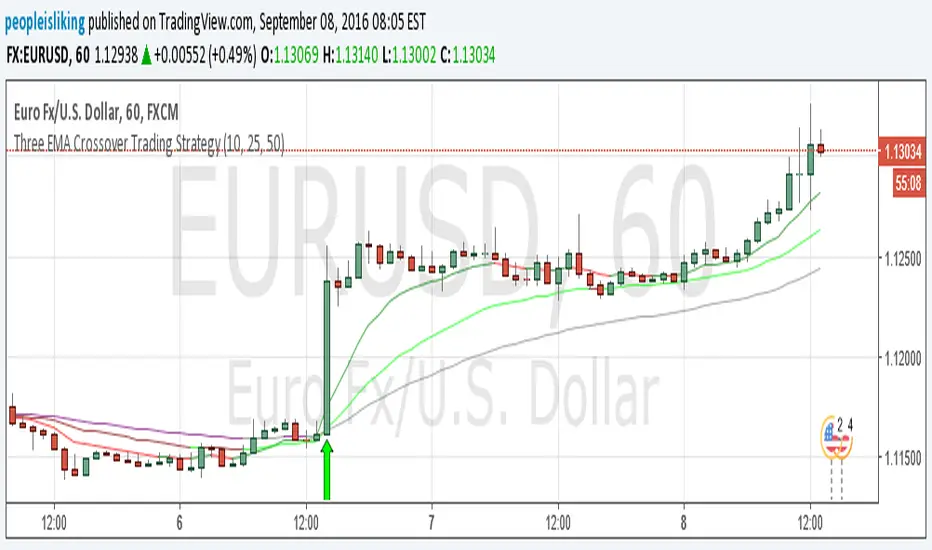
Use it with any forex currency pair or any stock with any timeframe.
It is a trend following trading strategy so works best in trending market.
So once you identify the market is trading you just simply use this trading strategy.
Video Explanation : Youtube
Detail Explanation : https://www.peopleisliking.com
It is a trend following trading strategy so works best in trending market.
So once you identify the market is trading you just simply use this trading strategy.
Video Explanation : Youtube
Detail Explanation : https://www.peopleisliking.com
Açık kaynak kodlu komut dosyası
Gerçek TradingView ruhuna uygun olarak, bu komut dosyasının oluşturucusu bunu açık kaynaklı hale getirmiştir, böylece yatırımcılar betiğin işlevselliğini inceleyip doğrulayabilir. Yazara saygı! Ücretsiz olarak kullanabilirsiniz, ancak kodu yeniden yayınlamanın Site Kurallarımıza tabi olduğunu unutmayın.
Feragatname
Bilgiler ve yayınlar, TradingView tarafından sağlanan veya onaylanan finansal, yatırım, işlem veya diğer türden tavsiye veya tavsiyeler anlamına gelmez ve teşkil etmez. Kullanım Şartları'nda daha fazlasını okuyun.