OPEN-SOURCE SCRIPT
Unlocking the Power of Long Candle Midpoint
I'm excited to share with you a fascinating concept that can help you identify potential breakout points in the market.
The Pine Script code provided below is designed to identify the midpoint of a long candle, which can be a crucial level for traders to watch.
In this blog post, we'll dive deeper into the concept, explore its applications, and analyze a real-life example of TATACHEM listed on NSE, which is currently trading around a potential psychology line.
What is the Long Candle Midpoint?
The long candle midpoint is a technical indicator that calculates the midpoint of a candlestick that has a significant price movement. This midpoint is then used to draw a horizontal line, which can serve as a potential support or resistance level. The idea is that if a candlestick has a large price movement, it's likely that the market will react to this movement by testing the midpoint of the candle.
How Does the Long Candle Midpoint Indicator Work?
The Pine Script code provided above is designed to calculate the midpoint of a long candle based on the following parameters:
Length: The length of the candlestick is calculated using the len input parameter.
Line Length: The length of the line is calculated using the linExt input parameter.
Calculation Method: The calculation method can be set to either "Highest True Range", "Average True Range", or "Both".
Multiplier: The multiplier is used to adjust the midpoint calculation based on the average range of the candlestick.
The script then plots a horizontal line at the midpoint of the long candle, which can be used as a potential support or resistance level.
Real-Life Example:
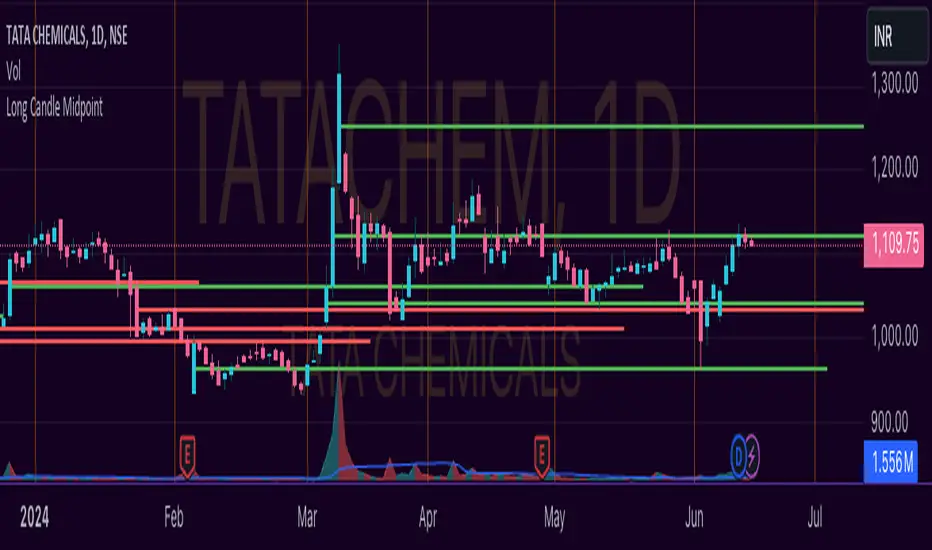
Let's take a look at TATACHEM, a stock listed on the National Stock Exchange of India (NSE). As you can see in the chart below,

TATACHEM has been trading around a potential psychology line drawn from the midpoint of a large candle.
As you can see, the stock has previously failed to break above this line, but it's currently trading around it. This could be a sign that the market is preparing for a potential breakout. If the stock can break above this line, it could lead to a bullish rally.
Conclusion
The long candle midpoint indicator is a powerful tool that can help traders identify potential breakout points in the market. By analyzing the midpoint of a long candle, traders can gain insights into the market's sentiment and potential areas of support or resistance.
In the case of TATACHEM, the stock is currently trading around a potential psychology line, which could be a sign of a potential breakout. Traders can consider this point in their watch list for a potential entry. Tips for Traders
Use the long candle midpoint indicator in conjunction with other technical indicators to gain a more comprehensive understanding of the market.
Look for confirmation from other indicators before entering a trade.
Set stop-loss and take-profit levels based on the potential breakout point.
Monitor the market closely and be prepared to adjust your strategy if the market doesn't behave as expected.
By incorporating the long candle midpoint indicator into your trading strategy, you can gain an edge in the market and make more informed trading decisions.
The Pine Script code provided below is designed to identify the midpoint of a long candle, which can be a crucial level for traders to watch.
In this blog post, we'll dive deeper into the concept, explore its applications, and analyze a real-life example of TATACHEM listed on NSE, which is currently trading around a potential psychology line.
What is the Long Candle Midpoint?
The long candle midpoint is a technical indicator that calculates the midpoint of a candlestick that has a significant price movement. This midpoint is then used to draw a horizontal line, which can serve as a potential support or resistance level. The idea is that if a candlestick has a large price movement, it's likely that the market will react to this movement by testing the midpoint of the candle.
How Does the Long Candle Midpoint Indicator Work?
The Pine Script code provided above is designed to calculate the midpoint of a long candle based on the following parameters:
Length: The length of the candlestick is calculated using the len input parameter.
Line Length: The length of the line is calculated using the linExt input parameter.
Calculation Method: The calculation method can be set to either "Highest True Range", "Average True Range", or "Both".
Multiplier: The multiplier is used to adjust the midpoint calculation based on the average range of the candlestick.
The script then plots a horizontal line at the midpoint of the long candle, which can be used as a potential support or resistance level.
Real-Life Example:
Let's take a look at TATACHEM, a stock listed on the National Stock Exchange of India (NSE). As you can see in the chart below,
TATACHEM has been trading around a potential psychology line drawn from the midpoint of a large candle.
As you can see, the stock has previously failed to break above this line, but it's currently trading around it. This could be a sign that the market is preparing for a potential breakout. If the stock can break above this line, it could lead to a bullish rally.
Conclusion
The long candle midpoint indicator is a powerful tool that can help traders identify potential breakout points in the market. By analyzing the midpoint of a long candle, traders can gain insights into the market's sentiment and potential areas of support or resistance.
In the case of TATACHEM, the stock is currently trading around a potential psychology line, which could be a sign of a potential breakout. Traders can consider this point in their watch list for a potential entry. Tips for Traders
Use the long candle midpoint indicator in conjunction with other technical indicators to gain a more comprehensive understanding of the market.
Look for confirmation from other indicators before entering a trade.
Set stop-loss and take-profit levels based on the potential breakout point.
Monitor the market closely and be prepared to adjust your strategy if the market doesn't behave as expected.
By incorporating the long candle midpoint indicator into your trading strategy, you can gain an edge in the market and make more informed trading decisions.
Açık kaynak kodlu komut dosyası
Gerçek TradingView ruhuyla, bu komut dosyasının mimarı, yatırımcıların işlevselliğini inceleyip doğrulayabilmesi için onu açık kaynaklı hale getirdi. Yazarı tebrik ederiz! Ücretsiz olarak kullanabilseniz de, kodu yeniden yayınlamanın Topluluk Kurallarımıza tabi olduğunu unutmayın.
Feragatname
Bilgiler ve yayınlar, TradingView tarafından sağlanan veya onaylanan finansal, yatırım, alım satım veya diğer türden tavsiye veya öneriler anlamına gelmez ve teşkil etmez. Kullanım Koşulları bölümünde daha fazlasını okuyun.