OPEN-SOURCE SCRIPT
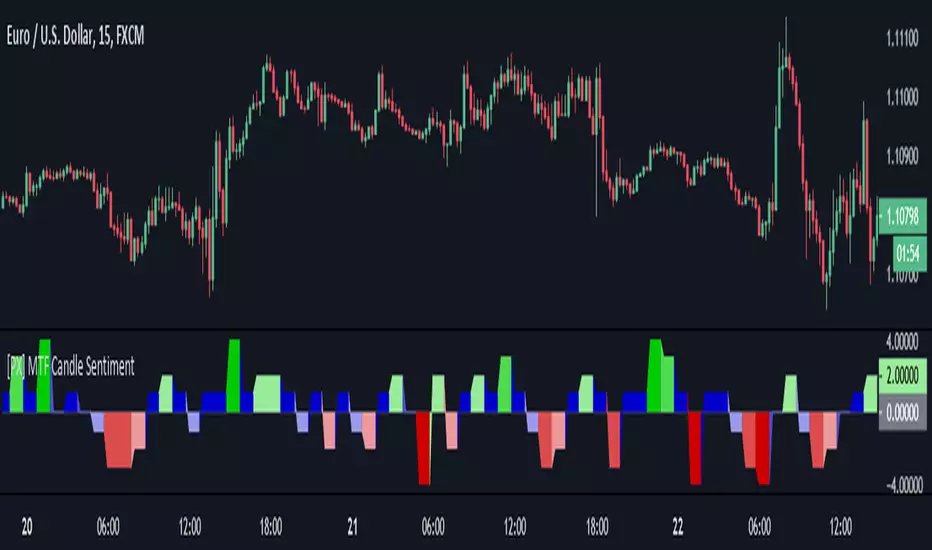
[PX] MTF Candle Sentiment

This indicator calculates the candlestick sentiment for the selected timeframe. The calculation consists of two steps:
Those two steps create 9 possible scores, which will determine the color of the graph.
If you are looking for someone to develop your own indicator or trading strategy, don't hesitate to get in touch with me here on TradingView or below.
Contact:
pascal-simon.de
info@pascal-simon.de
- Step 1: Positioning of the closing price:
Upper Third = High Close
Mid Third = Mid Close
Lower Third = Low Close - Step 2: Positioning of the closing price in comparison to its previous candle:
Close above the high of the previous candle = Bull candle
Close within the range of the previous candle = Range candle
Close below the low of the previous candle = Bear candle
Those two steps create 9 possible scores, which will determine the color of the graph.
If you are looking for someone to develop your own indicator or trading strategy, don't hesitate to get in touch with me here on TradingView or below.
Contact:
pascal-simon.de
info@pascal-simon.de
Açık kaynak kodlu komut dosyası
Gerçek TradingView ruhuyla, bu komut dosyasının mimarı, yatırımcıların işlevselliğini inceleyip doğrulayabilmesi için onu açık kaynaklı hale getirdi. Yazarı tebrik ederiz! Ücretsiz olarak kullanabilseniz de, kodu yeniden yayınlamanın Topluluk Kurallarımıza tabi olduğunu unutmayın.
🙋♂️Listed as "Trusted Pine Programmer for Hire"
💰Save $30 on your Tradingview subscription: bit.ly/3OtLyNz
🔓Indicator access: dize-trading.de/
🔒Trial access: discord.gg/DqwKjBZ8Qe
💰Save $30 on your Tradingview subscription: bit.ly/3OtLyNz
🔓Indicator access: dize-trading.de/
🔒Trial access: discord.gg/DqwKjBZ8Qe
Feragatname
Bilgiler ve yayınlar, TradingView tarafından sağlanan veya onaylanan finansal, yatırım, alım satım veya diğer türden tavsiye veya öneriler anlamına gelmez ve teşkil etmez. Kullanım Koşulları bölümünde daha fazlasını okuyun.