PROTECTED SOURCE SCRIPT
RSI Ribbon [imsachinmeher]
Overview
The RSI Ribbon Strategy is an advanced momentum-based trading system that enhances the traditional RSI indicator by using multiple RSI periods simultaneously. This creates a visual "ribbon" effect that helps traders identify trend strength, momentum shifts, and high-probability entry/exit points.
Core Concept
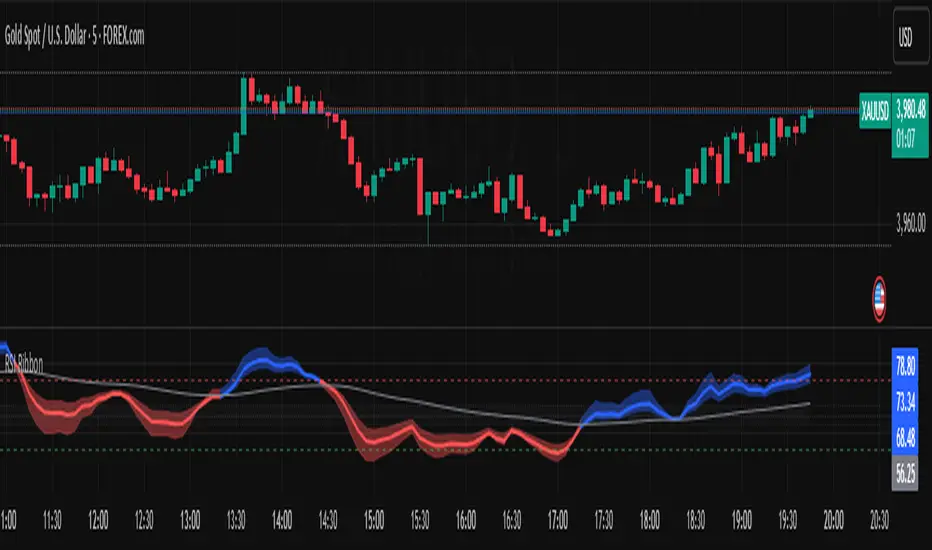
Unlike traditional RSI that uses a single line, this strategy plots three different RSI periods (default: 9, 14, 20) which are smoothed and displayed as a colored ribbon. The width of the ribbon represents momentum strength - wider ribbons indicate stronger momentum, while narrower ribbons suggest weakening momentum or consolidation.
Key Features:
1, Multiple RSI Periods - Uses 3 RSI periods (9, 14, 20) to create the ribbon effect
2. Dual Smoothing - Smooths both the source data and RSI values to reduce noise
3. Visual Ribbon - The space between RSI lines creates a colored ribbon that shows momentum strength through width
4. Dynamic Coloring - Blue for bullish trends, red for bearish trends based on RSI position relative to its EMA
5. Mid Zone - Shows the 45-55 zone as a neutral reference area
6. Customizable - All periods, smoothing methods, colors, and display options can be adjusted
===================================================
Key Components
1. Multiple RSI Calculations
Fast RSI (Period 9): Captures quick momentum changes
Medium RSI (Period 14): Standard momentum reference
Slow RSI (Period 20): Identifies longer-term momentum trends
2. Dual Smoothing System
Source Data Smoothing: Reduces market noise before RSI calculation
RSI Value Smoothing: Further refines the RSI output
Choose between EMA (faster, more responsive) or SMA (slower, smoother)
3. Ribbon Width Analysis
Width = Distance between fastest and slowest RSI
Wide ribbon = Strong, confident momentum
Narrow ribbon = Weak or transitioning momentum
Can filter trades to only execute when ribbon exceeds minimum width
4. Trend Confirmation
RSI EMA (default 50 periods) acts as trend filter
RSI above EMA = Bullish trend (blue ribbon)
RSI below EMA = Bearish trend (red ribbon)
RSI near EMA = Neutral/transitional (gray ribbon)
===================================================
Three Strategy Types
1. Trend Following Mode
Entry: Trades RSI crossovers with the EMA line
Long Signal: RSI crosses above EMA with sufficient ribbon width
Short Signal: RSI crosses below EMA with sufficient ribbon width
Best For: Trending markets, swing trading
Characteristics: Fewer trades, captures larger moves
2. Mean Reversion Mode
Entry: Trades oversold/overbought bounces
Long Signal: RSI drops below 30 and starts turning up
Short Signal: RSI rises above 70 and starts turning down
Exit: When RSI returns to midline (50)
Best For: Range-bound markets, counter-trend trading
Characteristics: More frequent trades, smaller moves
3. Breakout Mode
Entry: Trades breakouts from the neutral zone
Long Signal: RSI breaks above 55 with bullish momentum
Short Signal: RSI breaks below 45 with bearish momentum
Exit: When momentum weakens (narrow ribbon) or RSI reverses
Best For: Volatile markets, momentum trading
Characteristics: Catches explosive moves early
===================================================
Best Practices
Use higher timeframes (4H, Daily) for more reliable signals
Combine with support/resistance levels for confirmation
Adjust smoothing based on asset volatility
Monitor ribbon width - avoid trading when too narrow
Backtest on your specific market before live trading
Consider market context (trending vs ranging)
Use appropriate position sizing relative to stop loss
The RSI Ribbon Strategy is an advanced momentum-based trading system that enhances the traditional RSI indicator by using multiple RSI periods simultaneously. This creates a visual "ribbon" effect that helps traders identify trend strength, momentum shifts, and high-probability entry/exit points.
Core Concept
Unlike traditional RSI that uses a single line, this strategy plots three different RSI periods (default: 9, 14, 20) which are smoothed and displayed as a colored ribbon. The width of the ribbon represents momentum strength - wider ribbons indicate stronger momentum, while narrower ribbons suggest weakening momentum or consolidation.
Key Features:
1, Multiple RSI Periods - Uses 3 RSI periods (9, 14, 20) to create the ribbon effect
2. Dual Smoothing - Smooths both the source data and RSI values to reduce noise
3. Visual Ribbon - The space between RSI lines creates a colored ribbon that shows momentum strength through width
4. Dynamic Coloring - Blue for bullish trends, red for bearish trends based on RSI position relative to its EMA
5. Mid Zone - Shows the 45-55 zone as a neutral reference area
6. Customizable - All periods, smoothing methods, colors, and display options can be adjusted
===================================================
Key Components
1. Multiple RSI Calculations
Fast RSI (Period 9): Captures quick momentum changes
Medium RSI (Period 14): Standard momentum reference
Slow RSI (Period 20): Identifies longer-term momentum trends
2. Dual Smoothing System
Source Data Smoothing: Reduces market noise before RSI calculation
RSI Value Smoothing: Further refines the RSI output
Choose between EMA (faster, more responsive) or SMA (slower, smoother)
3. Ribbon Width Analysis
Width = Distance between fastest and slowest RSI
Wide ribbon = Strong, confident momentum
Narrow ribbon = Weak or transitioning momentum
Can filter trades to only execute when ribbon exceeds minimum width
4. Trend Confirmation
RSI EMA (default 50 periods) acts as trend filter
RSI above EMA = Bullish trend (blue ribbon)
RSI below EMA = Bearish trend (red ribbon)
RSI near EMA = Neutral/transitional (gray ribbon)
===================================================
Three Strategy Types
1. Trend Following Mode
Entry: Trades RSI crossovers with the EMA line
Long Signal: RSI crosses above EMA with sufficient ribbon width
Short Signal: RSI crosses below EMA with sufficient ribbon width
Best For: Trending markets, swing trading
Characteristics: Fewer trades, captures larger moves
2. Mean Reversion Mode
Entry: Trades oversold/overbought bounces
Long Signal: RSI drops below 30 and starts turning up
Short Signal: RSI rises above 70 and starts turning down
Exit: When RSI returns to midline (50)
Best For: Range-bound markets, counter-trend trading
Characteristics: More frequent trades, smaller moves
3. Breakout Mode
Entry: Trades breakouts from the neutral zone
Long Signal: RSI breaks above 55 with bullish momentum
Short Signal: RSI breaks below 45 with bearish momentum
Exit: When momentum weakens (narrow ribbon) or RSI reverses
Best For: Volatile markets, momentum trading
Characteristics: Catches explosive moves early
===================================================
Best Practices
Use higher timeframes (4H, Daily) for more reliable signals
Combine with support/resistance levels for confirmation
Adjust smoothing based on asset volatility
Monitor ribbon width - avoid trading when too narrow
Backtest on your specific market before live trading
Consider market context (trending vs ranging)
Use appropriate position sizing relative to stop loss
Korumalı komut dosyası
Bu komut dosyası kapalı kaynak olarak yayınlanmaktadır. Ancak, özgürce ve herhangi bir sınırlama olmaksızın kullanabilirsiniz – daha fazla bilgi burada.
Get access to our exclusive tools: profitgrow.in
All content provided by ProfitGrow is for informational & educational purposes only. Past performance does not guarantee future results.
All content provided by ProfitGrow is for informational & educational purposes only. Past performance does not guarantee future results.
Feragatname
Bilgiler ve yayınlar, TradingView tarafından sağlanan veya onaylanan finansal, yatırım, işlem veya diğer türden tavsiye veya tavsiyeler anlamına gelmez ve teşkil etmez. Kullanım Şartları'nda daha fazlasını okuyun.