OPEN-SOURCE SCRIPT
AlgoPilotX – FibFusion Confluence PRO

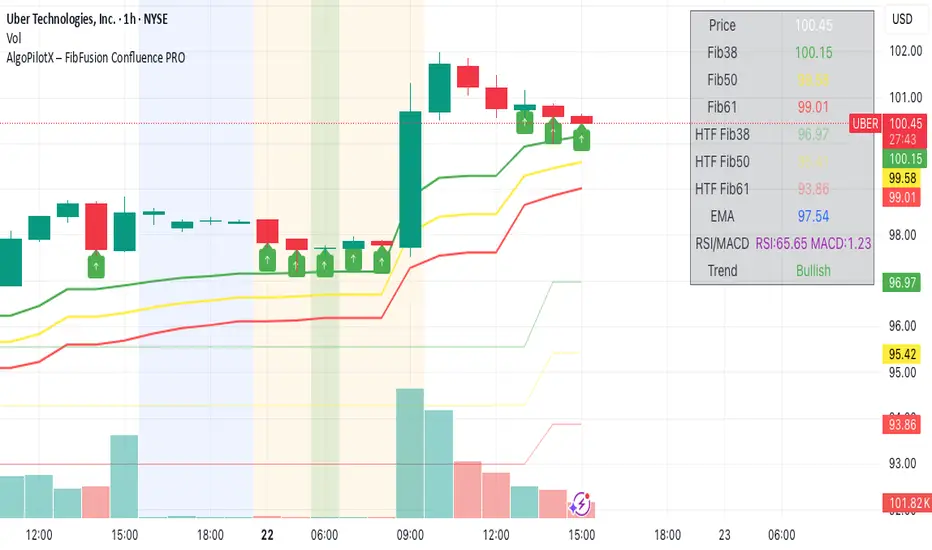
Take your Fibonacci trading to the next level with AlgoPilotX – FibFusion Confluence PRO. This advanced TradingView indicator combines multi-timeframe Fibonacci retracements with key technical indicators to identify high-probability trading zones.
Features:
Detects TF and Higher Timeframe (HTF) Fibonacci levels automatically.
Highlights Fib confluence zones with background colors for bullish and bearish probabilities.
Displays arrows on exact Fib touches for quick visual cues.
Integrated EMA, RSI, and MACD analysis to improve trend accuracy.
Dynamic Trend Indicator: Bullish, Bearish, or Neutral.
Interactive dashboard showing all key levels and indicators in real-time with intuitive color coding.
Supports multiple chart timeframes and recalculates trend and confluence dynamically.
Alerts for high probability bullish or bearish zones, ready to integrate into your trading strategy.
How to Use:
Observe price approaching Fibonacci levels displayed as lines and arrows.
Confluence Zones:
Green background: High-probability bullish zone.
Red background: High-probability bearish zone.
Neutral: No strong confluence.
Confirm signals using EMA, RSI, and MACD.
Use the dashboard to track all key levels, multi-timeframe Fibs, and current Trend.
Enter trades near high-probability confluence zones and manage risk accordingly.
Perfect for swing traders, day traders, and anyone using Fibonacci retracements to find precise entry and exit points.
Açık kaynak kodlu komut dosyası
Gerçek TradingView ruhuna uygun olarak, bu komut dosyasının oluşturucusu bunu açık kaynaklı hale getirmiştir, böylece yatırımcılar betiğin işlevselliğini inceleyip doğrulayabilir. Yazara saygı! Ücretsiz olarak kullanabilirsiniz, ancak kodu yeniden yayınlamanın Site Kurallarımıza tabi olduğunu unutmayın.
Feragatname
Bilgiler ve yayınlar, TradingView tarafından sağlanan veya onaylanan finansal, yatırım, işlem veya diğer türden tavsiye veya tavsiyeler anlamına gelmez ve teşkil etmez. Kullanım Şartları'nda daha fazlasını okuyun.