PROTECTED SOURCE SCRIPT
Güncellendi Standard Deviation [Vogaz]
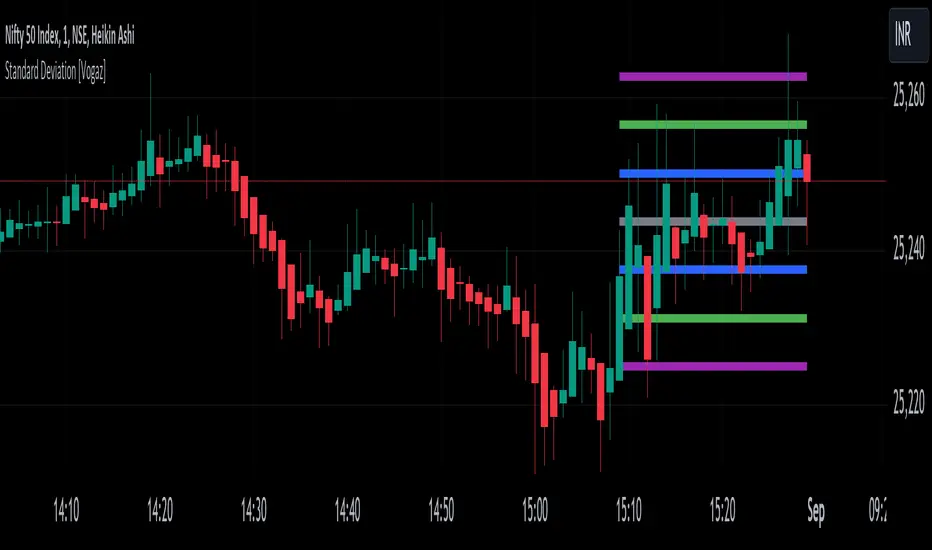
This Pine Script indicator provides a visualization of standard deviation bands plotted as fixed horizontal lines on the TradingView chart. The bands are based on the last candle's closing price and are designed to help traders identify potential volatility levels and deviations from the average price.
Features:
Standard Deviation Calculation: The indicator calculates standard deviation based on a user-defined length and source price. It then creates bands around the last candle's close price, showing potential ranges of price volatility.
Customizable Multipliers: You can adjust the multipliers for standard deviation levels (e.g., 1x, 2x, 3x) to set how far the bands are from the closing price.
Adjustable Line Thickness and Length: Customize the thickness and length of the horizontal lines. The lines extend backwards from the current bar to show the range over a user-defined number of bars.
Color Settings: Each band and the closing price line have configurable colors for better visual differentiation. You can set colors for:
Standard Deviation 1 Band (up and down)
Standard Deviation 2 Band (up and down)
Standard Deviation 3 Band (up and down)
Last Close Price Line
Inputs:
Length: Number of periods for calculating standard deviation.
Source: Price type used for standard deviation calculation (e.g., closing price).
StdDev Multipliers: Multipliers for different standard deviation bands.
Line Thickness: Thickness of the horizontal lines.
Line Length: Length of the lines extending from the current bar.
Line Colors: Colors for the bands and the last close price line.
Use Case:
This indicator is useful for traders who want to visualize price volatility and deviations around the last closing price. By analyzing these bands, traders can make informed decisions about potential price movements and market conditions.
How to Use:
Add the Indicator to Your Chart: Apply the indicator to your TradingView chart.
Adjust Settings: Modify the standard deviation multipliers, line thickness, and length according to your preferences.
Analyze the Bands: Use the bands to assess price volatility and identify potential trading signals.
Sürüm Notları
The "Standard Deviation [Vogaz]" indicator is a custom technical analysis tool designed to help traders visualize the volatility and price action of an asset in relation to its average price over a specified period. This indicator plots multiple standard deviation bands above and below a simple moving average (SMA) of the selected source price, typically the closing price. By understanding the proximity of price to these bands, traders can gain insights into potential overbought or oversold conditions and gauge market volatility.Key Features:
Mean Calculation: The central line of the indicator is based on the Simple Moving Average (SMA) of the source price over a user-defined length. This moving average serves as the reference point for calculating the upper and lower standard deviation bands.
Standard Deviation Bands: The indicator plots three sets of upper and lower bands at 1, 2, and 3 standard deviations from the mean. These bands help visualize the expected range of price movement based on historical volatility.
Customizable Multipliers: Users can adjust the multipliers for each standard deviation band to fine-tune the sensitivity of the bands according to their trading style.
Color-Coded Lines: Each band is color-coded for easy visualization. The colors of the lines can be customized to reflect bullish or bearish conditions as the price interacts with different standard deviation levels.
Adjustable Line Thickness and Length: The indicator allows users to customize the thickness and length of the lines to suit their visual preferences and charting needs.
How to Use:
Mean Line (SMA): The mean line represents the average price over the specified period. It is the foundation for the upper and lower standard deviation bands. Traders often use this line to identify the overall trend direction.
Standard Deviation Bands: The bands represent areas where price action is statistically expected to occur based on past volatility. When the price is near the upper bands, the asset may be considered overbought, and when near the lower bands, it may be considered oversold. However, these levels should be used in conjunction with other indicators or market analysis.
Volatility Assessment: Wider bands indicate higher volatility, while narrower bands suggest lower volatility. Traders can use this information to adjust their risk management strategies accordingly.
Mean Reversion Strategy: Some traders may use the indicator for mean reversion strategies, anticipating that the price will revert to the mean after reaching the outer bands.
Settings:
Length: Determines the period over which the SMA and standard deviation are calculated.
Source: The price data used for calculations (e.g., close, open, high, low).
Standard Deviation Multipliers: Adjust the sensitivity of the 1st, 2nd, and 3rd standard deviation bands.
Colors and Thickness: Customize the appearance of the bands for better visual clarity.
Conclusion:
The "Standard Deviation [Vogaz]" indicator is a versatile tool that combines the concept of mean reversion with volatility analysis. It helps traders identify potential price extremes and market conditions that may signal entry or exit points in a trade. Whether you're a trend follower or a mean reversion trader, this indicator offers valuable insights into market dynamics.
Korumalı komut dosyası
Bu komut dosyası kapalı kaynak olarak yayınlanmaktadır. Ancak, ücretsiz ve herhangi bir sınırlama olmaksızın kullanabilirsiniz – daha fazla bilgiyi buradan edinebilirsiniz.
Feragatname
Bilgiler ve yayınlar, TradingView tarafından sağlanan veya onaylanan finansal, yatırım, alım satım veya diğer türden tavsiye veya öneriler anlamına gelmez ve teşkil etmez. Kullanım Koşulları bölümünde daha fazlasını okuyun.