OPEN-SOURCE SCRIPT
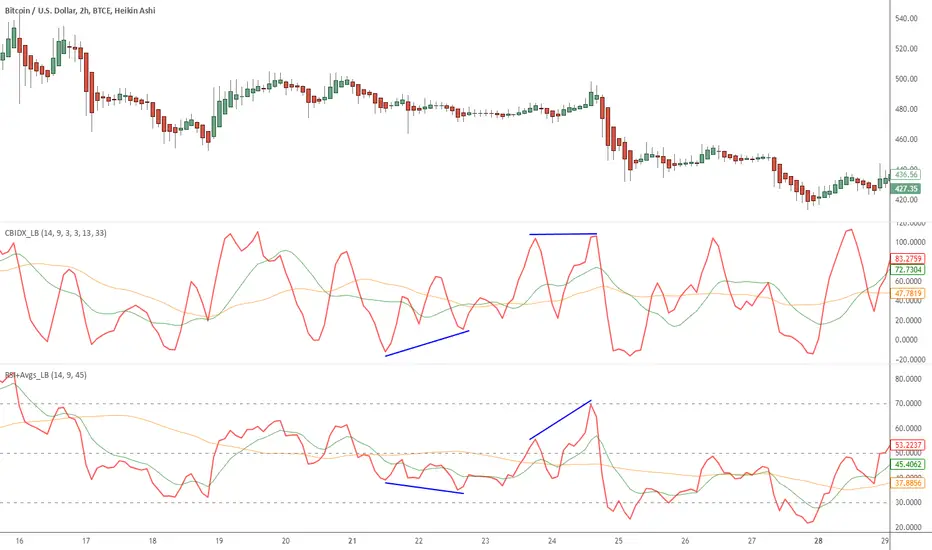
Indicators: Constance Brown Composite Index & RSI+Avgs
I am a big fan of Constance Brown. Her book "Technical Analysis for Trading Professionals" is an absolute classic (get the 2nd edition).
I have included here 2 of the indicators she uses in all her charts.
Composite Index
----------------------------------------
This is a formula Ms Brown developed (Cardwell may not agree!) to identify divergence failures with in the RSI. This also highlights the horizontal support levels with in the indicator area.
This index removes the normalization range restrictions in RSI. This means it is not bound with in 0-100 range. Also, this has embedded momentum calculation in it.
The fine nuances of this indicator are not documented well enough, if you find some good documentation, do let me know. Always use this with RSI (like the next one).
RSI+Avgs
----------------------------------------
This is plain 14 period RSI with a 9-period EMA and 45-period SMA overlaid.
Açık kaynak kodlu komut dosyası
Gerçek TradingView ruhuna uygun olarak, bu komut dosyasının oluşturucusu bunu açık kaynaklı hale getirmiştir, böylece yatırımcılar betiğin işlevselliğini inceleyip doğrulayabilir. Yazara saygı! Ücretsiz olarak kullanabilirsiniz, ancak kodu yeniden yayınlamanın Site Kurallarımıza tabi olduğunu unutmayın.
List of my free indicators: bit.ly/1LQaPK8
List of my indicators at Appstore: blog.tradingview.com/?p=970
List of my indicators at Appstore: blog.tradingview.com/?p=970
İlgili yayınlar
Feragatname
Bilgiler ve yayınlar, TradingView tarafından sağlanan veya onaylanan finansal, yatırım, işlem veya diğer türden tavsiye veya tavsiyeler anlamına gelmez ve teşkil etmez. Kullanım Şartları'nda daha fazlasını okuyun.