OPEN-SOURCE SCRIPT
52-Week & 5-Year High/Low with Dates
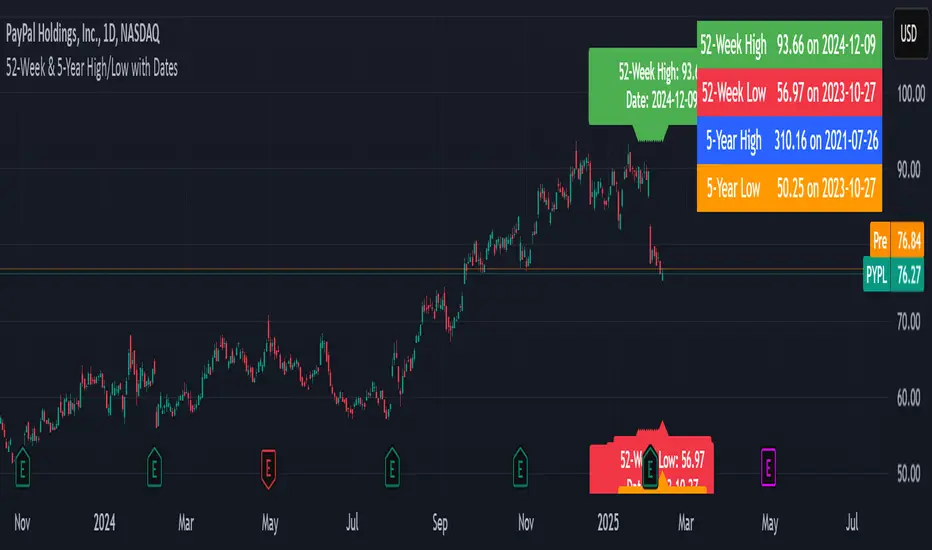
This indicator is designed to help traders quickly identify key price levels and their historical context by displaying the 52-week high/low and 5-year high/low prices along with their respective dates. It provides a clear visual representation of these levels directly on the chart and in a dashboard table for easy reference.
Key Features
52-Week High/Low:
Displays the highest and lowest prices over the last 252 trading days (approximately 52 weeks).
Includes the exact date when these levels were reached.
5-Year High/Low:
Displays the highest and lowest prices over the last 1260 trading days (approximately 5 years).
Includes the exact date when these levels were reached.
Visual Labels:
High and low levels are marked on the chart with labels that include the price and date.
Dashboard Table:
A table in the top-right corner of the chart summarizes the 52-week and 5-year high/low prices and their dates for quick reference.
Customizable Date Format:
Dates are displayed in the YYYY-MM-DD format for clarity and consistency.
Açık kaynak kodlu komut dosyası
Gerçek TradingView ruhuyla, bu komut dosyasının mimarı, yatırımcıların işlevselliğini inceleyip doğrulayabilmesi için onu açık kaynaklı hale getirdi. Yazarı tebrik ederiz! Ücretsiz olarak kullanabilseniz de, kodu yeniden yayınlamanın Topluluk Kurallarımıza tabi olduğunu unutmayın.
Feragatname
Bilgiler ve yayınlar, TradingView tarafından sağlanan veya onaylanan finansal, yatırım, alım satım veya diğer türden tavsiye veya öneriler anlamına gelmez ve teşkil etmez. Kullanım Koşulları bölümünde daha fazlasını okuyun.