This project is about:
- VPSV
- array.new_line()
- array.new_box()
VPSV (pine) is one of the rare features that draws lines/figures BETWEEN bars

It doesn't run on Pine script, which makes it possible to do such things.
I wanted to have something similar while a restriction of Pine script is the impossibility to draw between bars, the only way I could think of is by using line width

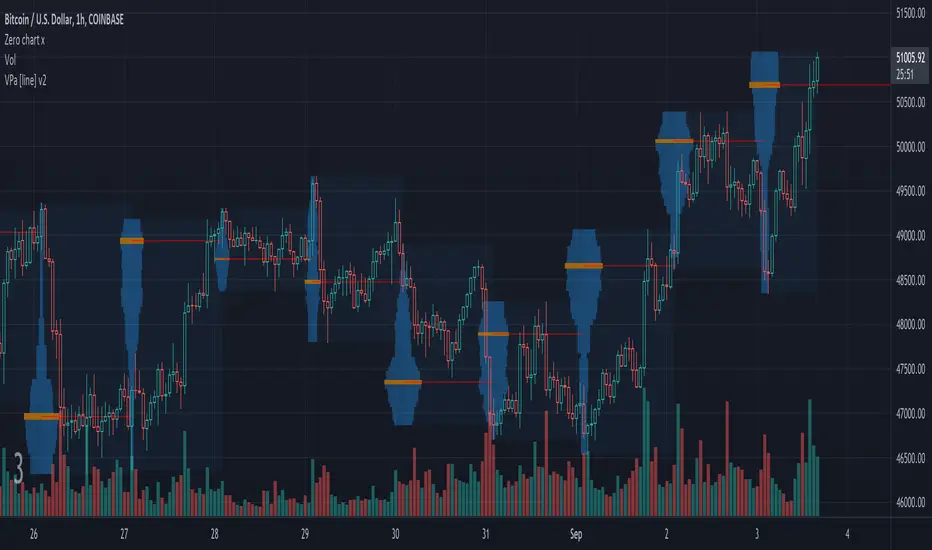
In this script the higher timeframe is started with several lines (left) and a box, this box goes further until the higher timeframe ends.
During the creation of the box, each candle (lower timeframe) in this box (higher timeframe - period) is checked for position and volume, the volume is added to the left line, so when you see a thicker line, this means at that level there is more volume traded.
One of the big differences with other volume profiles is that many look back to a previous period, here when a period starts, the lines collect data - volume until the period ends, it is especially very visible in very low TF's (seconds)
This is my first script with array.new_line() - array.new_box(), which is a very nice Pine feature!
I hope this script can be helpful to see the possibilities
Settings:
'Parts' -> amount of lines (left of box)
5 Parts:

15 Parts:

25 Parts:

50 Parts:

'Max Width' -> Sets the max width of the lines
'Automatic Settings' -> Sets the higher time frame automatically, see the tooltip ⓘ for more info
The yellow line is the max volume line of that period, last period has a red line (POC), also referring the max.
Cheers!
- VPSV
- array.new_line()
- array.new_box()
VPSV (pine) is one of the rare features that draws lines/figures BETWEEN bars
It doesn't run on Pine script, which makes it possible to do such things.
I wanted to have something similar while a restriction of Pine script is the impossibility to draw between bars, the only way I could think of is by using line width
In this script the higher timeframe is started with several lines (left) and a box, this box goes further until the higher timeframe ends.
During the creation of the box, each candle (lower timeframe) in this box (higher timeframe - period) is checked for position and volume, the volume is added to the left line, so when you see a thicker line, this means at that level there is more volume traded.
One of the big differences with other volume profiles is that many look back to a previous period, here when a period starts, the lines collect data - volume until the period ends, it is especially very visible in very low TF's (seconds)
This is my first script with array.new_line() - array.new_box(), which is a very nice Pine feature!
I hope this script can be helpful to see the possibilities
Settings:
'Parts' -> amount of lines (left of box)
5 Parts:
15 Parts:
25 Parts:
50 Parts:
'Max Width' -> Sets the max width of the lines
'Automatic Settings' -> Sets the higher time frame automatically, see the tooltip ⓘ for more info
The yellow line is the max volume line of that period, last period has a red line (POC), also referring the max.
Cheers!
Sürüm Notları
bugfixSürüm Notları
Improvement of array clean-up (Thanks HeWhoMustNotBeNamed !)Sürüm Notları
Added more POC linesSürüm Notları
• Added 'Visible Barcolor' for users who use "Bars" as "Bar's Style", default off• Converted to v5
Sürüm Notları
• Added 'Visible Barcolor' for users who use "Bars" as "Bar's Style", default off• Converted to v5
Açık kaynak kodlu komut dosyası
Gerçek TradingView ruhuna uygun olarak, bu komut dosyasının oluşturucusu bunu açık kaynaklı hale getirmiştir, böylece yatırımcılar betiğin işlevselliğini inceleyip doğrulayabilir. Yazara saygı! Ücretsiz olarak kullanabilirsiniz, ancak kodu yeniden yayınlamanın Site Kurallarımıza tabi olduğunu unutmayın.
Who are PineCoders?
tradingview.com/chart/SSP/yW5eOqtm-Who-are-PineCoders/
TG Pine Script® Q&A: t.me/PineCodersQA
- We cannot control our emotions,
but we can control our keyboard -
tradingview.com/chart/SSP/yW5eOqtm-Who-are-PineCoders/
TG Pine Script® Q&A: t.me/PineCodersQA
- We cannot control our emotions,
but we can control our keyboard -
Feragatname
Bilgiler ve yayınlar, TradingView tarafından sağlanan veya onaylanan finansal, yatırım, işlem veya diğer türden tavsiye veya tavsiyeler anlamına gelmez ve teşkil etmez. Kullanım Şartları'nda daha fazlasını okuyun.