PROTECTED SOURCE SCRIPT
Güncellendi Volume Delta Histogram and Bands
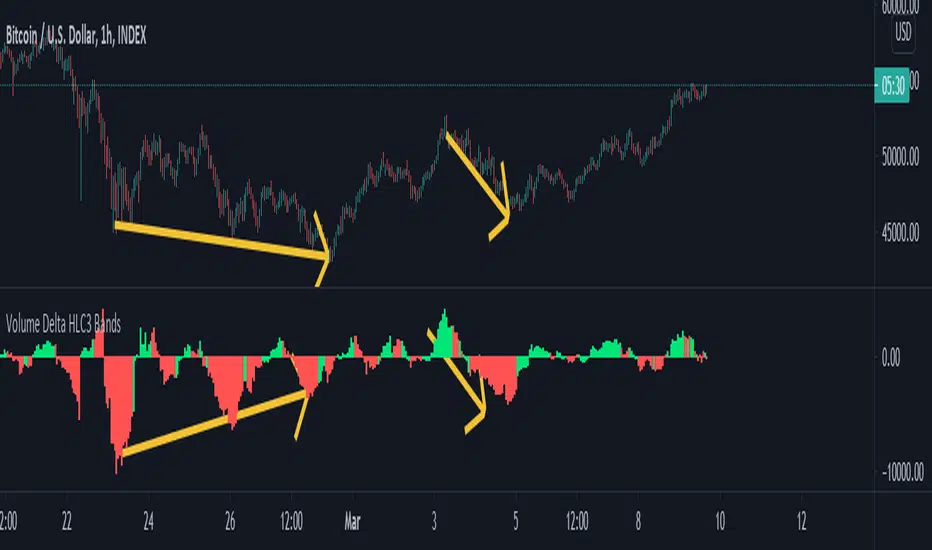
This study takes the lower timeframe volume from the specified "Volume Data Time Period", and calculates the sum of volume over the user specified "Volume Signal period", doing its best to take an approximation of delta.
This is displayed via a histogram, and can be used to trade divergences, see trends strengthen and weaken as illustrated on the chart below.

You can also display reversal areas, which will show when the "Volume Signal Period" exceeds one half of the average volume plus two standard deviations over the "Volume Comparison Period."
Think of this like bollinger bands for volume trends, when the bands are tight crossing outside them can signal strength, but when they are moderate or contracting it can show an area for a likely reversal.
This is displayed via a histogram, and can be used to trade divergences, see trends strengthen and weaken as illustrated on the chart below.
You can also display reversal areas, which will show when the "Volume Signal Period" exceeds one half of the average volume plus two standard deviations over the "Volume Comparison Period."
Think of this like bollinger bands for volume trends, when the bands are tight crossing outside them can signal strength, but when they are moderate or contracting it can show an area for a likely reversal.
Sürüm Notları
Fixed calculations and removed reversals, they didnt do much anyways.Histogram shows the volume over the comparison period, color of histogram is determined by delta volume over the signal period.
Korumalı komut dosyası
Bu komut dosyası kapalı kaynak olarak yayınlanmaktadır. Ancak, ücretsiz ve herhangi bir sınırlama olmaksızın kullanabilirsiniz – daha fazla bilgiyi buradan edinebilirsiniz.
Feragatname
Bilgiler ve yayınlar, TradingView tarafından sağlanan veya onaylanan finansal, yatırım, alım satım veya diğer türden tavsiye veya öneriler anlamına gelmez ve teşkil etmez. Kullanım Koşulları bölümünde daha fazlasını okuyun.