OPEN-SOURCE SCRIPT
Bitcoin Is Dead (BID/Weekly)
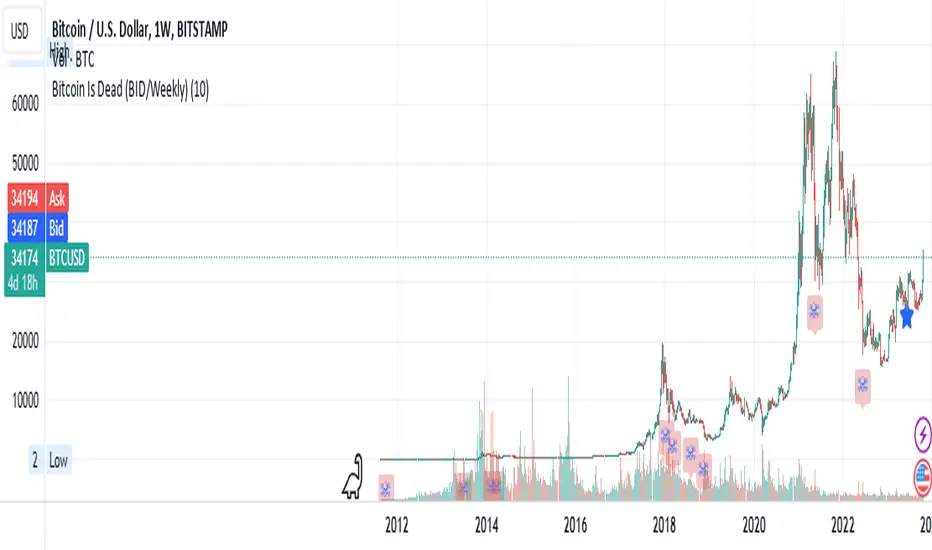
Shows two consecutive weekly Bitcoin drops of X% both indicating capitulation which may be relevant to crypto markets, risk-on/risk-off and possibly tech markets.
Suggested usage: set the drop % and apply to weekly charts. Can be used on any chart, not just Bitcoin, but calculates indicator specifically for Bitcoin pricing.
Can be used for entertainment or technical analysis.
Suggested usage: set the drop % and apply to weekly charts. Can be used on any chart, not just Bitcoin, but calculates indicator specifically for Bitcoin pricing.
Can be used for entertainment or technical analysis.
Açık kaynak kodlu komut dosyası
Gerçek TradingView ruhuyla, bu komut dosyasının mimarı, yatırımcıların işlevselliğini inceleyip doğrulayabilmesi için onu açık kaynaklı hale getirdi. Yazarı tebrik ederiz! Ücretsiz olarak kullanabilseniz de, kodu yeniden yayınlamanın Topluluk Kurallarımıza tabi olduğunu unutmayın.
Feragatname
Bilgiler ve yayınlar, TradingView tarafından sağlanan veya onaylanan finansal, yatırım, alım satım veya diğer türden tavsiye veya öneriler anlamına gelmez ve teşkil etmez. Kullanım Koşulları bölümünde daha fazlasını okuyun.