OPEN-SOURCE SCRIPT
Previous 4-Hour High/Low
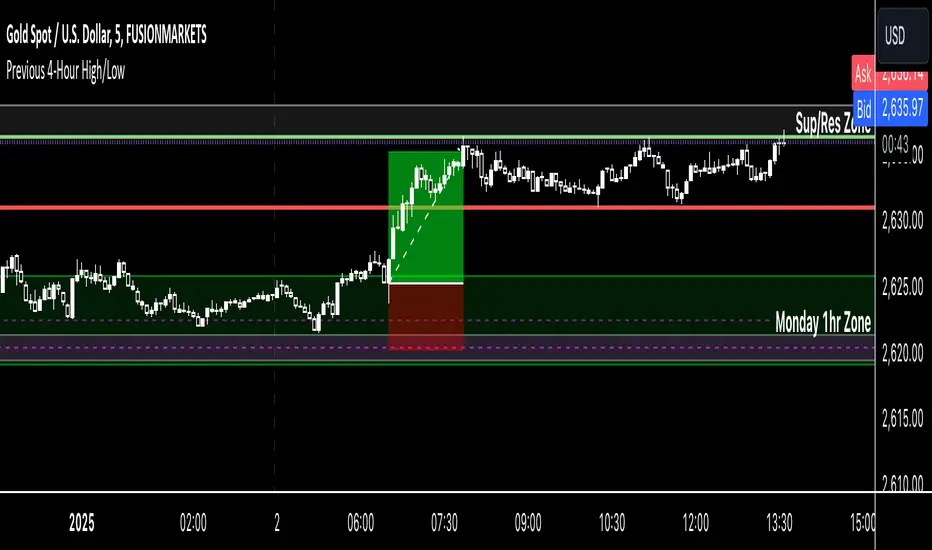
Indicator Name: Previous 4-Hour High/Low Lines
Description:
This indicator highlights the high and low levels of the previous candle from a user-defined timeframe (default: 4 hours) and extends these levels both to the left and right across the chart. It allows traders to visualize key support and resistance levels from higher timeframes while analyzing lower timeframe charts.
Key Features:
• Customizable Timeframe: Select any timeframe (e.g., 4-hour, daily) to track the high and low of the previous candle.
• Dynamic Updates: The high and low levels update automatically with each new candle.
• Extended Levels: Lines extend both left and right, providing a clear reference for past and future price action.
• Overlay on Chart: The indicator works seamlessly on any timeframe, making it ideal for multi-timeframe analysis.
Use Case:
This tool is perfect for traders who rely on higher timeframe levels for setting entry/exit points, identifying potential breakout zones, or managing risk. By visualizing these levels directly on lower timeframe charts, traders can make informed decisions without switching between charts.
Açık kaynak kodlu komut dosyası
Gerçek TradingView ruhuyla, bu komut dosyasının mimarı, yatırımcıların işlevselliğini inceleyip doğrulayabilmesi için onu açık kaynaklı hale getirdi. Yazarı tebrik ederiz! Ücretsiz olarak kullanabilseniz de, kodu yeniden yayınlamanın Topluluk Kurallarımıza tabi olduğunu unutmayın.
Feragatname
Bilgiler ve yayınlar, TradingView tarafından sağlanan veya onaylanan finansal, yatırım, alım satım veya diğer türden tavsiye veya öneriler anlamına gelmez ve teşkil etmez. Kullanım Koşulları bölümünde daha fazlasını okuyun.