OPEN-SOURCE SCRIPT
Mayer Multiple (with muti-color histogram)
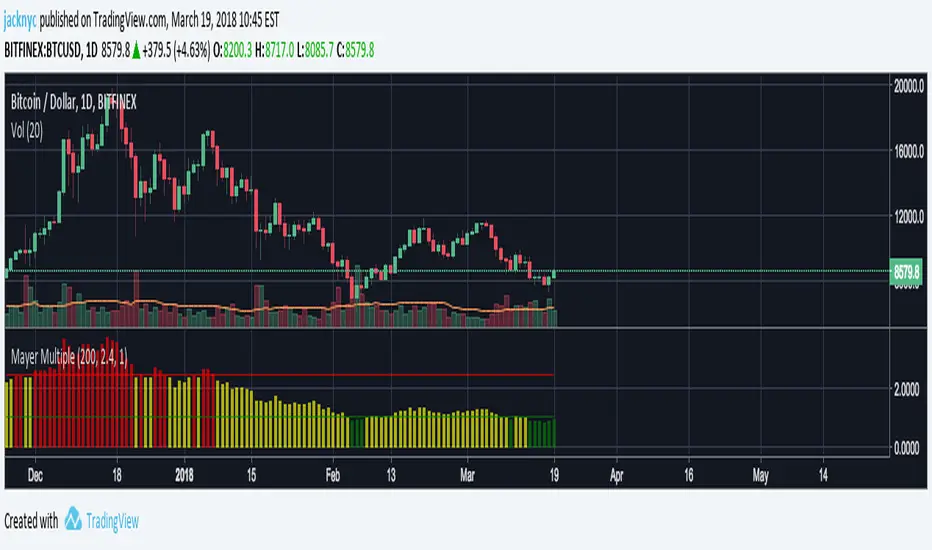
This is inspired by unbound's work on the Mayer Multiple script.
This script is designed to work with the daily chart.

I created this script so you can see the daily Mayer Multiple by just hovering over the bar in the histogram. I modified the color of the histogram bar to indicate the following:
Red = Over 2.4x Mayer Multiple, overvalued
Yellow = Between 1x to 2.4x Mayer Mutiple, fairly valued
Green = Under 1x Mayer Multiple, undervalued
This is my first script so let me know if there are any issues or suggestions on how to change it.
This script is designed to work with the daily chart.
I created this script so you can see the daily Mayer Multiple by just hovering over the bar in the histogram. I modified the color of the histogram bar to indicate the following:
Red = Over 2.4x Mayer Multiple, overvalued
Yellow = Between 1x to 2.4x Mayer Mutiple, fairly valued
Green = Under 1x Mayer Multiple, undervalued
This is my first script so let me know if there are any issues or suggestions on how to change it.
Açık kaynak kodlu komut dosyası
Gerçek TradingView ruhuyla, bu komut dosyasının mimarı, yatırımcıların işlevselliğini inceleyip doğrulayabilmesi için onu açık kaynaklı hale getirdi. Yazarı tebrik ederiz! Ücretsiz olarak kullanabilseniz de, kodu yeniden yayınlamanın Topluluk Kurallarımıza tabi olduğunu unutmayın.
Feragatname
Bilgiler ve yayınlar, TradingView tarafından sağlanan veya onaylanan finansal, yatırım, alım satım veya diğer türden tavsiye veya öneriler anlamına gelmez ve teşkil etmez. Kullanım Koşulları bölümünde daha fazlasını okuyun.