OPEN-SOURCE SCRIPT
Price Action Health Check
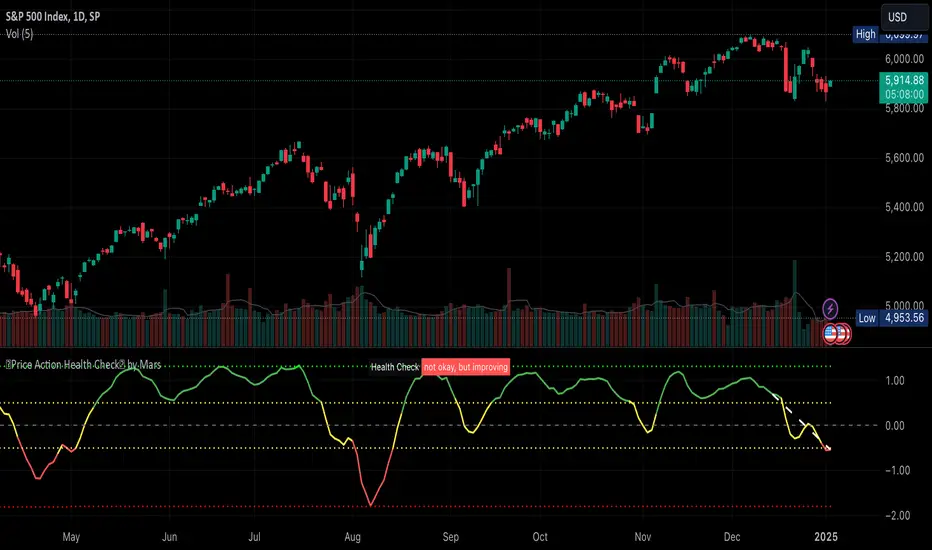
This is a price action indicator that measures market health by comparing EMAs, adapting automatically to different timeframes (Weekly/Daily more reliable) and providing context-aware health status.
Key features:
Trading applications:
I like to use it to keep SPX in check before deciding the market is going down.
Note: For optimal analysis, use primarily on Weekly and Daily timeframes where price action patterns are more significant.
Key features:
- Automatically adjusts EMA periods based on timeframe
- Measures price action health through EMA separation and historical context
- Provides visual health status with clear improvement/deterioration signals
- Projects a 13-period trend line for directional context
Trading applications:
- Identify shifts in market health before major trend changes
- Validate trend strength by comparing current readings to historical averages
- Time entries/exits based on health status transitions
- Filter trades using timeframe-specific health readings
I like to use it to keep SPX in check before deciding the market is going down.
Note: For optimal analysis, use primarily on Weekly and Daily timeframes where price action patterns are more significant.
Açık kaynak kodlu komut dosyası
Gerçek TradingView ruhuyla, bu komut dosyasının mimarı, yatırımcıların işlevselliğini inceleyip doğrulayabilmesi için onu açık kaynaklı hale getirdi. Yazarı tebrik ederiz! Ücretsiz olarak kullanabilseniz de, kodu yeniden yayınlamanın Topluluk Kurallarımıza tabi olduğunu unutmayın.
Cyclist, Trader, Technologist. Get access to data for my options indicators on smartcanvas.com for free via bots
Feragatname
Bilgiler ve yayınlar, TradingView tarafından sağlanan veya onaylanan finansal, yatırım, alım satım veya diğer türden tavsiye veya öneriler anlamına gelmez ve teşkil etmez. Kullanım Koşulları bölümünde daha fazlasını okuyun.