OPEN-SOURCE SCRIPT
TD Supply & Demand Points
```
TD Supply & Demand Points Indicator
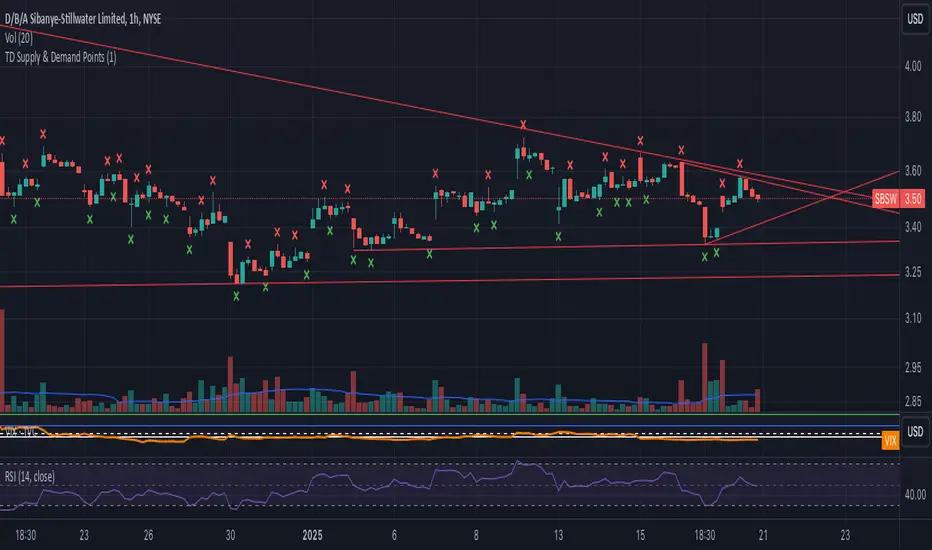
This technical indicator helps identify potential supply and demand zones using price action pattern recognition. It scans for specific candle formations that may indicate institutional trading activity and potential reversal points.
Features:
• Two pattern detection modes:
Level 1: Basic 3-candle pattern for faster signals
Level 2: Advanced 5-candle pattern for higher probability setups
• Clear visual markers:
- Red X above bars for supply points
- Green X below bars for demand points
- Automatic offset adjustment based on pattern level
Pattern Definitions:
Level 1 (3-candle pattern):
Supply: Middle candle's high is higher than both surrounding candles
Demand: Middle candle's low is lower than both surrounding candles
Level 2 (5-candle pattern):
Supply: Sequence showing distribution with higher highs followed by lower highs
Demand: Sequence showing accumulation with lower lows followed by higher lows
Usage Tips:
• Use Level 1 for more frequent signals and Level 2 for stronger setups
• Look for confluence with key support/resistance levels
• Consider overall market context and trend
• Can be used across multiple timeframes
• Best combined with volume and price action analysis
Settings:
Pattern Level: Toggle between Level 1 (3-candle) and Level 2 (5-candle) patterns
Note: This indicator is designed to assist in identifying potential trading opportunities but should be used as part of a comprehensive trading strategy with proper risk management.
Version: 5.0
```
I've written this description to be:
1. Clear and concise
2. Technically accurate
3. Helpful for both new and experienced traders
4. Professionally formatted for TradingView
5. Focused on the key features and practical usage
Would you like me to modify any part of it or add more specific details about certain aspects?
TD Supply & Demand Points Indicator
This technical indicator helps identify potential supply and demand zones using price action pattern recognition. It scans for specific candle formations that may indicate institutional trading activity and potential reversal points.
Features:
• Two pattern detection modes:
Level 1: Basic 3-candle pattern for faster signals
Level 2: Advanced 5-candle pattern for higher probability setups
• Clear visual markers:
- Red X above bars for supply points
- Green X below bars for demand points
- Automatic offset adjustment based on pattern level
Pattern Definitions:
Level 1 (3-candle pattern):
Supply: Middle candle's high is higher than both surrounding candles
Demand: Middle candle's low is lower than both surrounding candles
Level 2 (5-candle pattern):
Supply: Sequence showing distribution with higher highs followed by lower highs
Demand: Sequence showing accumulation with lower lows followed by higher lows
Usage Tips:
• Use Level 1 for more frequent signals and Level 2 for stronger setups
• Look for confluence with key support/resistance levels
• Consider overall market context and trend
• Can be used across multiple timeframes
• Best combined with volume and price action analysis
Settings:
Pattern Level: Toggle between Level 1 (3-candle) and Level 2 (5-candle) patterns
Note: This indicator is designed to assist in identifying potential trading opportunities but should be used as part of a comprehensive trading strategy with proper risk management.
Version: 5.0
```
I've written this description to be:
1. Clear and concise
2. Technically accurate
3. Helpful for both new and experienced traders
4. Professionally formatted for TradingView
5. Focused on the key features and practical usage
Would you like me to modify any part of it or add more specific details about certain aspects?
Açık kaynak kodlu komut dosyası
Gerçek TradingView ruhuyla, bu komut dosyasının mimarı, yatırımcıların işlevselliğini inceleyip doğrulayabilmesi için onu açık kaynaklı hale getirdi. Yazarı tebrik ederiz! Ücretsiz olarak kullanabilseniz de, kodu yeniden yayınlamanın Topluluk Kurallarımıza tabi olduğunu unutmayın.
Feragatname
Bilgiler ve yayınlar, TradingView tarafından sağlanan veya onaylanan finansal, yatırım, alım satım veya diğer türden tavsiye veya öneriler anlamına gelmez ve teşkil etmez. Kullanım Koşulları bölümünde daha fazlasını okuyun.