INVITE-ONLY SCRIPT
Jay Stock Trends
- This indicator aids in identifying potential trend starts, continuations and endings by combining moving averages with trend lines.
- Its unique trend curves also assist in pinpointing key support and resistance levels for the price.
- Multi-timeframe plots provide valuable insights by displaying short-term and long-term trends on the same chart, making it suitable for both intraday and swing trading analysis.
How to read multi-timeframe charts?
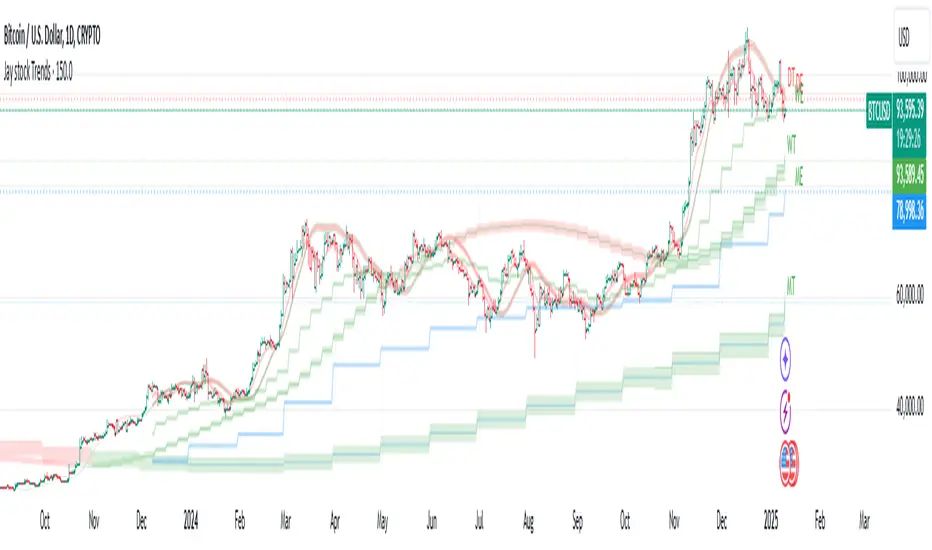
The first timeframe, such as daily, is represented by a red EMA8 line (labeled DE) and a corresponding thin trend line (labeled DT). The second timeframe, such as weekly, uses a green EMA8 line (labeled WE) and a medium trend line (labeled WT). The third timeframe, such as monthly, is depicted with a blue EMA8 line (labeled ME) and a thick trend line (labeled MT).
As the timeframe increases, the true range increases and hence trend curve thickness increases.
Trends for lower timeframes are not plotted on daily or higher charts.
How EMA and Trend Line Work Together?
In the BTC daily chart screenshot below, trend initiation is highlighted with a green circle, trend continuation is marked by arrows, and trend completion is indicated with a red circle. A total of six trends are identified on the chart.
When the EMA crosses above the trend line, it signals the start of a trend, while a cross below the trend line marks its end. The period between the trend start and end represents trend continuation.
How Trend Lines Serve as Support or Resistance?
In the BTC daily chart screenshot below, the weekly green trend line serves as support when the price declines toward it, while the red trend line acts as resistance when the price rises from below.
Green circles on the chart highlight instances where the weekly trend provided support, while red circles indicate points where the weekly trend acted as resistance.
How Multi-Timeframe Trends Assist in Stock Analysis?
In the BTC daily chart screenshot below, the monthly trend is rising, and the weekly trend is also moving upward, indicating a favorable outlook for both long-term (monthly) and medium-term (weekly) trends. However, the daily chart suggests a more cautious approach, signaling a period to sit out
Inputs and customization:
This combination of ema and trend plots will be plotted for 4 different time frames all at once. Which 4 timeframes can be chosen in the settings.
How Trend Line and EMA Calculated?
The Trend line is calculated using an arithmetic equation based on the last 8 data points, which are themselves a combination of weighted moving averages of varying lengths. A 14-period true range of the price is calculated and plotted as a buffer zone around the trend lines.
Trend curves appear green when the price is above the trend line and red when it is below. Trend lines are labeled using the timeframe followed by 'T' (e.g., DT, WT, MT).
The EMA represents the weighted moving average of the most recent eight candles and is labeled with the timeframe followed by 'E' (e.g., DE, WE, ME).
Caution: This indicator is for educational or study purposes only, helping traders analyze the movement of both the EMA and trend lines across multiple price swings over an extended period across multi timeframe to gain proficiency at spotting trends.
Yalnızca davetli komut dosyası
Bu komut dosyasına erişim, yazar tarafından yetkilendirilen kullanıcılarla sınırlıdır ve genellikle ödeme gerektirir. Sık kullanılanlarınıza ekleyebilirsiniz, ancak bunu yalnızca izin talep edip yazarından bu izni aldıktan sonra kullanabileceksiniz. Daha fazla bilgi için JKReddyLin ile iletişime geçin veya yazarın aşağıdaki talimatlarını izleyin.
TradingView, yazarına %100 güvenmediğiniz ve komut dosyasının nasıl çalıştığını anlamadığınız sürece bir komut dosyası için ödeme yapmanızı ve onu kullanmanızı önermez. Çoğu durumda, Topluluk Komut Dosyaları bölümümüzde ücretsiz olarak iyi bir açık kaynak alternatifi bulabilirsiniz.
Yazarın talimatları
″This is a paid indicator and more details can be found at https://jayindicators.com Please enter your tradingview account name in the designated field during payment. Access to the indicator will be granted to the account name provided within 24hrs
Bu komut dosyasını bir grafikte kullanmak ister misiniz?
Uyarı: Erişim talebinde bulunmadan önce lütfen okuyun.
Feragatname
Bilgiler ve yayınlar, TradingView tarafından sağlanan veya onaylanan finansal, yatırım, işlem veya diğer türden tavsiye veya tavsiyeler anlamına gelmez ve teşkil etmez. Kullanım Şartları'nda daha fazlasını okuyun.