PROTECTED SOURCE SCRIPT
JXMJXRS - Wick Rejection Zones
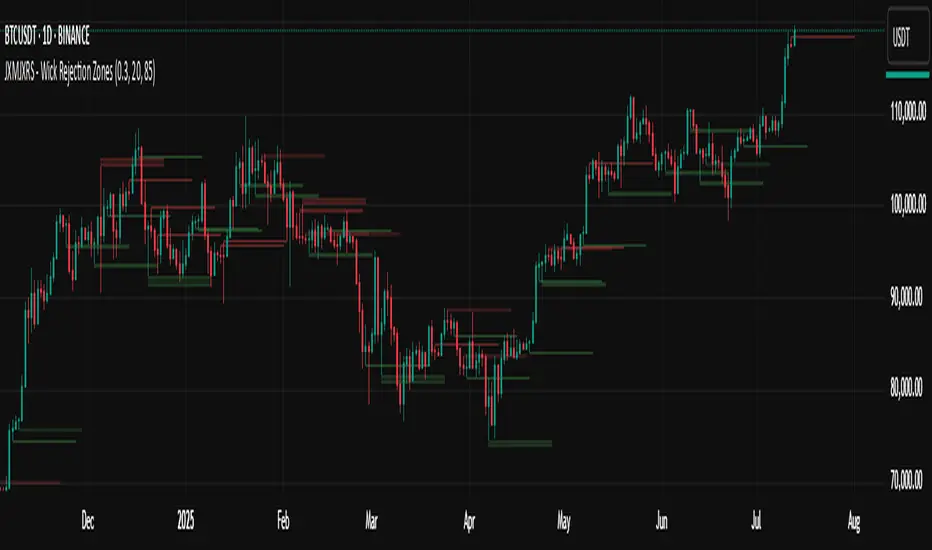
Wick Rejection Zones indicator is designed to identify key price levels where strong rejections occur, typically marked by long wicks and small candle bodies. These zones often signal areas of supply and demand where price was forcefully rejected, making them useful for anticipating potential support or resistance.
The script detects bullish rejection zones when a candle shows a long lower wick, a small body near the top of the candle, and a close above the open. Conversely, bearish rejection zones are identified by long upper wicks, small bodies near the candle low, and a close below the open. This stricter version only highlights the most decisive rejections by enforcing wick dominance and body positioning filters.
When these conditions are met, the indicator draws a colored zone above or below the candle wick to visually represent the rejection area. These zones persist on the chart for a fixed number of bars, allowing traders to reference them for potential reaction levels.
Settings:
Zone Duration (Bars) allows you to control how long each rejection zone remains visible on the chart. A higher number keeps zones active for more bars, while a lower number removes them sooner.
Zone Transparency adjusts the visual opacity of the rejection zones. A lower value makes the zone more visible, while a higher value makes it more transparent.
Bullish Zone Color and Bearish Zone Color let you customize the colors used for bullish and bearish rejection zones, respectively.
This tool is particularly effective in volatile crypto markets where wicks often mark sharp reversals or failed breakout attempts. It can be used as a reference for entries, exits, or stop-loss placement depending on market context.
Korumalı komut dosyası
Bu komut dosyası kapalı kaynak olarak yayınlanmaktadır. Ancak, özgürce ve herhangi bir sınırlama olmaksızın kullanabilirsiniz – daha fazla bilgi burada.
Feragatname
Bilgiler ve yayınlar, TradingView tarafından sağlanan veya onaylanan finansal, yatırım, işlem veya diğer türden tavsiye veya tavsiyeler anlamına gelmez ve teşkil etmez. Kullanım Şartları'nda daha fazlasını okuyun.