PROTECTED SOURCE SCRIPT
Güncellendi AMR-AQR-VolSD-Loc
**Dynamic Volatility Bands**
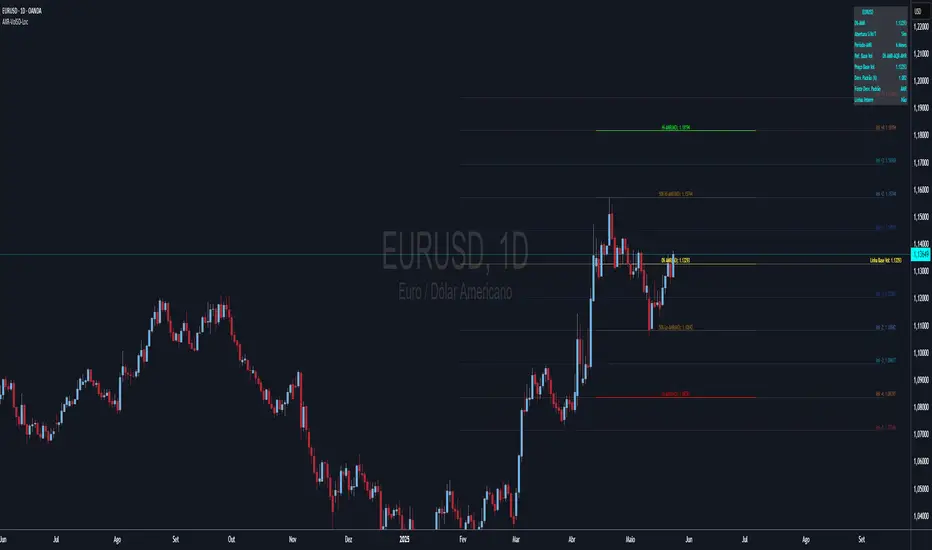
The **Dynamic Volatility Bands** indicator is a powerful tool designed to visualize price volatility and key support/resistance levels based on Average Monthly/Quarterly Range (AMR/AQR) and standard deviation calculations. It plots a base volatility line with customizable upper and lower bands (Vol +1 to +5 and Vol -1 to -5), using a vibrant color progression from blue (#2563EB) to red (#EF4444) for clear visual distinction on dark chart backgrounds like #131722.
**Key Features:**
- **Flexible Volatility Calculation**: Choose between manual standard deviation input or automatic calculation using AMR/AQR ranges, with a scaling factor for fine-tuning.
- **Customizable Levels**: Plot up to 5 upper and 5 lower volatility bands, with options for intermediate (half-step) lines.
- **AMR/AQR Integration**: Displays High, Low, 50% High, 50% Low, and Zero Point levels based on monthly or quarterly ranges, with optional monthly/quarterly open reference.
- **Visual Customization**: Configure line styles, widths, colors, and label positions (right, left, or center). Labels show price levels and can be offset for clarity.
- **Informative Table**: A dynamic table summarizes AMR/AQR levels, volatility settings, and key metrics, with customizable position and appearance.
- **Alerts**: Built-in alerts notify when the price approaches AMR/AQR levels, aiding in timely trading decisions.
**How to Use:**
1. Apply the indicator to your chart and adjust the settings under "Standard Deviation Calculation" to set the volatility source (Manual or AMR/AQR).
2. Customize the number of upper/lower bands and their appearance in the "Volatility Settings" group.
3. Enable the table and alerts to monitor key levels and price movements.
4. Use the vibrant color progression to identify volatility zones: blue for low volatility (Vol ±1) and red for high volatility (Vol ±5).
This indicator is ideal for traders seeking to identify potential support/resistance zones and gauge market volatility dynamically. It’s fully customizable to suit various trading strategies and timeframes.
**Note**: Best viewed on dark chart backgrounds (#131722) for optimal color contrast. Ensure sufficient historical data for accurate AMR/AQR calculations.
Sürüm Notları
Inclusão do Calculo do AWR( range semanal) dentro do calculo de linhas de volatilidade. Korumalı komut dosyası
Bu komut dosyası kapalı kaynak olarak yayınlanmaktadır. Ancak, ücretsiz ve herhangi bir sınırlama olmaksızın kullanabilirsiniz – daha fazla bilgiyi buradan edinebilirsiniz.
Feragatname
Bilgiler ve yayınlar, TradingView tarafından sağlanan veya onaylanan finansal, yatırım, alım satım veya diğer türden tavsiye veya öneriler anlamına gelmez ve teşkil etmez. Kullanım Koşulları bölümünde daha fazlasını okuyun.
Korumalı komut dosyası
Bu komut dosyası kapalı kaynak olarak yayınlanmaktadır. Ancak, ücretsiz ve herhangi bir sınırlama olmaksızın kullanabilirsiniz – daha fazla bilgiyi buradan edinebilirsiniz.
Feragatname
Bilgiler ve yayınlar, TradingView tarafından sağlanan veya onaylanan finansal, yatırım, alım satım veya diğer türden tavsiye veya öneriler anlamına gelmez ve teşkil etmez. Kullanım Koşulları bölümünde daha fazlasını okuyun.