OPEN-SOURCE SCRIPT
Güncellendi Map Multiple QQQ Levels to NQ (Custom Labels)
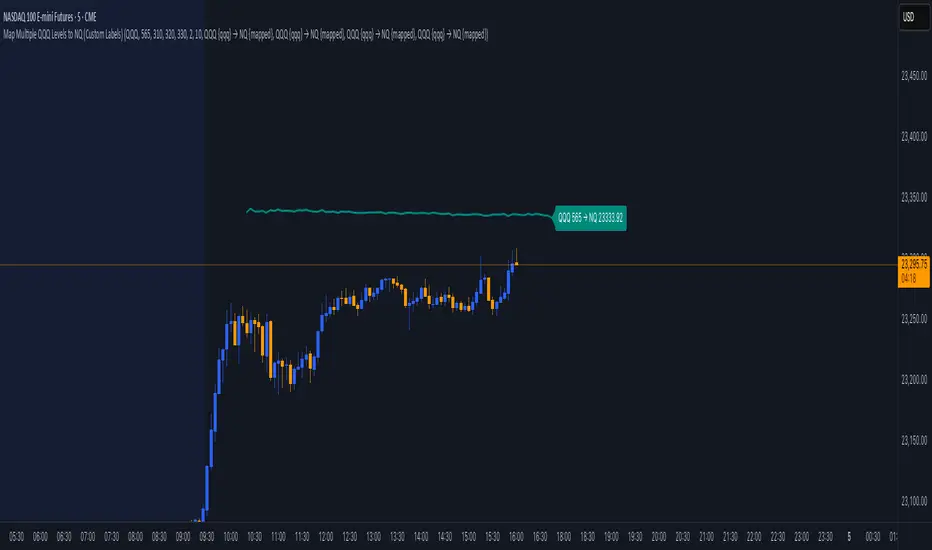
maps user-defined price levels from the QQQ (Invesco QQQ Trust, tracking the NASDAQ-100) to equivalent levels on the NQ (NASDAQ-100 futures) chart, displaying them as colored lines with optional labels. It’s designed to overlay on the NQ chart, helping traders visualize QQQ price levels in terms of NQ values based on the ratio between their prices.
Key Features:
Inputs for QQQ Levels: Users can specify up to four QQQ price levels (default: 300, 310, 320, 330) with a step of 0.1 for precision.
Customizable Appearance: Each level has its own color (default: teal, orange, purple, green) and a shared line width (default: 2).
Time Filters:
Option to display levels only for the current day (show_today_only).
Option to show levels only after 9:30 AM Eastern Time (show_after_open), aligning with market open.
Custom Labels: Each level can have a toggleable label with a customizable template (e.g., "QQQ {qqq} → NQ {mapped}"), showing the QQQ level and its mapped NQ value, formatted to two decimal places.
Dynamic Mapping: Calculates the ratio between NQ and QQQ closing prices to map QQQ levels to NQ equivalents in real-time.
Conditional Display: Levels are plotted only when user-defined conditions (day and time filters) are met, otherwise hidden (na).
Label Placement: Labels are displayed on the last confirmed historical bar, unaffected by time filters, ensuring visibility without cluttering real-time bars.
Sürüm Notları
update chart imageSürüm Notları
update label distanceAçık kaynak kodlu komut dosyası
Gerçek TradingView ruhuyla, bu komut dosyasının mimarı, yatırımcıların işlevselliğini inceleyip doğrulayabilmesi için onu açık kaynaklı hale getirdi. Yazarı tebrik ederiz! Ücretsiz olarak kullanabilseniz de, kodu yeniden yayınlamanın Topluluk Kurallarımıza tabi olduğunu unutmayın.
Feragatname
Bilgiler ve yayınlar, TradingView tarafından sağlanan veya onaylanan finansal, yatırım, alım satım veya diğer türden tavsiye veya öneriler anlamına gelmez ve teşkil etmez. Kullanım Koşulları bölümünde daha fazlasını okuyun.
Açık kaynak kodlu komut dosyası
Gerçek TradingView ruhuyla, bu komut dosyasının mimarı, yatırımcıların işlevselliğini inceleyip doğrulayabilmesi için onu açık kaynaklı hale getirdi. Yazarı tebrik ederiz! Ücretsiz olarak kullanabilseniz de, kodu yeniden yayınlamanın Topluluk Kurallarımıza tabi olduğunu unutmayın.
Feragatname
Bilgiler ve yayınlar, TradingView tarafından sağlanan veya onaylanan finansal, yatırım, alım satım veya diğer türden tavsiye veya öneriler anlamına gelmez ve teşkil etmez. Kullanım Koşulları bölümünde daha fazlasını okuyun.