OPEN-SOURCE SCRIPT
Volume Accumulation Percentage Indicator [LazyBear]
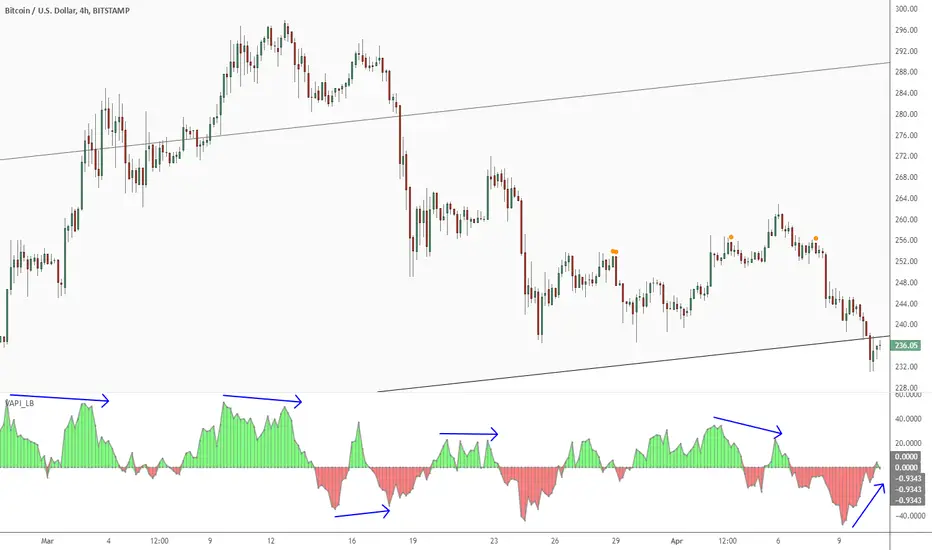
Volume Accumulation Percentage Indicator (VAPI) is a variation of the classic volume-accumulation indicators. It uses volume the same way as OBV except that it assigns volume weights based on intraday volatility.
In a positive trend, if the stock price is close to a (local) new high, the VAPI should be at its maximum as well (and vice versa for a negative trend). If the market is looking for a direction, if the price is in the bottom side of his current trading range and if, at the same moment the VAPI osc slopes up, there is accumulation on the stock and that the prices should start to climb. The SELL signal is given when the VAPI decreases (distribution). Divergences are usually very effective too.
Tuning the "length" parameter may be needed for your instrument (default is 10), do let me know if you find a different value to be optimal for majority of instruments.
List of my public indicators: bit.ly/1LQaPK8
List of my app-store indicators: blog.tradingview.com/?p=970
Açık kaynak kodlu komut dosyası
Gerçek TradingView ruhuna uygun olarak, bu komut dosyasının oluşturucusu bunu açık kaynaklı hale getirmiştir, böylece yatırımcılar betiğin işlevselliğini inceleyip doğrulayabilir. Yazara saygı! Ücretsiz olarak kullanabilirsiniz, ancak kodu yeniden yayınlamanın Site Kurallarımıza tabi olduğunu unutmayın.
List of my free indicators: bit.ly/1LQaPK8
List of my indicators at Appstore: blog.tradingview.com/?p=970
List of my indicators at Appstore: blog.tradingview.com/?p=970
Feragatname
Bilgiler ve yayınlar, TradingView tarafından sağlanan veya onaylanan finansal, yatırım, işlem veya diğer türden tavsiye veya tavsiyeler anlamına gelmez ve teşkil etmez. Kullanım Şartları'nda daha fazlasını okuyun.