vdubus

vdub_Trend_Master_v / v1 / v2 / v3

NEW
*****Trend Master IV ***** UPDATE HERE VDUB-TRENDMASTER-WALL UPDATE HERE User configuration drive.google.co...VdJSnBYc0E/view?usp=sharin...


****Original*****
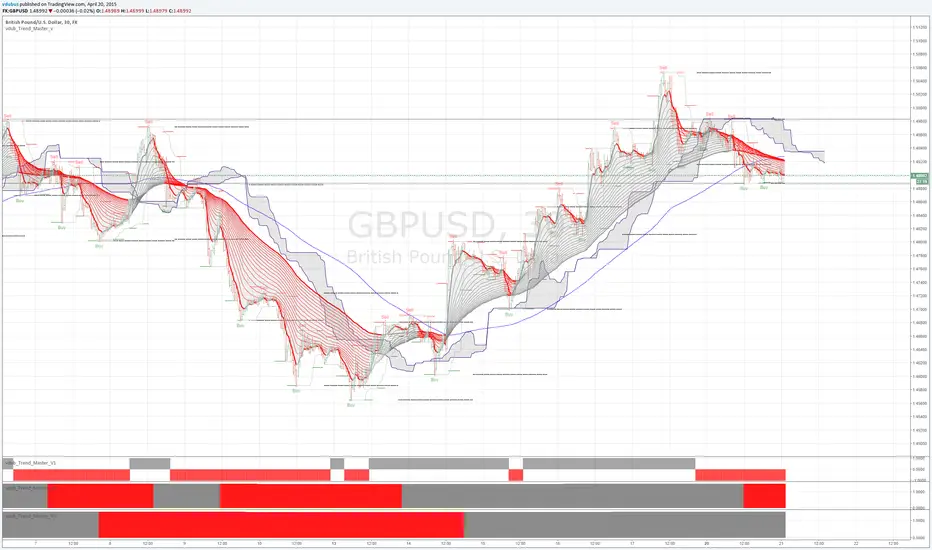
Strategy / vdub_Trend_Master_v / v1 / v2 / v3.
Being foremost a Binary Options Trader, trying to make a move back into forex was/is challenging. I have no problem in finding entry points, but I lacked the ability to hold my positions for longer than the next retracement , as you can imagine this style of trading eats up trading accounts, so I've pulled together a collaboration of code from various indicators in an attempt to keep you (me) in the trend for longer.
the lower Trend power bars Ive designed for easy visual entry, also both short & long exits v1 being the fastest v2 then v3 the longest.. To be use in correlation with the Trend master v (upper) indicator. The strategy I think speaks for it's self, Buy Long & sell Short . :)
Original edited code from authors listed, with thanks
nb. these indicators are still in demo / testing mode & still needs a few tweaks To get all 4 indicators go to the share icon and select 'Make it mine'

test entry Long

Hold Trends for longer -Trend master v3 (Lower power bar ) / 6hr chart

Açık kaynak kodlu komut dosyası

Gerçek TradingView ruhuyla, bu betiğin yazarı, yatırımcının anlayabilmesi ve doğrulayabilmesi için onu açık kaynak olarak yayınladı. Yazarın eline sağlık! Bunu ücretsiz olarak kullanabilirsiniz, ancak bu kodun bir yayında yeniden kullanımı Kullanım Koşulları ile yönetilir. Bir grafikte kullanmak için favorilere ekleyebilirsiniz.

Feragatname

Bilgiler ve yayınlar, TradingView tarafından sağlanan veya onaylanan finansal, yatırım, işlem veya diğer türden tavsiye veya tavsiyeler anlamına gelmez ve teşkil etmez. Kullanım Şartları'nda daha fazlasını okuyun.

Bu komut dosyasını bir grafikte kullanmak ister misiniz?
//Stategy auther vdubus. 
//Original edited code from authers listed below with thanks
study("vdub_Trend_Master_v", shorttitle="vdub_Trend_Master_v", overlay=true)
data = close >= open
//plotshape(data,color=red, style=shape.arrowdown, text="Sell")
//plotshape(not data,location=location.belowbar, color=green, style=shape.arrowup, text="Buy")
//-----------------Built in MA 144-----------------------------------------
m2_src = close
m2_p = input(144, title="MA2 Period:")

plot(sma(m2_src, m2_p), color=blue, linewidth=1, title="MA2")
//==============================================
conversionPeriods = input(34, minval=1),
basePeriods = input(26, minval=1)
laggingSpan2Periods = input(52, minval=1),
displacement = input(26, minval=1)

donchian(len) => avg(lowest(len), highest(len))

conversionLine = donchian(conversionPeriods)
baseLine = donchian(basePeriods)
leadLine1 = avg(conversionLine, baseLine)
leadLine2 = donchian(laggingSpan2Periods)

p1 = plot(leadLine1, offset = displacement,
    title="Lead 1")
p2 = plot(leadLine2, offset = displacement, 
    title="Lead 2")
fill(p1, p2, color=black, transp=90)
//==============================================
//RicardoSantos
ExtremeTimeFrame = input("240")
ExtremeTimeWindow = input(2)

TEH = security(tickerid, ExtremeTimeFrame, highest(ExtremeTimeWindow))
TEL = security(tickerid, ExtremeTimeFrame, lowest(ExtremeTimeWindow))

EH = plot(TEH, color=TEH!=TEH[1]?na:red)
EL = plot(TEL, color=TEL!=TEL[1]?na:green)

//=================================================================================================
// Lachlan Smith
disDaily = input(true, title="Show Daily High & Lows?")
disWeekly = input(false, title="Show Weekly High & Lows?")
disMonthly = input(false, title="Show Monthly High & Lows?")

//Data setup
dHigh = security(tickerid, 'D', high[1]) 
dLow = security(tickerid, 'D', low[1]) 
wHigh = security(tickerid, 'W', high[1]) 
wLow = security(tickerid, 'W', low[1]) 
mHigh = security(tickerid, 'M', high[1])
mLow = security(tickerid, 'M', low[1]) 


plot(disDaily and dHigh ? dHigh : na, title="Daily High",style=cross, color=black,linewidth=1, trackprice = true) 
plot(disDaily and dLow ? dLow : na, title="Daily Low",style=cross, color=black,linewidth=1, trackprice = true) 
plot(disWeekly and wHigh ? dHigh : na, title="Weekly High",style=cross, color=silver,linewidth=1, trackprice = true) 
plot(disWeekly and wLow ? dLow : na, title="Weekly Low",style=cross, color=silver,linewidth=1, trackprice = true)  
plot(disMonthly and mHigh ? dHigh : na, title="Monthly High",style=cross, color=silver,linewidth=1, trackprice = true) 
plot(disMonthly and mLow ? dLow : na, title="Monthly Low",style=cross, color=silver,linewidth=1, trackprice = true)  

//===================================================================================================

//
// Madrid

exponential = input(true, title="Exponential MA")

src = close

ma05 = exponential ? ema(src, 05) : sma(src, 05)
ma10 = exponential ? ema(src, 10) : sma(src, 10)
ma15 = exponential ? ema(src, 15) : sma(src, 15)
ma20 = exponential ? ema(src, 20) : sma(src, 20)
ma25 = exponential ? ema(src, 25) : sma(src, 25)
ma30 = exponential ? ema(src, 30) : sma(src, 30)
ma35 = exponential ? ema(src, 35) : sma(src, 35)
ma40 = exponential ? ema(src, 40) : sma(src, 40)
ma45 = exponential ? ema(src, 45) : sma(src, 45)
ma50 = exponential ? ema(src, 50) : sma(src, 50)
ma55 = exponential ? ema(src, 55) : sma(src, 55)
ma60 = exponential ? ema(src, 60) : sma(src, 60)
ma65 = exponential ? ema(src, 65) : sma(src, 65)
ma70 = exponential ? ema(src, 70) : sma(src, 70)
ma75 = exponential ? ema(src, 75) : sma(src, 75)
ma80 = exponential ? ema(src, 80) : sma(src, 80)
ma85 = exponential ? ema(src, 85) : sma(src, 85)
ma90 = exponential ? ema(src, 90) : sma(src, 90)
ma100 = exponential ? ema(src, 100) : sma(src, 100)

leadMAColor = change(ma05)>=0 and ma05>ma100 ? gray
            : change(ma05)<0  and ma05>ma100 ? red
            : change(ma05)<=0 and ma05<ma100 ? red
            : change(ma05)>=0 and ma05<ma100 ? silver
            : gray
maColor(ma, maRef) => 
              change(ma)>=0 and ma05>maRef ? gray
            : change(ma)<0  and ma05>maRef ? red
            : change(ma)<=0 and ma05<maRef ? red
            : change(ma)>=0 and ma05<maRef ? silver
            : gray
            
plot( ma05, color=leadMAColor, style=line, title="MMA05", linewidth=3)
plot( ma10, color=maColor(ma10,ma100), style=line, title="MMA10", linewidth=1)
plot( ma15, color=maColor(ma15,ma100), style=line, title="MMA15", linewidth=1)
plot( ma20, color=maColor(ma20,ma100), style=line, title="MMA20", linewidth=1)
plot( ma25, color=maColor(ma25,ma100), style=line, title="MMA25", linewidth=1)
plot( ma30, color=maColor(ma30,ma100), style=line, title="MMA30", linewidth=1)
plot( ma35, color=maColor(ma35,ma100), style=line, title="MMA35", linewidth=1)
plot( ma40, color=maColor(ma40,ma100), style=line, title="MMA40", linewidth=1)
plot( ma45, color=maColor(ma45,ma100), style=line, title="MMA45", linewidth=1)
plot( ma50, color=maColor(ma50,ma100), style=line, title="MMA50", linewidth=1)
plot( ma55, color=maColor(ma55,ma100), style=line, title="MMA55", linewidth=1)
plot( ma60, color=maColor(ma60,ma100), style=line, title="MMA60", linewidth=1)
plot( ma65, color=maColor(ma65,ma100), style=line, title="MMA65", linewidth=1)
plot( ma70, color=maColor(ma70,ma100), style=line, title="MMA70", linewidth=1)
plot( ma75, color=maColor(ma75,ma100), style=line, title="MMA75", linewidth=1)
plot( ma80, color=maColor(ma80,ma100), style=line, title="MMA80", linewidth=1)
plot( ma85, color=maColor(ma85,ma100), style=line, title="MMA85", linewidth=1)
plot( ma90, color=maColor(ma90,ma100), style=line, title="MMA90", linewidth=3)
//==================
//
// Madrid
//study(title="Madrid Profit Area", shorttitle="MPA", overlay=true)
//src = close
fastLen = input(5, minval=1, title="Fast MA Length")
slowLen = input(90, minval=1, title="Slow MA Length")
exponential_1 = input(true)

fastMA = exponential_1 ? ema(src, fastLen) : sma(src, fastLen)
slowMA = exponential_1 ? ema(src, slowLen) : sma(src, slowLen)
colorFMA = change(fastMA)>0 ? silver : red
colorSMA = change(slowMA)>0 ? silver : red

p5=plot(fastMA, color=colorFMA, linewidth=1)
p6=plot(slowMA, color=colorSMA, linewidth=1)

fill(p5, p6, color=silver, transp=75)

//======================================================================
//Jurij
h_left = input(title="h left", type=integer, defval=10)
h_right = input(title="h right", type=integer, defval=10)
show_ptz = input(title="Show PTZ", type=bool, defval=true)
show_channel = input(title="Show channel", type=bool, defval=true)
//barCount = nz(barCount[1]) + 1
//check history and realtime PTZ
h_left_low = lowest(h_left)
h_left_high = highest(h_left)
newlow = low <= h_left_low
newhigh = high >= h_left_high
channel_high = plot(show_channel ? h_left_low : 0, color=silver)
channel_low = plot (show_channel ? h_left_high : 0, color=silver)
central_bar_low = low[h_right + 1]
central_bar_high = high[h_right + 1]
full_zone_low = lowest(h_left + h_right + 1)
full_zone_high = highest(h_left + h_right + 1)
central_bar_is_highest = central_bar_high >= full_zone_high
central_bar_is_lowest = central_bar_low <= full_zone_low
plotchar(central_bar_is_highest ? -1 : 0, offset=-h_right-1 ,color=red, text="Sell")
plotchar(central_bar_is_lowest ? 1 : 0, offset=-h_right-1 ,location=location.belowbar, color=green, text="Buy")