OPEN-SOURCE SCRIPT
Güncellendi Dot indicator - Daily candle opened above the daily EMA baseline
https://www.tradingview.com/x/PHTOoLHz/
//version=3
//Written by David Carruthers
//Objective
//This is to support scanning the market to check if the daily candle opened above the daily EMA baseline for a selected pair
//This can be done in some measure by using trading view's screening tools
//However it would be useful, if someone references a pair, to instantly see if that pair opened above the daily baseline regardless of what resolution you are in
//This script, works out a green dot if the pairs daily candle opened above the daily EMA baseline, and a red dot if it didn't
//It then displays a green or red dot on the open for the last candle you are looking at regardless of resolution
//This saves jumping back and forth between the daily resolution and current resolution
Note please excuse my Pine scripting I am new to it :-)
Sürüm Notları
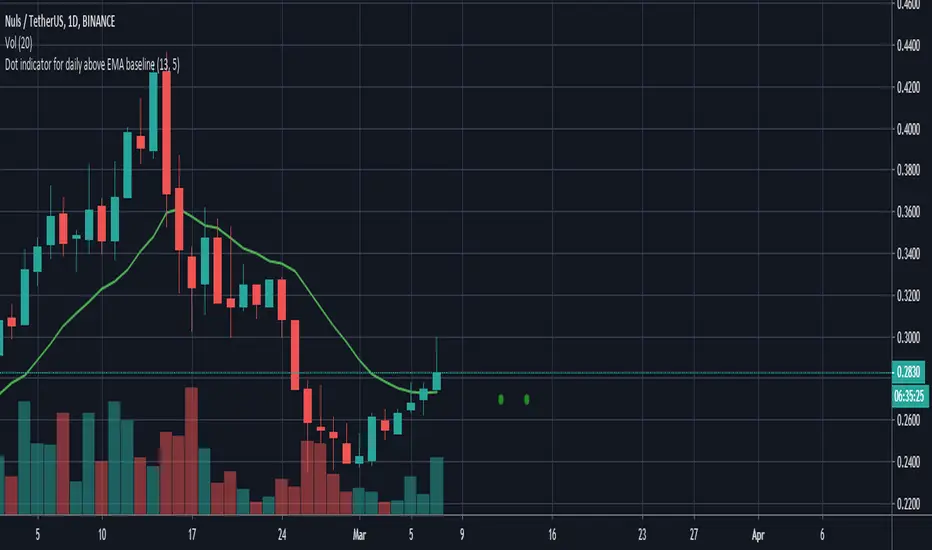
Brand new version of the Daily baseline scriptThere are now 2 x dots offset to the right
Left dot: Did the current daily candle open above the daily EMA baseline ?
Right dot: Did the latest candle in the current resolution open above the Daily EMA baseline?
This allows you to keep on an resolution, for example 1 hour, and if I see a green dot to the left and a red dot to the right, I can see that the daily candle opened above the EMA baseline, but the current hourly is below it.
Açık kaynak kodlu komut dosyası
Gerçek TradingView ruhuyla, bu komut dosyasının mimarı, yatırımcıların işlevselliğini inceleyip doğrulayabilmesi için onu açık kaynaklı hale getirdi. Yazarı tebrik ederiz! Ücretsiz olarak kullanabilseniz de, kodu yeniden yayınlamanın Topluluk Kurallarımıza tabi olduğunu unutmayın.
Feragatname
Bilgiler ve yayınlar, TradingView tarafından sağlanan veya onaylanan finansal, yatırım, alım satım veya diğer türden tavsiye veya öneriler anlamına gelmez ve teşkil etmez. Kullanım Koşulları bölümünde daha fazlasını okuyun.