INVITE-ONLY SCRIPT
VSA + Volume Oscillator [@TradersVenue]
Güncellendi
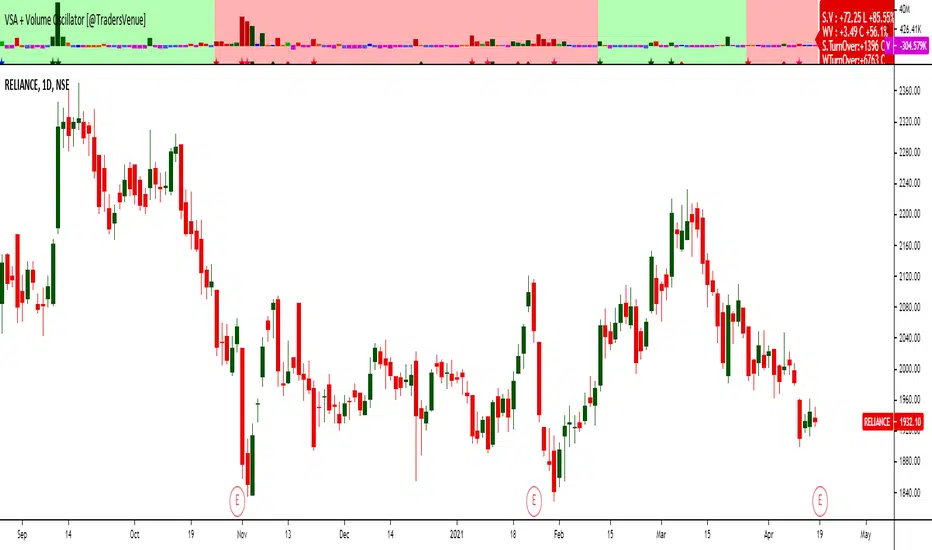
Volume is very crucial while trading, as it indicates the participants interest in the script. Focus is to look for the high volume candles which had a significant price action to initiate a trade on the scrip. This volume indicator combines the VSA signals along with volume and highlights price action using different symbols.
Highlights:
Major Sign of Strength (SoS) - Downthrust Bar supported by momentum & in the direction of trend (Green Star Under the candle)
Any candle highlighted with a Green star is a solid breakout candle where price volume action indicates that participants wants the price to move up. This is normally a wide range bar with ultra high volume closing near the upper part of the candle. Also the trend and momentum favours the breakout which is identified using MA & RSI to support the bullish case.
Major Sign of Weakness (SoW) - Upthrust Bar supported by momentum & in the direction of trend (Red Star Under the candle)
Any candle highlighted with a Red star is a solid breakdown candle where price volume action indicates that participants wants the price to move down. This is normally a wide range bar with ultra high volume closing near the lower part of the candle. Also the trend and momentum favours the breakout which is identified using MA & RSI to support the bullish case.
Normally prefer trading the scrip in the direction of breakout or breakdown after noticing a starcandle. Apart from that there are some important VSA signals for which quick cheet sheet is given below.
Sign of Strength (SoS) - Green Star/Circle/Square
Sign of Weakness (SoW) - Red Star/Circle/Square
Circle represents - Stopping Volume (SV) if green, Supply Overcomes Demand (SoD) if red.
Square represents a TrendReversal (TR), if green bullish, if red bearish
Apart from that you can view the volumes either in the form of oscillator which is calculated basis the standard deviation or normal volumes. Deep Green/Green volume bars represent high volume green candle. Deep Red/Red candle represents high volume sell candle. Pink and blue candles are those where volume action is low or negligible to take any trade basis that. Prefer using the indicator with default settings.
Price action is least lagging indicator as compared to other indicators. And as usual no indicator has 100% success rate. So I urge all users not to consider this as a holy grail. This indicator need to be used along with the VSA signal indicator (which can be plotted on the chart) and RSI indicator which is provided as full VSA trading setup for swing trades. The overall usage will be provided through a demo to the subscribing users. In order to gain access to this indicator you may contact me using the below signature.
Sürüm Notları
Below fixes done on the script1) Color change basis volatility shift and VSA breakouts. Now background color remains green after a VSA Breakout till next Breakdown and vice versa.
2) Added alerts for "VSA BreakOut" and "VSA Breakdown"
3) At times the VSA highlighting symbols were not visible. Did fix so that it remains visible all times when oscillator mode is active.
Sürüm Notları
There is a major change. Upgrade your script to take the benefit of the change. If you have already applied the script, then you can change its version to latest.1) Added Turnover information for current timeframe candle and higher timeframe candle. D=Daily W=Weekly
2) Added volume for current candle and higher timeframe candle.
3) Just move mouse over the label to see the tool tip on shortcuts.
Sürüm Notları
Must have update. Enhancements for scalping in 3/5/10M timeframes.Sürüm Notları
Updated the publishing removing other indicators. No major changes done in this release.Yalnızca davetli komut dosyası
Bu komut dosyasına erişim, yazar tarafından yetkilendirilen kullanıcılarla sınırlıdır ve genellikle ödeme gerektirir. Sık kullanılanlarınıza ekleyebilirsiniz, ancak bunu yalnızca izin talep edip yazarından bu izni aldıktan sonra kullanabileceksiniz. Daha fazla bilgi için TradersVenue ile iletişime geçin veya yazarın aşağıdaki talimatlarını izleyin.
TradingView, yazarına %100 güvenmediğiniz ve komut dosyasının nasıl çalıştığını anlamadığınız sürece bir komut dosyası için ödeme yapmanızı ve onu kullanmanızı önermez. Çoğu durumda, Topluluk Komut Dosyaları bölümümüzde ücretsiz olarak iyi bir açık kaynak alternatifi bulabilirsiniz.
Yazarın talimatları
″You can connect to me directly using the details given in signature field for gaining access to the script
Bu komut dosyasını bir grafikte kullanmak ister misiniz?
Uyarı: Erişim talebinde bulunmadan önce lütfen okuyun.
For queries, suggestions, access requests you can reach out to me using below social media handles.
EMail_ID:- support@tradersvenue.com
Telegram: t.me/TradersVenue
Twitter: twitter.com/PB_Fin
YouTube: youtube.com/channel
EMail_ID:- support@tradersvenue.com
Telegram: t.me/TradersVenue
Twitter: twitter.com/PB_Fin
YouTube: youtube.com/channel
Feragatname
Bilgiler ve yayınlar, TradingView tarafından sağlanan veya onaylanan finansal, yatırım, işlem veya diğer türden tavsiye veya tavsiyeler anlamına gelmez ve teşkil etmez. Kullanım Şartları'nda daha fazlasını okuyun.