OPEN-SOURCE SCRIPT
Circuit % Marker w/ Mirrored Arrows
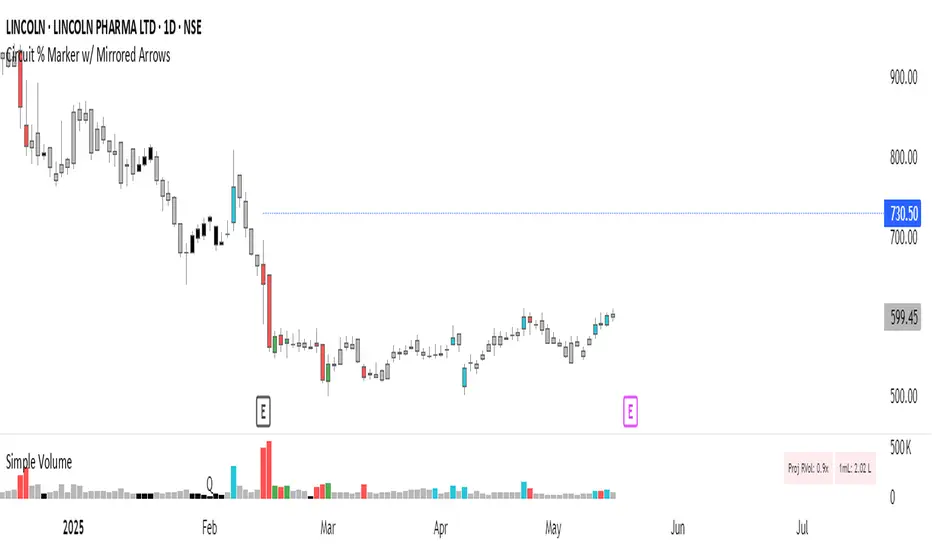
📈 Indian Market Circuit Limit Change Tracker
This indicator automatically tracks circuit limit changes (price bands) as applied in NSE/BSE stocks.
🧠 How It Works:
Start from a user-defined initial circuit limit (e.g. 10%)
If the upper or lower limit is hit, the script waits for a user-defined cooling period (e.g. 5 trading days)
After that, it automatically adjusts to the next lower or higher band (e.g. from 10% to 5%)
Shows a visual label with the current circuit % right on the chart — placed above or below candles for better visibility
🔧 Custom Inputs:
Starting Circuit % — choose between standard NSE/BSE values (20%, 10%, 5%, 2%)
Cooling Days — how many days must pass after a circuit hit before it’s allowed to change again
Label Positioning, Color, and Size — fully customizable to suit your chart style
🚫 No Clutter:
Doesn’t draw circuit limit lines
Just clean, small labels at key turning points — as seen in real trading dashboards
🔍 Notes:
NSE and BSE manually assign circuit bands — this script does not fetch live exchange data
Use it as a visual tracker and simulator of how circuit behavior would evolve under fixed rules
Açık kaynak kodlu komut dosyası
Gerçek TradingView ruhuyla, bu komut dosyasının mimarı, yatırımcıların işlevselliğini inceleyip doğrulayabilmesi için onu açık kaynaklı hale getirdi. Yazarı tebrik ederiz! Ücretsiz olarak kullanabilseniz de, kodu yeniden yayınlamanın Topluluk Kurallarımıza tabi olduğunu unutmayın.
Feragatname
Bilgiler ve yayınlar, TradingView tarafından sağlanan veya onaylanan finansal, yatırım, alım satım veya diğer türden tavsiye veya öneriler anlamına gelmez ve teşkil etmez. Kullanım Koşulları bölümünde daha fazlasını okuyun.