OPEN-SOURCE SCRIPT
NQ YM Correlation 1 min data
Overview
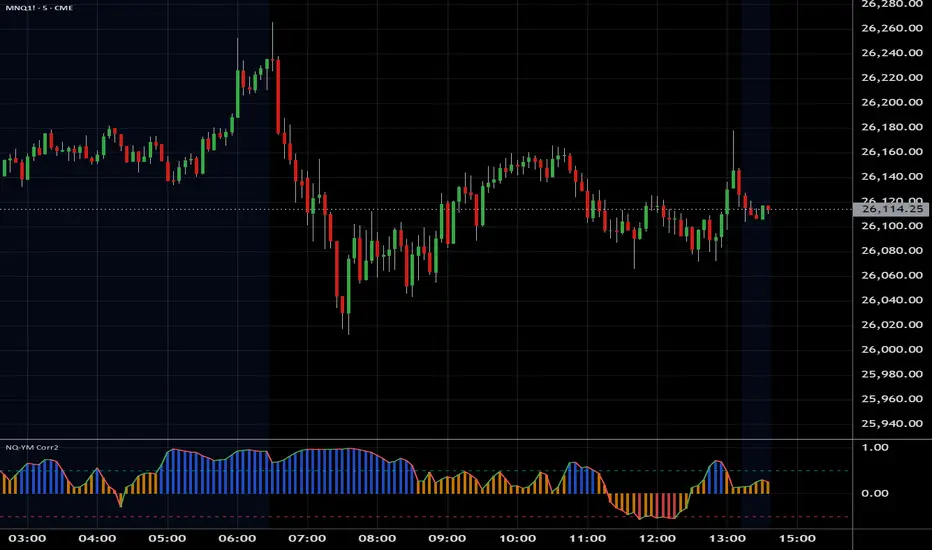
This indicator plots the correlation between Nasdaq 100 (NQ) and Dow Jones (YM) futures. It is specifically designed to act as an "Engine RPM" gauge for pairs traders who trade divergence or spread breakouts—not mean reversion.
To ensure consistent readings, this indicator always calculates using a 1-minute timeframe data, regardless of the chart timeframe you are currently viewing.
The core idea is:
High Correlation (Blue Zone): "Low RPM" or "Engine Idle." NQ and YM are moving together. The spread is flat. This is a no-trade zone.
Low Correlation (Red Zone): "High RPM" or "Engine Hot." NQ and YM are diverging. The spread is moving. This is the primary trade zone.
Açık kaynak kodlu komut dosyası
Gerçek TradingView ruhuyla, bu komut dosyasının mimarı, yatırımcıların işlevselliğini inceleyip doğrulayabilmesi için onu açık kaynaklı hale getirdi. Yazarı tebrik ederiz! Ücretsiz olarak kullanabilseniz de, kodu yeniden yayınlamanın Topluluk Kurallarımıza tabi olduğunu unutmayın.
Feragatname
Bilgiler ve yayınlar, TradingView tarafından sağlanan veya onaylanan finansal, yatırım, alım satım veya diğer türden tavsiye veya öneriler anlamına gelmez ve teşkil etmez. Kullanım Koşulları bölümünde daha fazlasını okuyun.